The Solar with Battery App is working great but I find that the graph is a bit “busy” when it comes to displaying data compared to the older version without the battery.
Typically I just need to see house consumption levels and self generated values, with the battery percentage information. On a small tablet that I have organised for my elderly parents its particularily bad. I’ve been looking through the php and I was wondering if it’s possibly to add the battery percentage to the old graph and move the old graph to the new app? I’ll attach two photos, to show what I mean-
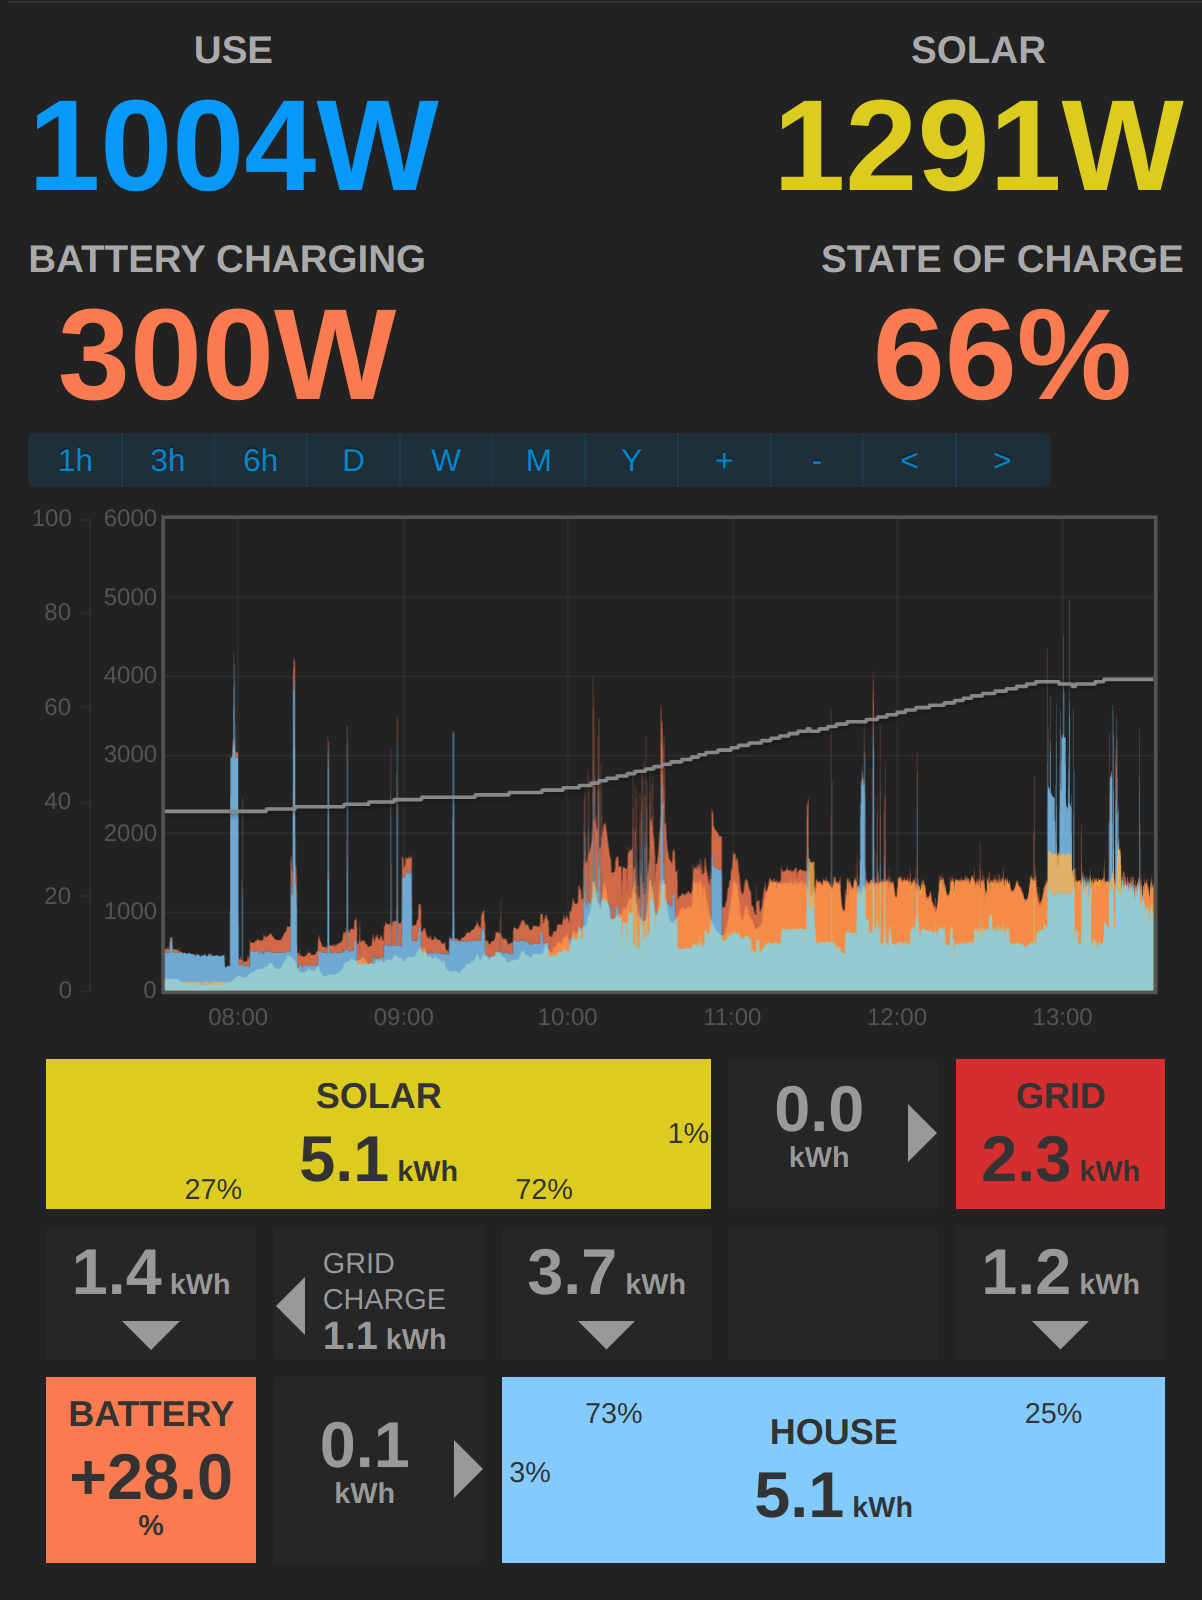
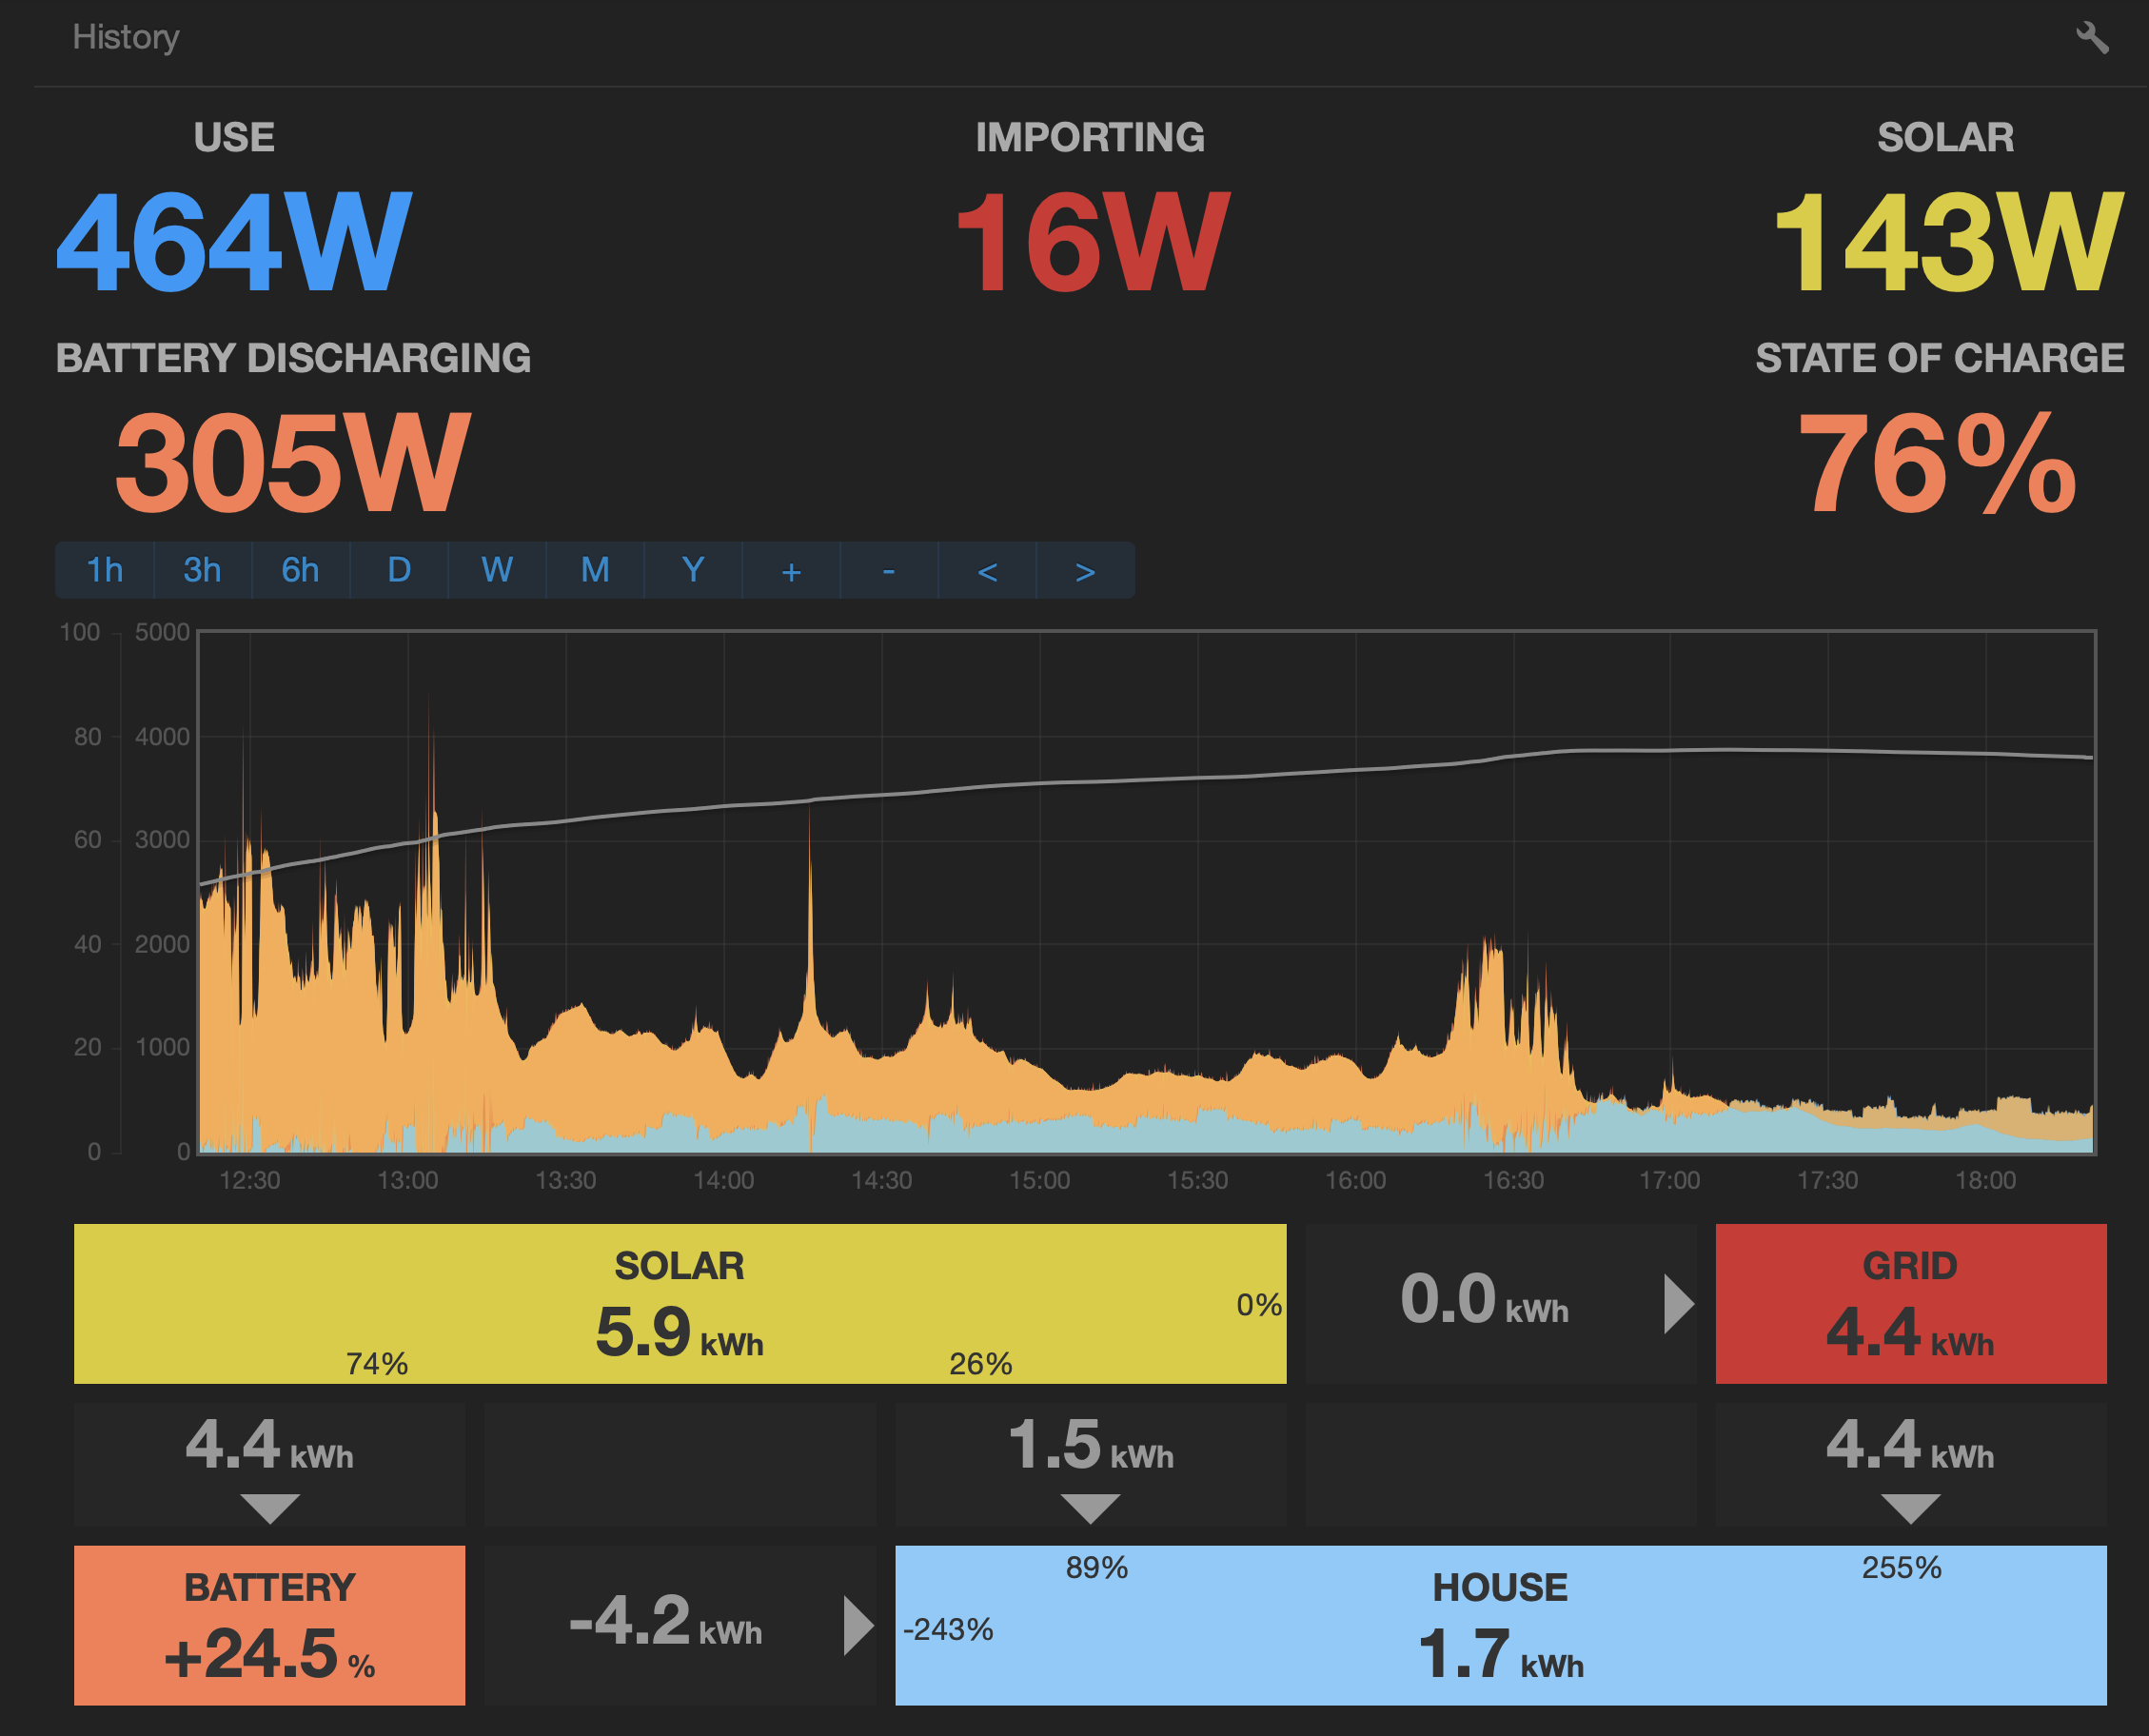
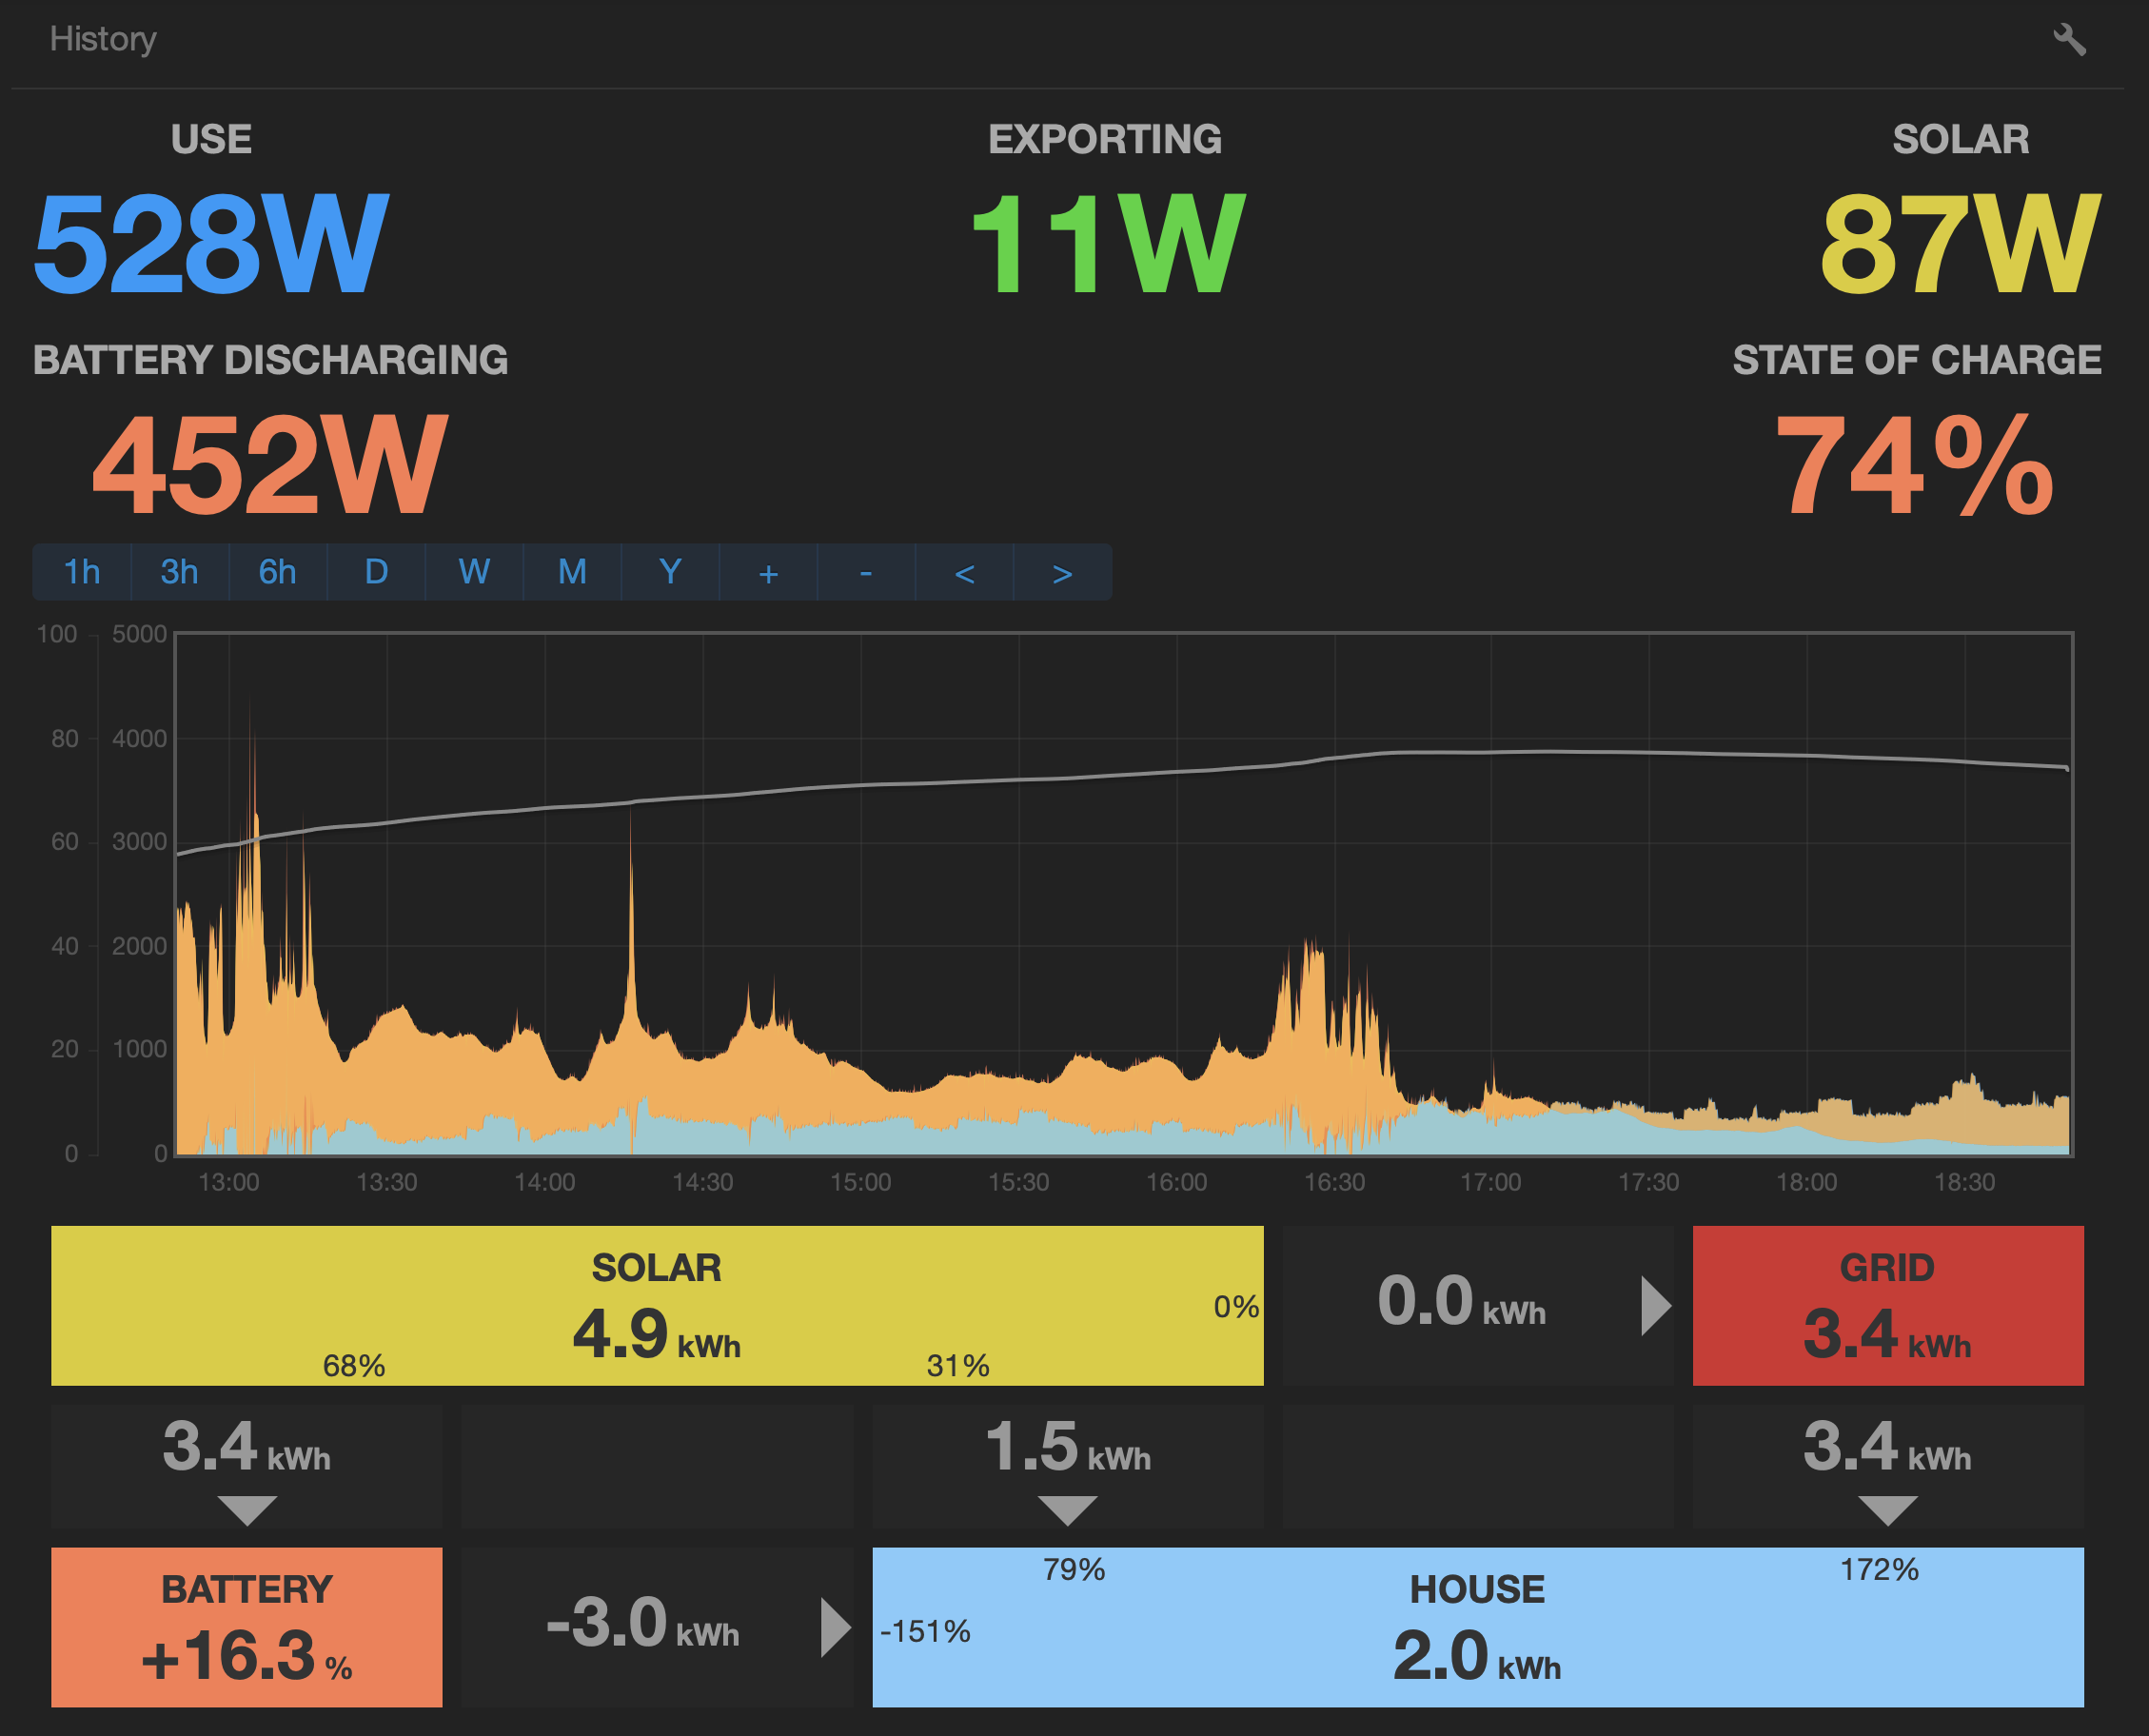
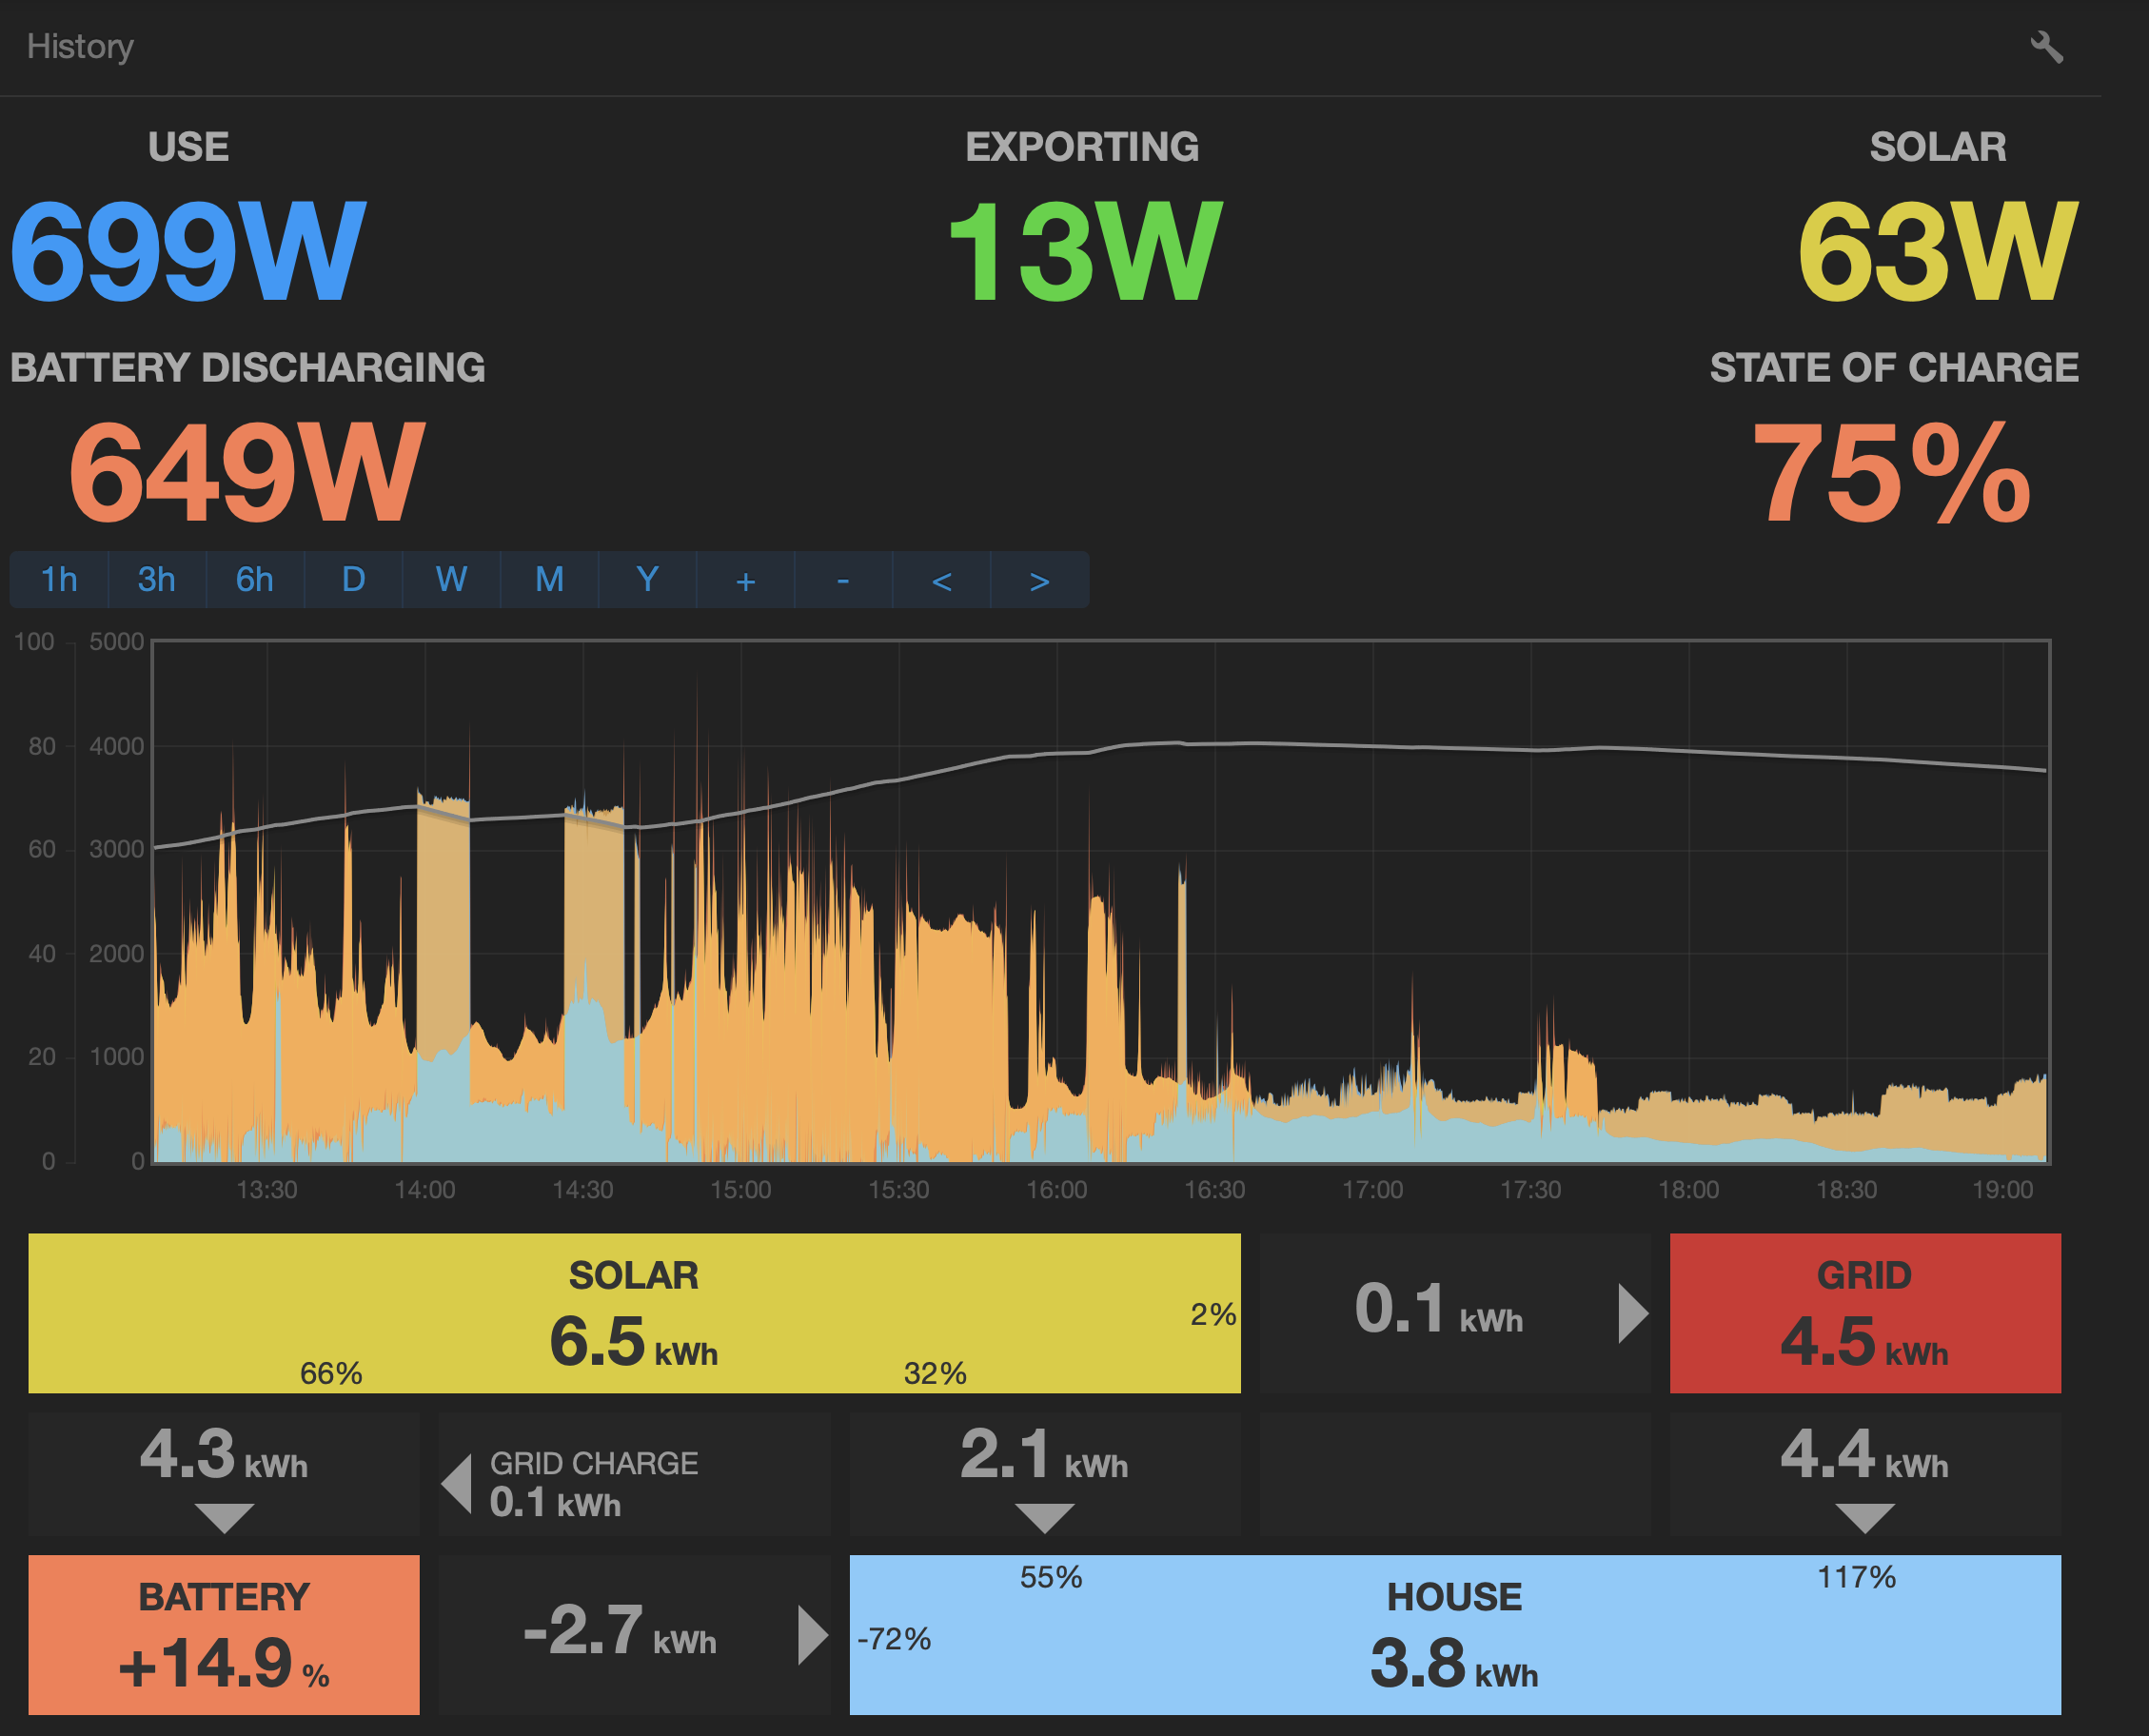
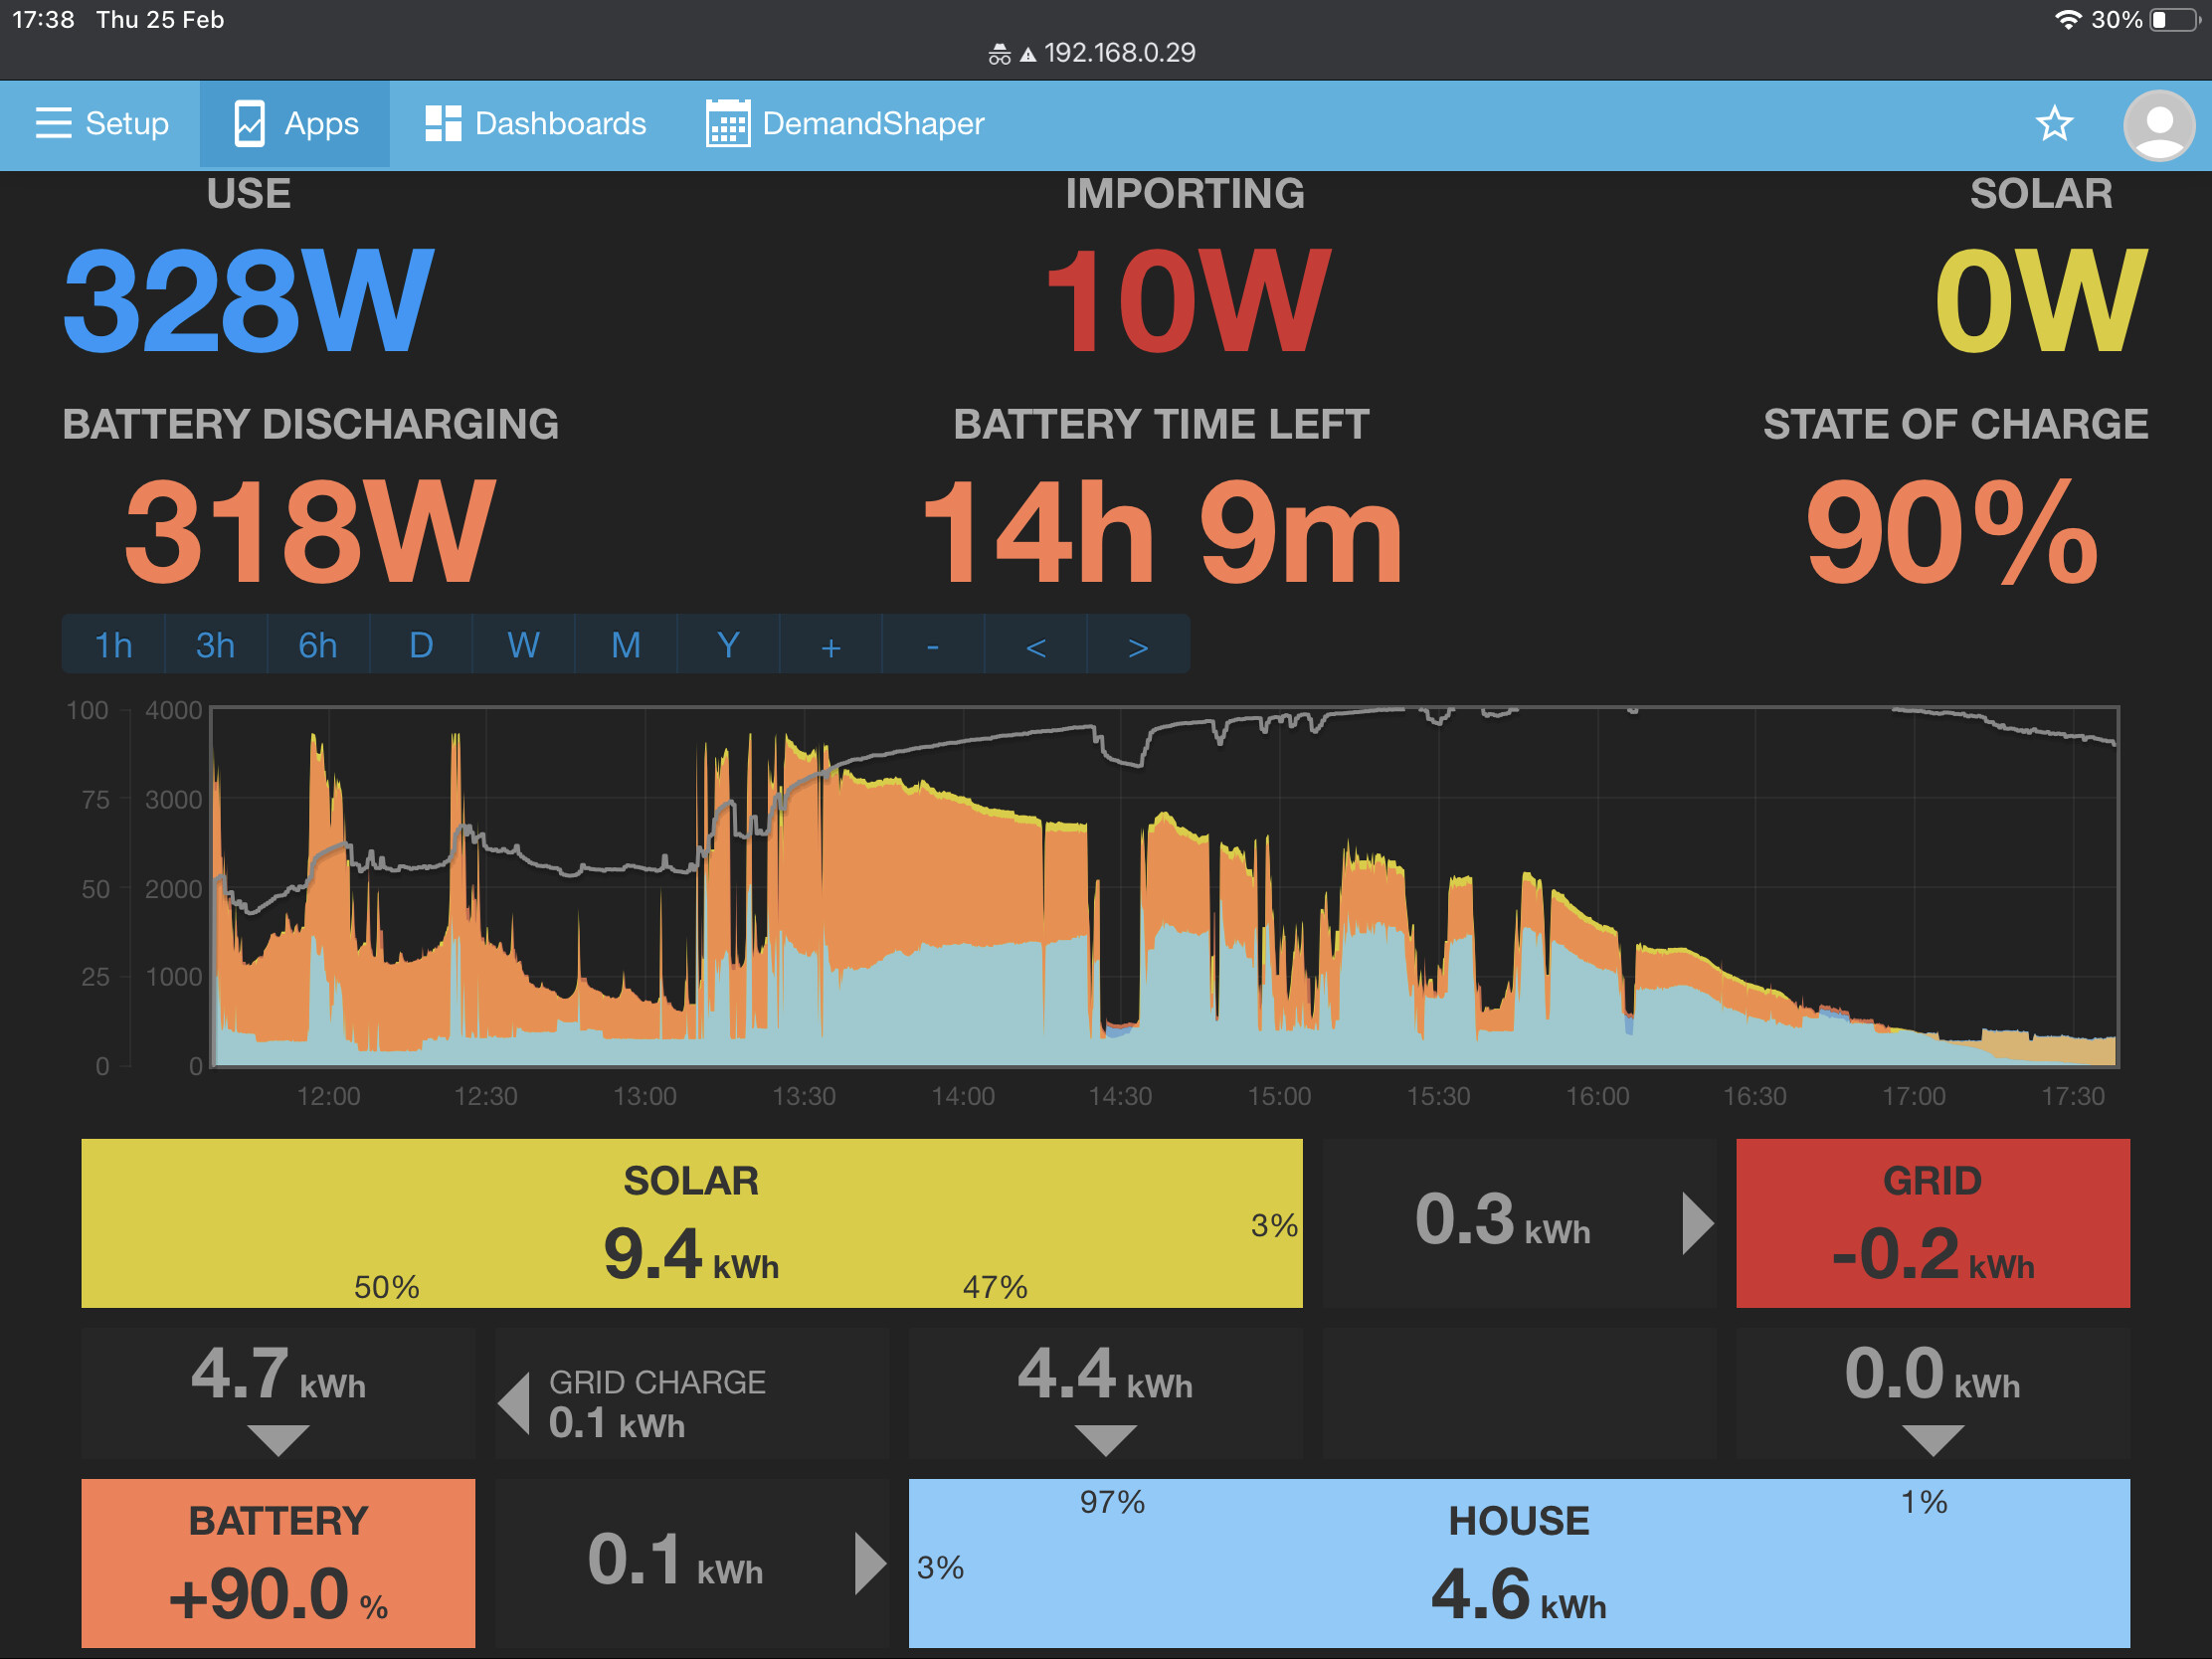
Here we have the My Solar with Battery but the graph shows a lot of overlapping information and it’s hard to determine what’s going on. (You may have noticed that I removed the import/export field, I did that because in my use case this is a “derived” value and it typically drifts into an incorrect value)
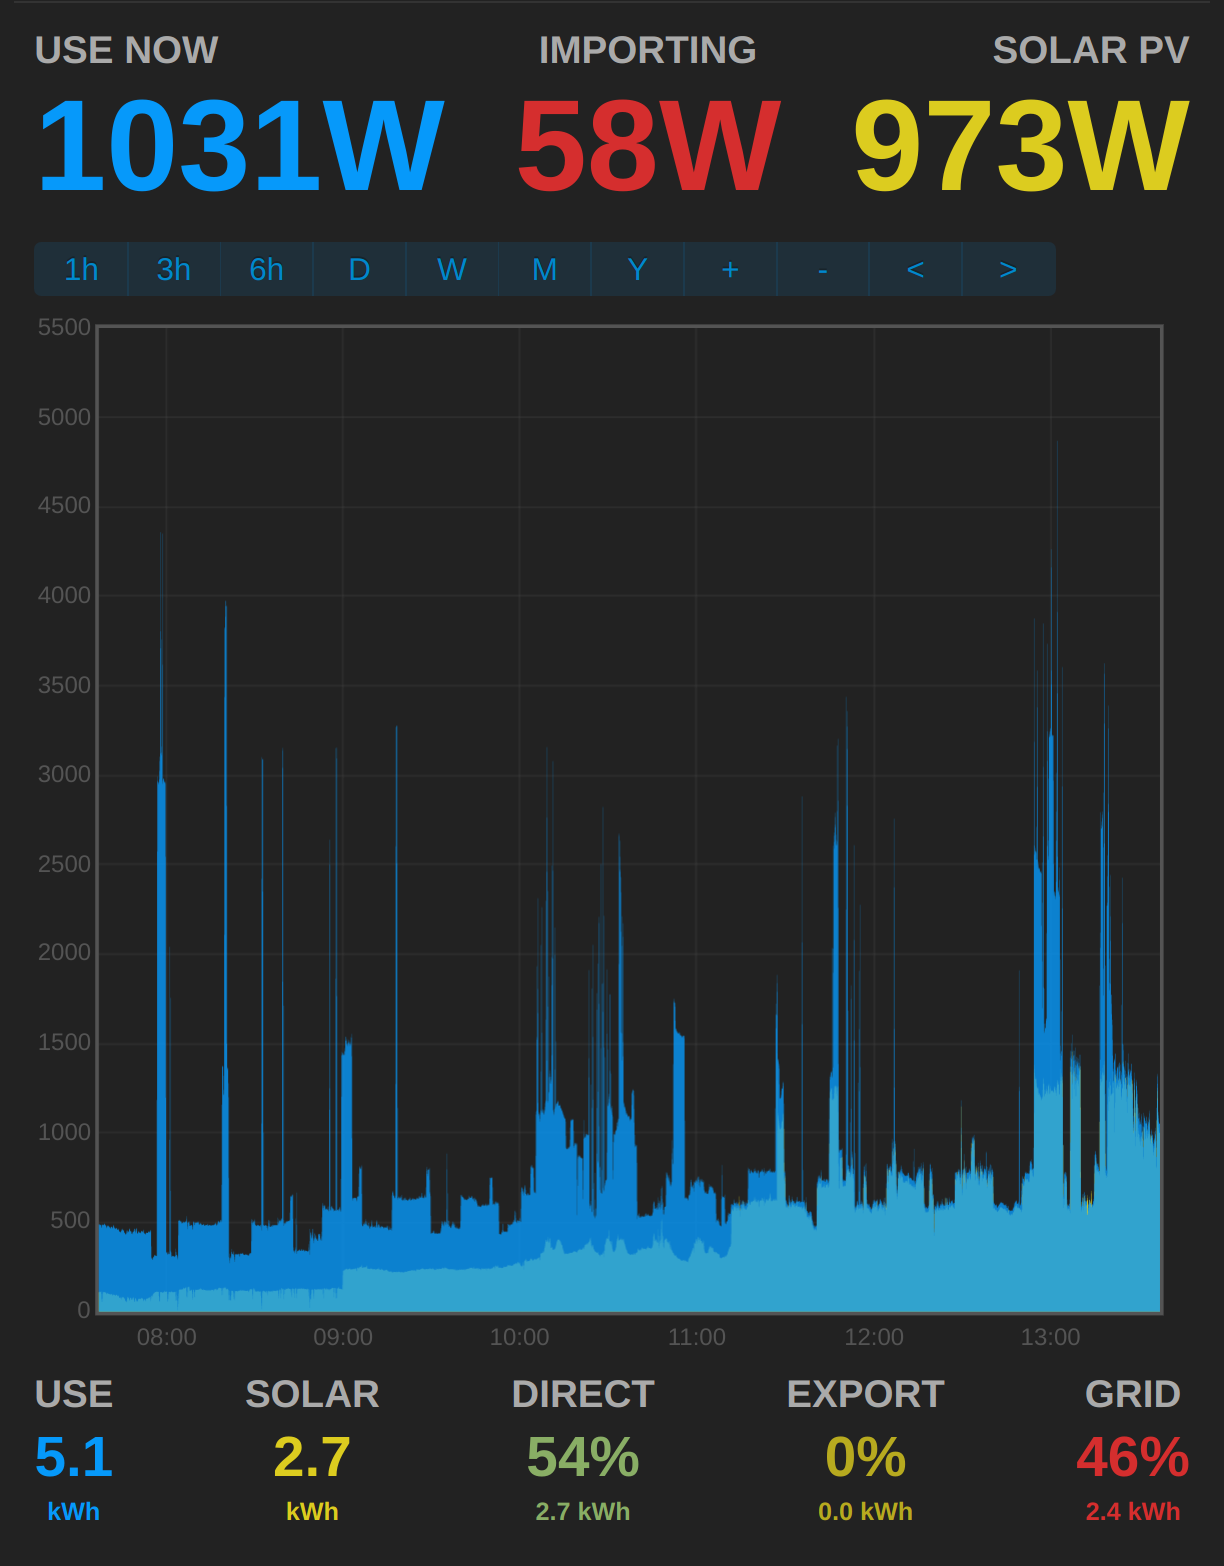
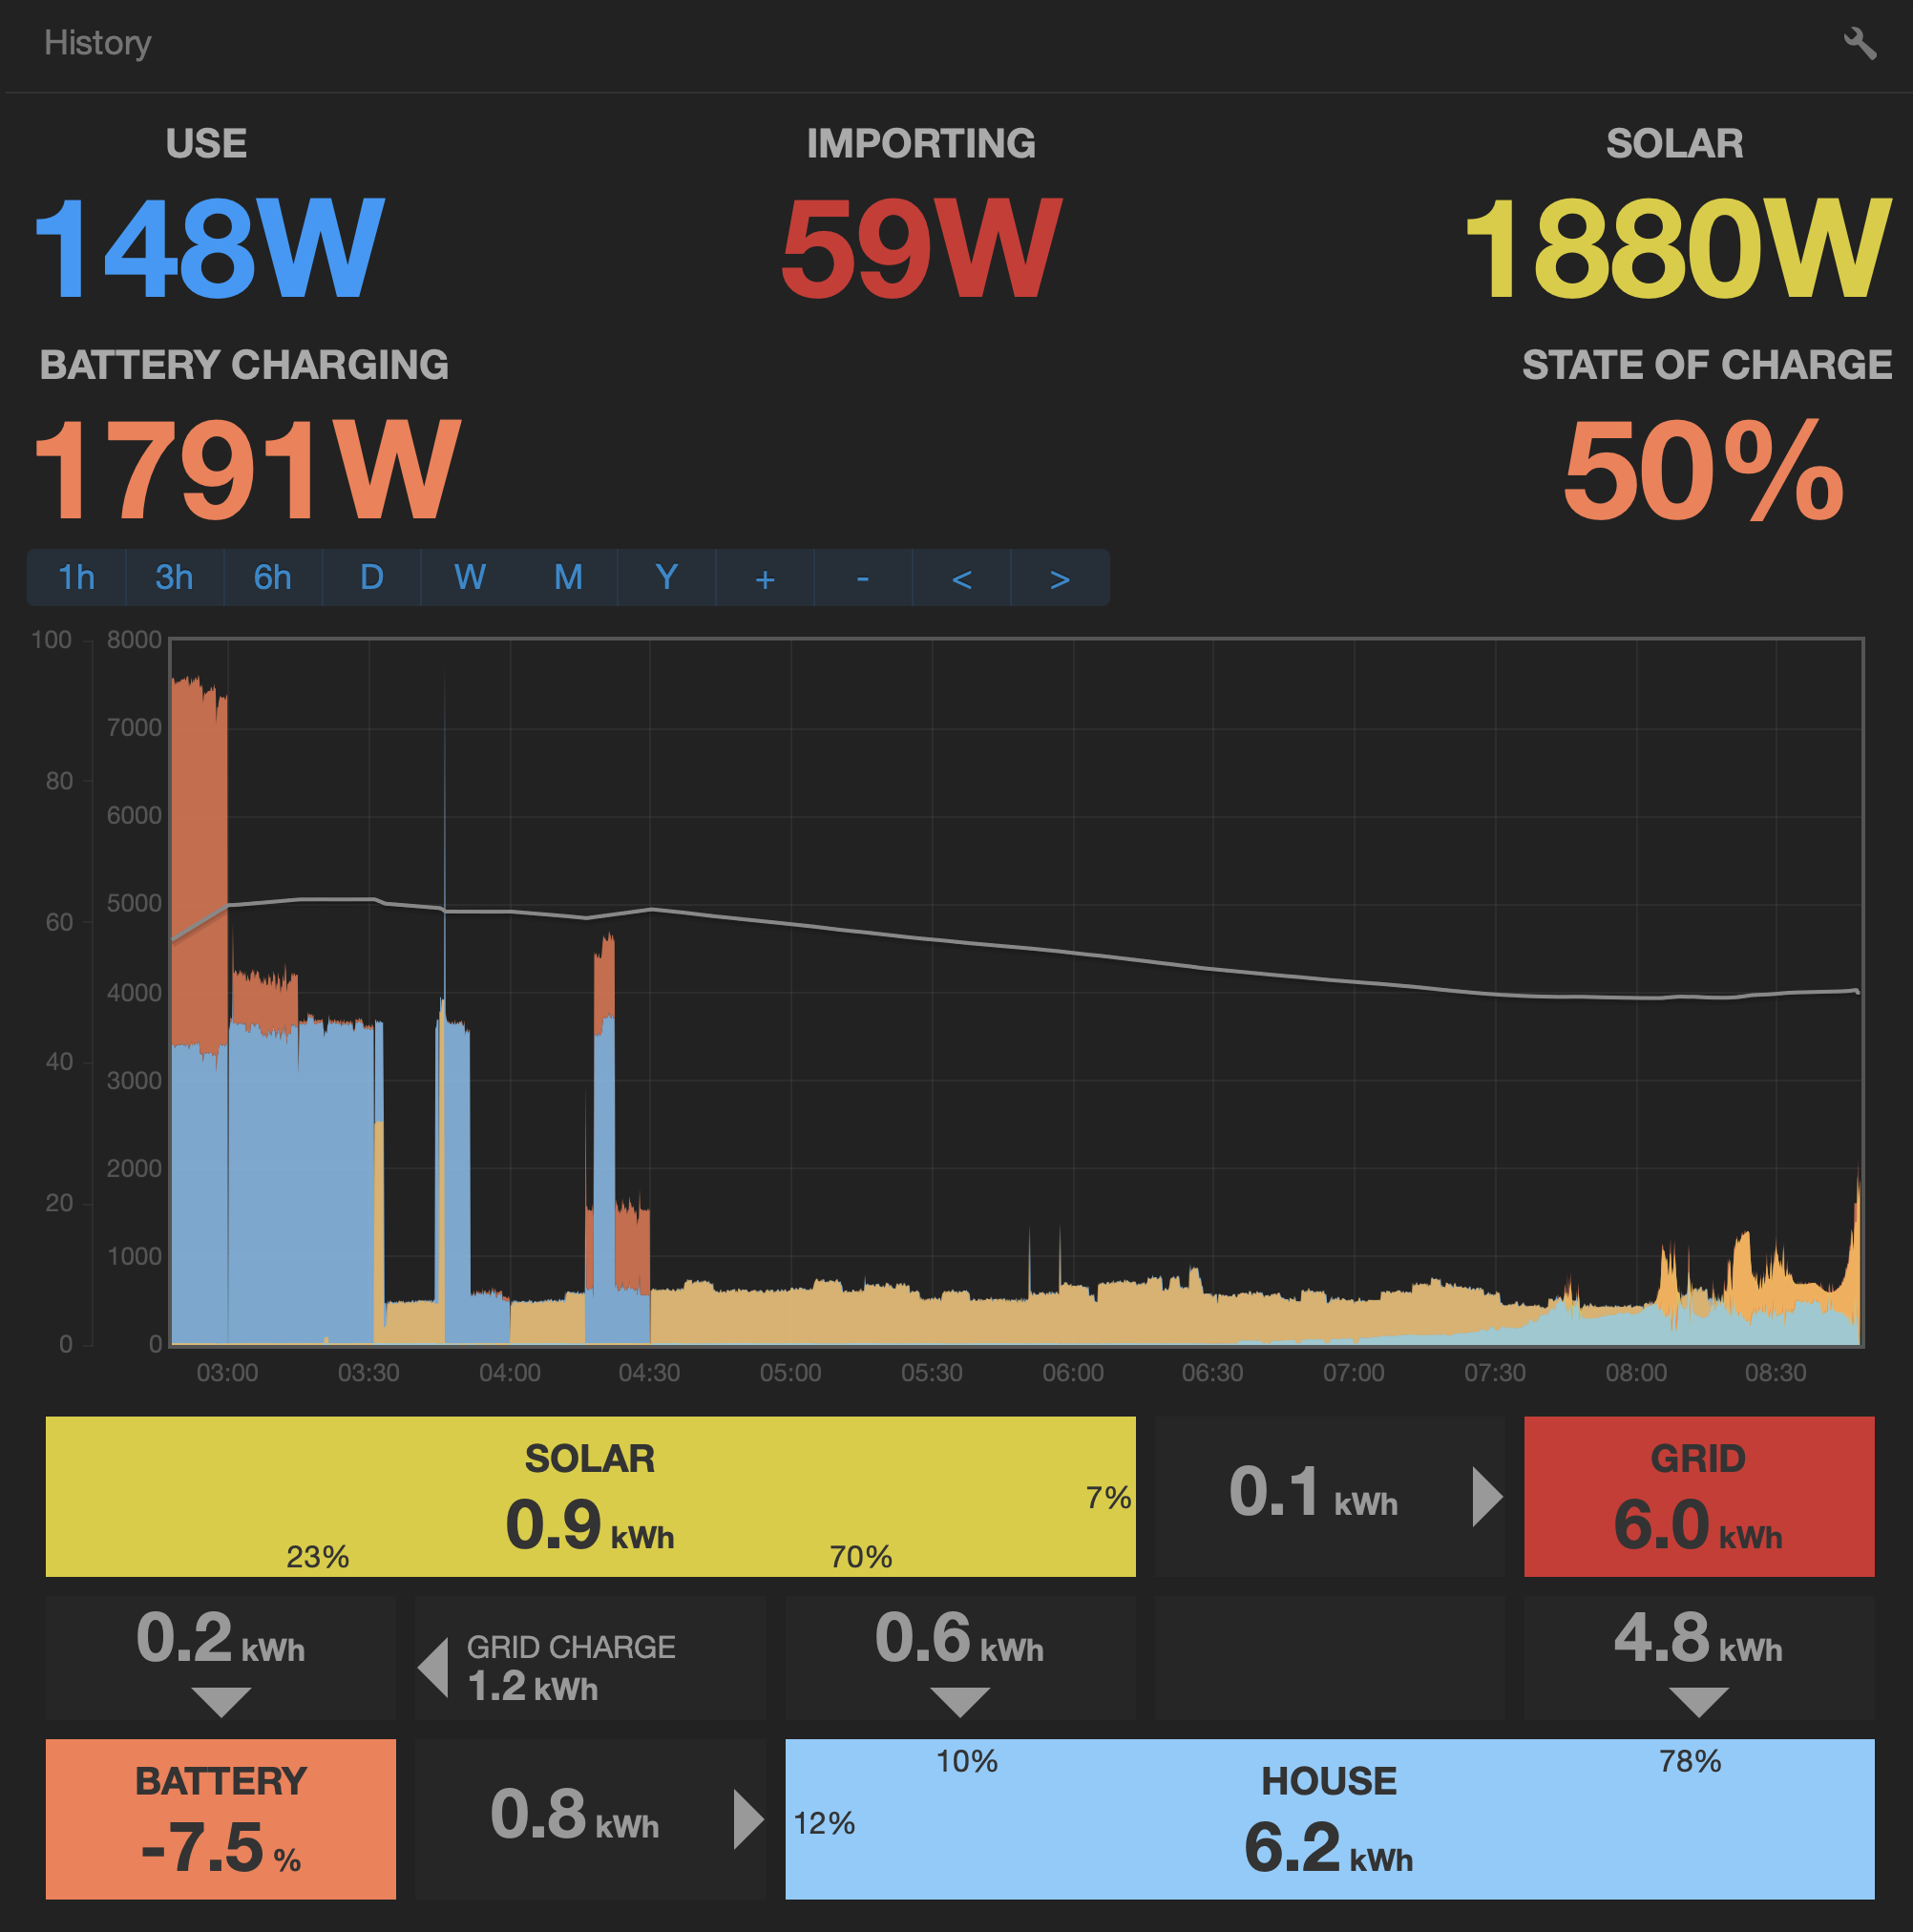
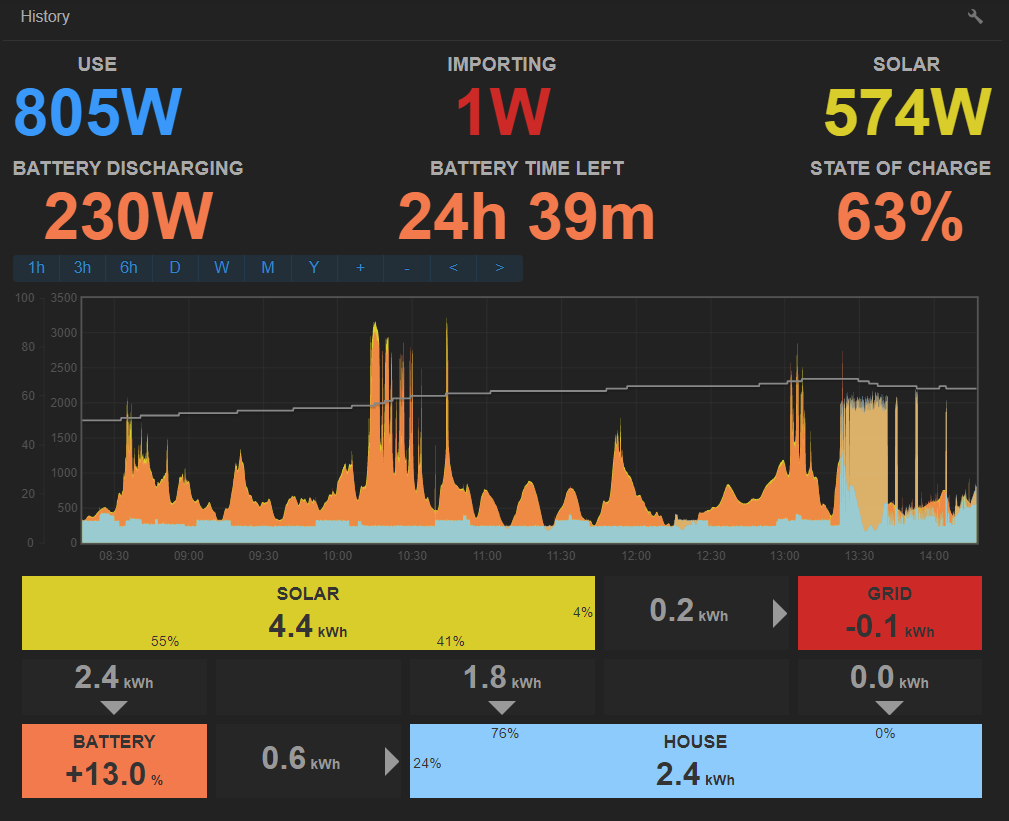
The graph in the above screenshot is nice and clean but it lacks the battery and other information.
My plan is to take the graph from the second screenshot and add it into the original app, along with battery information. Does anyone know if this would be a lot of work?
Sounds like a good challenege @drc, let us know how you get on! I wonder if it would be easier to hide the block below the graph in the battery app instead?
My Solar Battery App is working well, I love it and have become quite obsessed!
Have noticed a small quirk though.
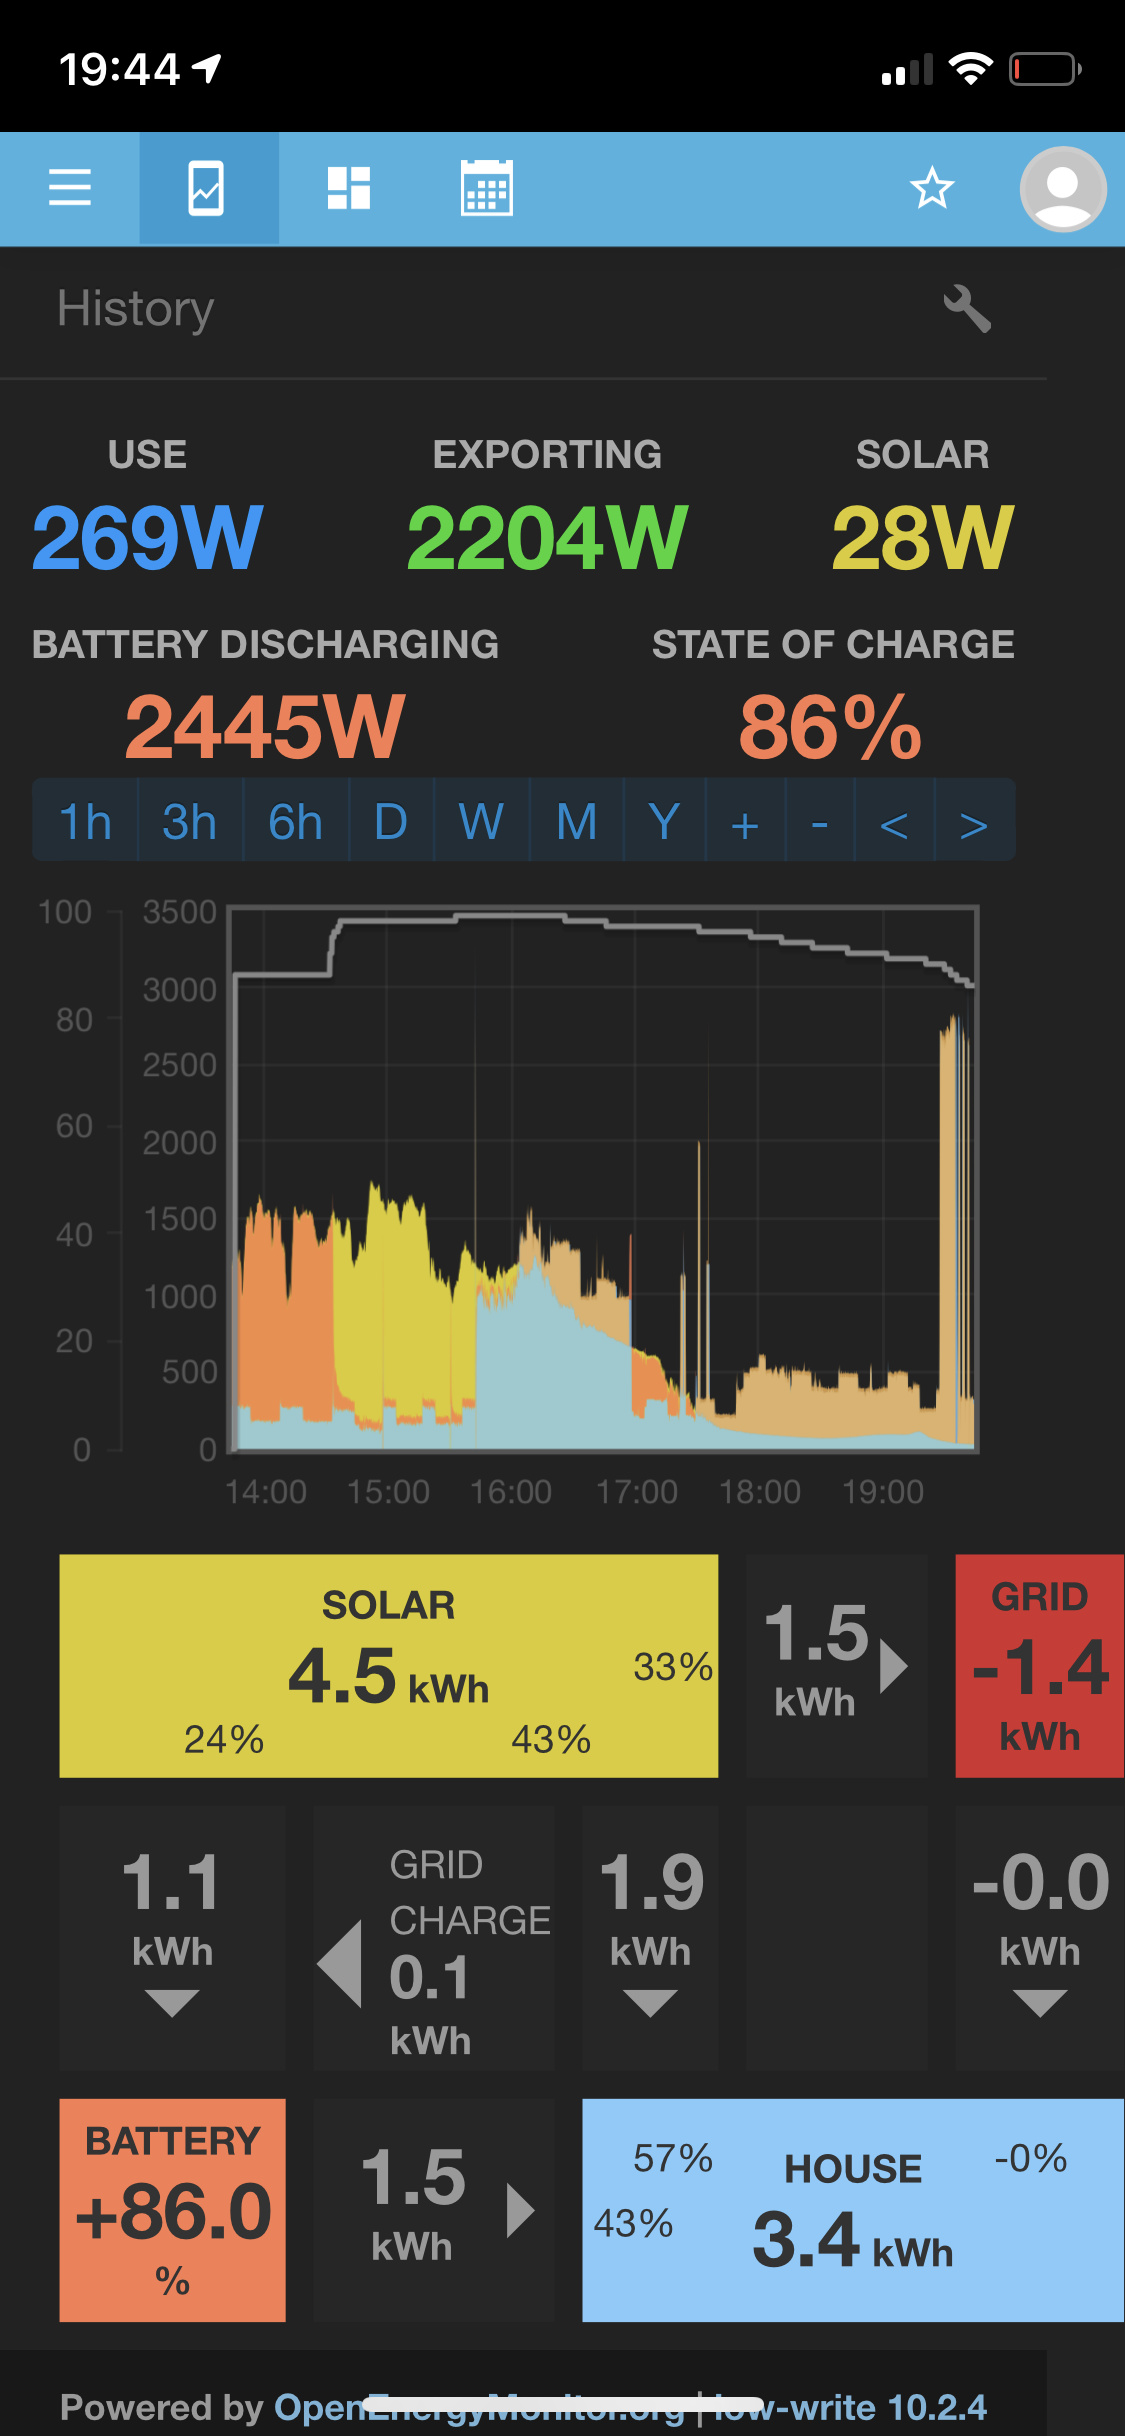
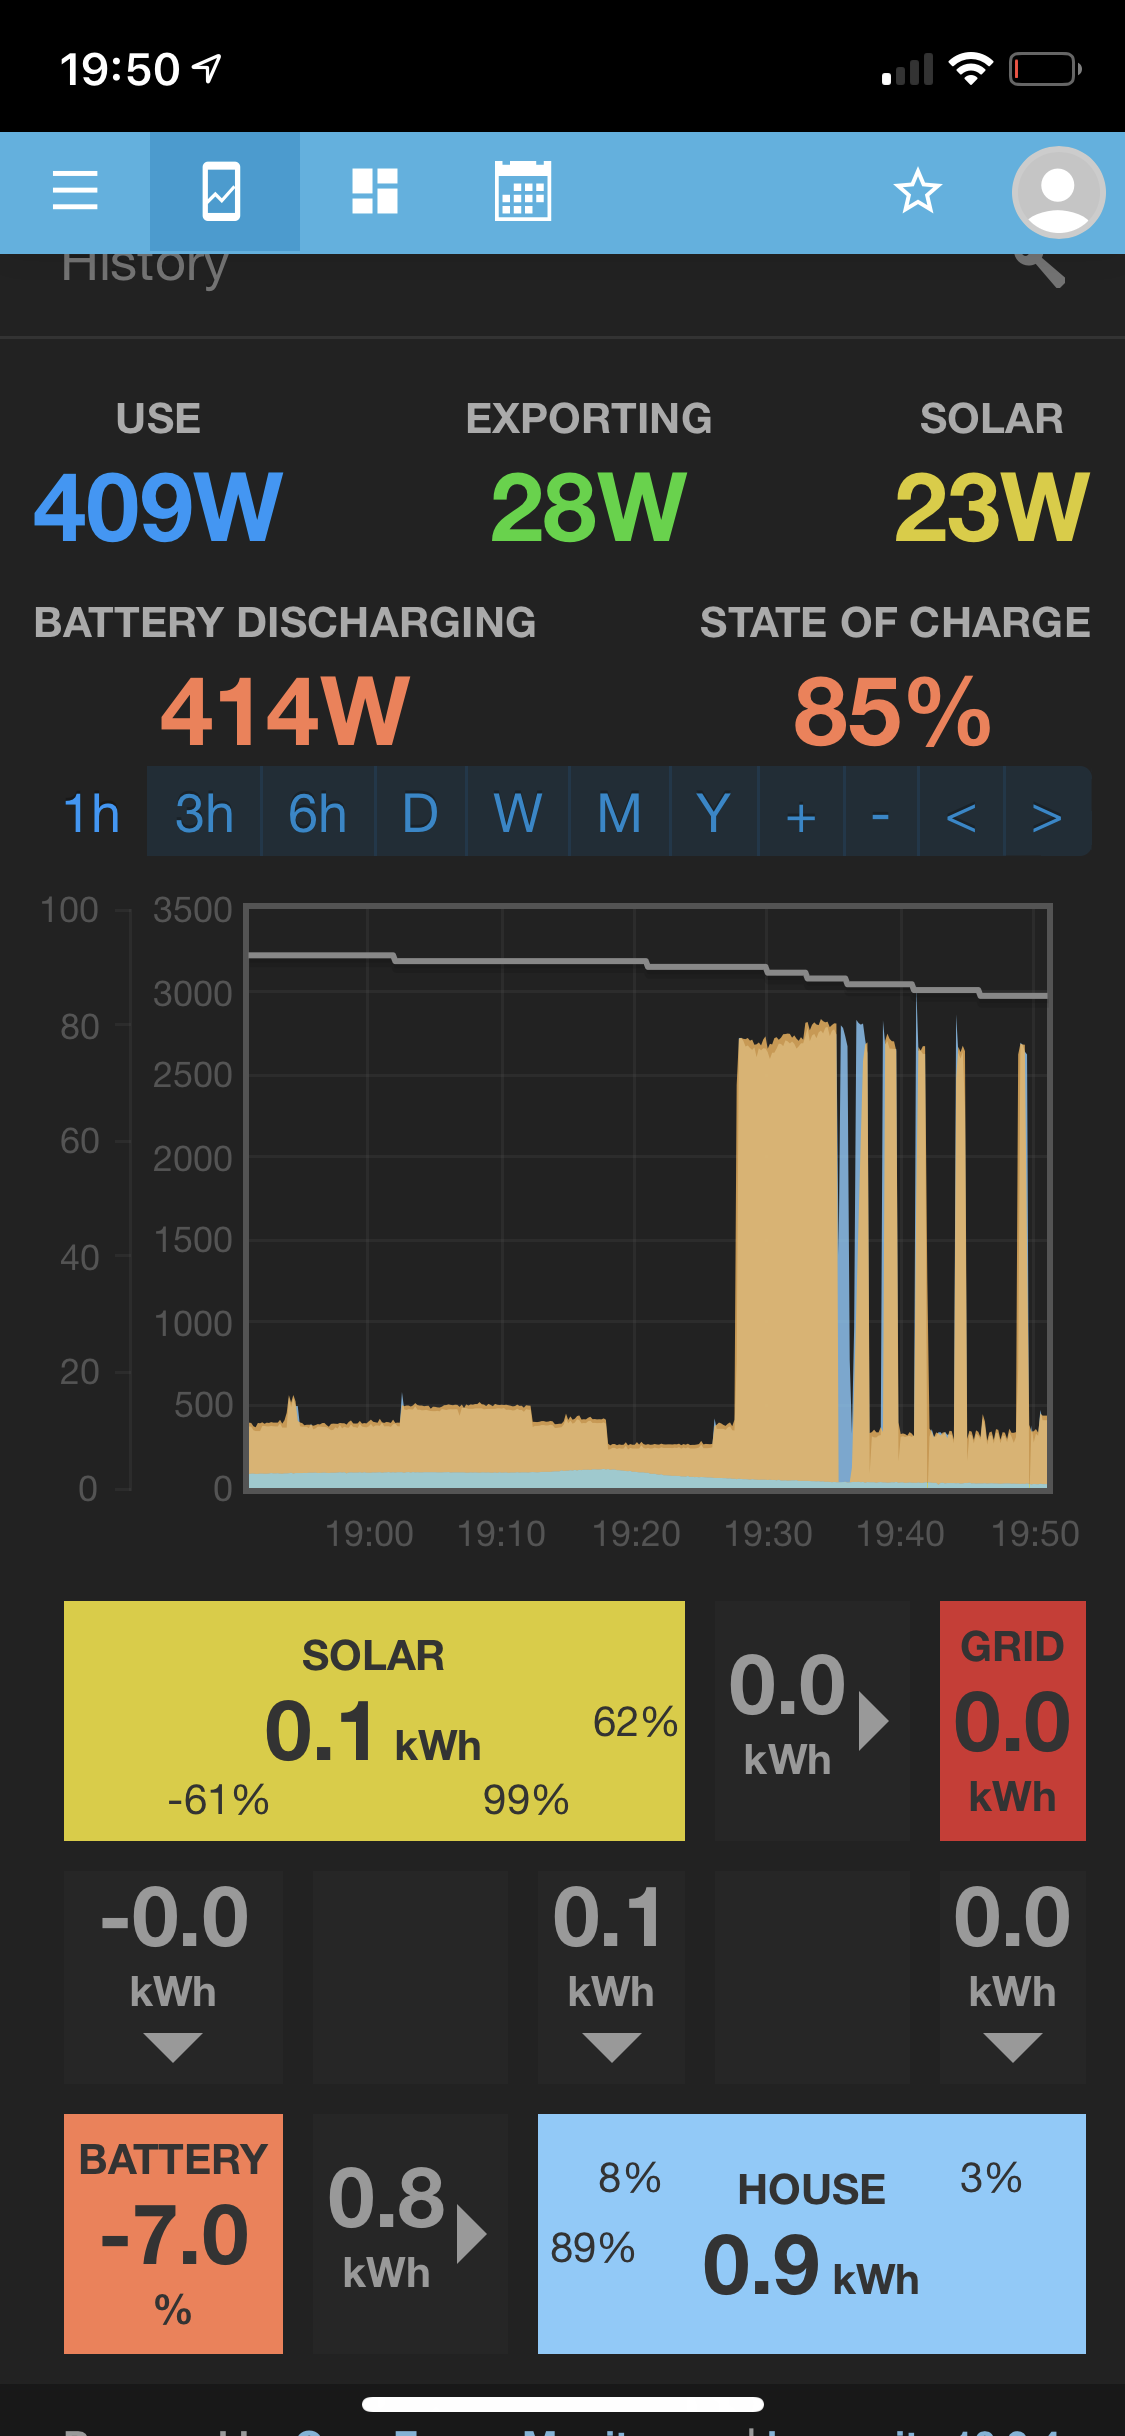
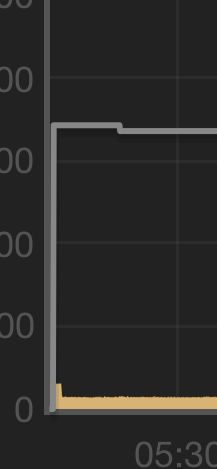
The battery SOC doesn’t display on the graph correctly, it jumps from zero to the current SOC. Also the %SOC used for current graph view isn’t correct.
If I zoom in and out and then change the graph range from 1h, 3h, 1d it sometimes works. I use a pi to poll my inverter every 60sec and publish to EmonCMS via MQTT
Like others here, this app is my goto for monitoring my Tesla PW2 and the house consumption.
We had a blackout on Saturday night and the Tesla kept everything going as expected. While comparing the Tesla app on my phone to My Solar PV Battery app I noticed that the calculated Importing/Exporting figure bounced around at a relatively low value, both exporting and importing.
Could My Solar PV Battery App get the grid flow from the Tesla API in a similar way it gets the SOC ?
Also, and this is a bit pedantic, but could the Battery Discharging be shown in the same colour as it is shown on the graph ?
Hi Tristan
Thank-you for posting this setup for the battery CT - logical enough once you see it, but a head scratcher till then. I had no idea how to deal with the positive and negative in a single CT.
What you need is an FAQ for some of these REALLY USEFUL bits of ‘programming’ (well, for us beginners, anyway!)
Damien
I’ve been using the Solar Battery App for a few months now since setting up my DIY Powerwall and it is a really great bit of software.
I did spot that when charging and discharging at the same time only the charge rate would appear, which could be confusing, especially if charging at 44w whilst discharging at 600.
This was an easier fix for me and my son than expected, so much so we added a feature I’d been keen on. Showing how long the battery would last based on the current rate of discharge.
A new parameter “Battery Capacity” has been added to the configuration page to support this. Feel free to enjoy if this is of use to you… a pull request has been submitted.
The code hasn’t been merged by @TrystanLea yet Max. If you don’t want to wait you can apply the changes directly by opening a ssh session onto your EmonPi and applying the updated file.
Thank you for the amazing work that you’ve put through! I a am a newbie here and impressed by your contributions. You’ve discussed about the software but what about the hardware?
If I understood things, a simple EmonPi with 3 CT would do (PV production, Battery charge, grid feed)? What about the state of charge?
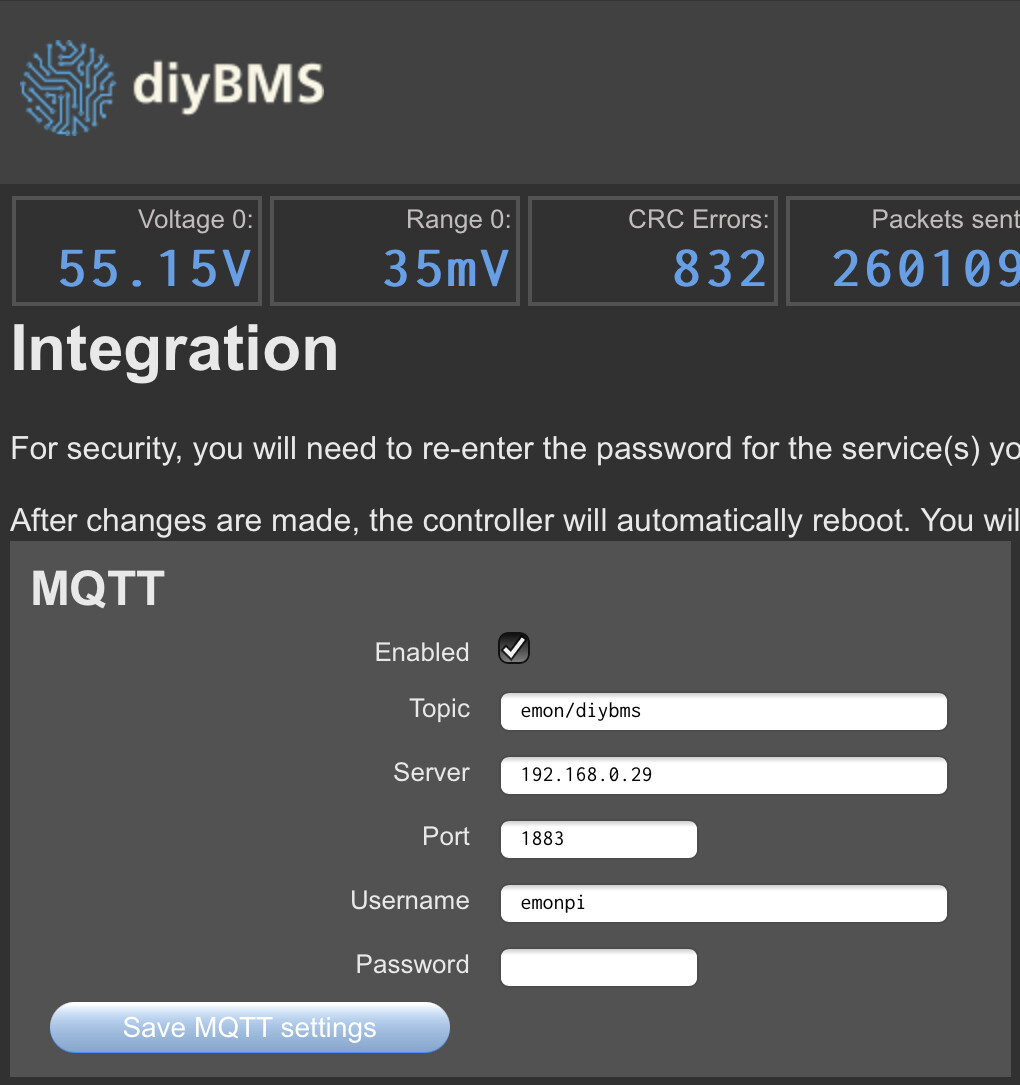
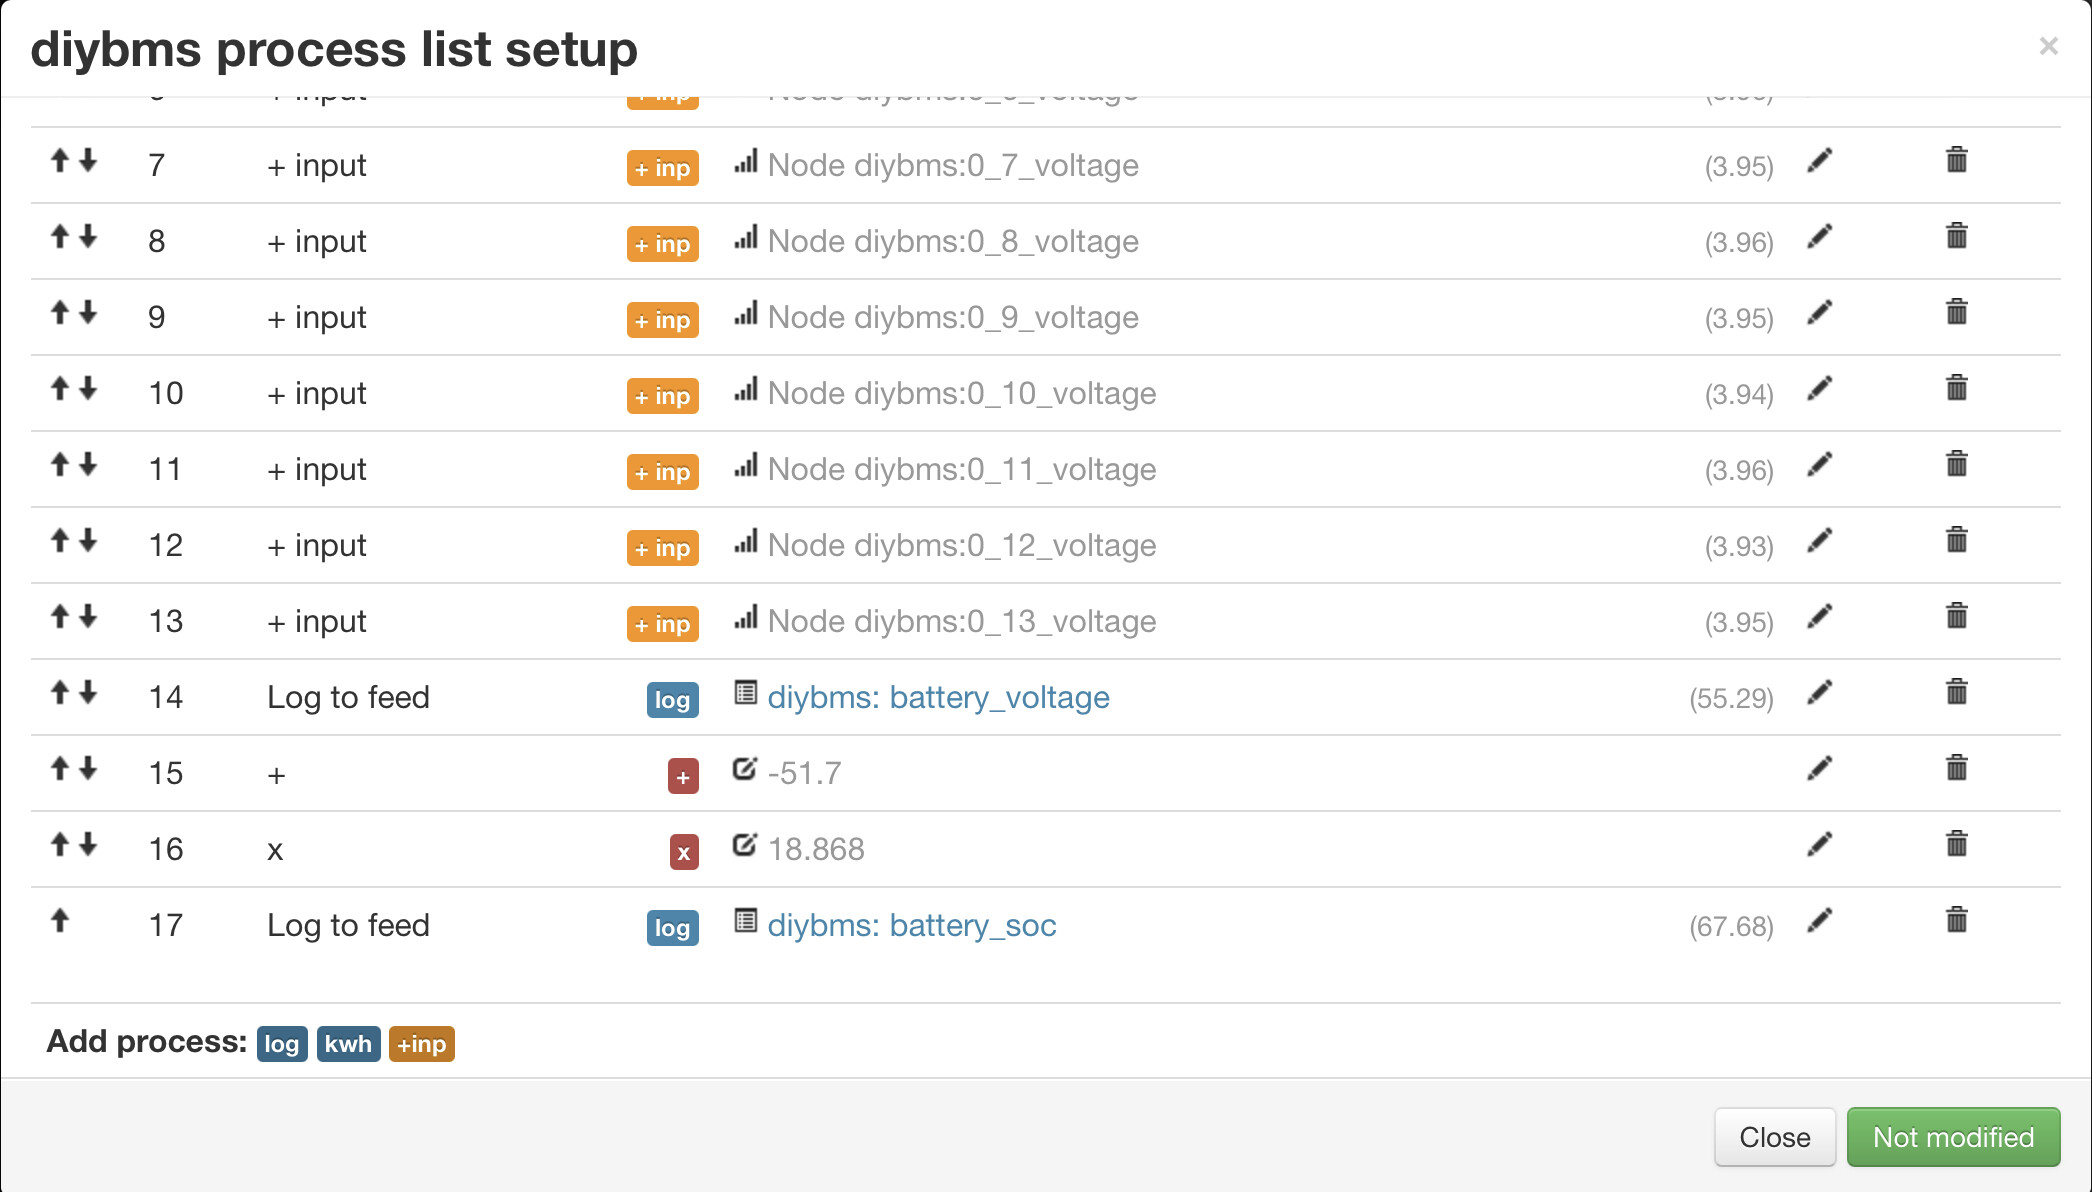
Welcome to the community. Personally I use the DIYBMS, so derive the state of charge from the sum of the cell voltages supplied via the MQTT feed. Ideally using a shunt based solution would be better, but this more than meets my needs.
I then process the voltage inputs and create the total voltage and state of charge feeds below. Note I have a battery pack slightly over 10kWh and cycle it between 30-80% SOC, so my displayed 0-100% is within this range hence the -51.7 x18.868 at the end.
Is that working properly? If i disable the feed for SOC when setting up the app, I get the following error:
EmonCMS Error
Message: TypeError: undefined is not an object (evaluating ‘feeds[config.app.battery_soc.value].value’)
Route: app/view?name=My+Solar+Battery2
Line: 722
Column: 71