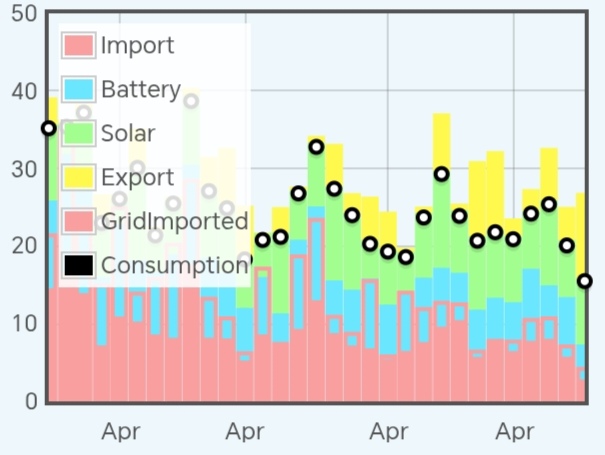
Total load on that 2nd day is 30 kWh, yet the bar reaches nearly 40!
The energy that attributed to charging (9.4 kWh) and discharging (7.6 kWh) the battery is partially counted twice (and some is lost). I think it’s impossible to properly show energy flow between 3 sources on a chart that only has 2 directions (positive and negative).
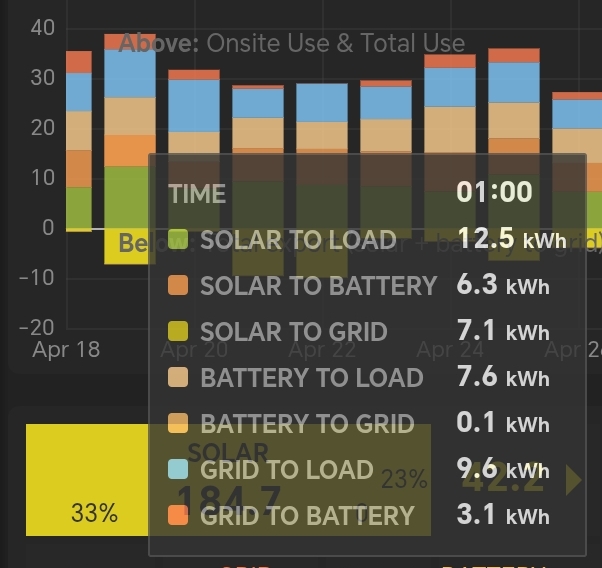
I have one possible alternative visualization, where only the 3 ‘to load’ energies gets stacked, with a black point for total consumption. Grid to battery shown as a red outline, solar to battery is the blue bit without outline and solar to grid (yellow) sits on top.
I agree and have a similar feeling about the power graph. I wonder if we’re trying to present too much information, simply because we have it to hand. For example in the power graph (a) it’s a bit of a struggle to work out what is stacked and what is overlaid, and (b) the peak value measured off against the y-axis (the sum total of the stacked items) sometimes doesn’t seem to reflect anything useful.
@TrystanLea is it straightforward for you to describe the graph plotting and stacking logic with respect to the 7 flows?
It might be better to present less information in each graph, but endeavour to select that combination of elements which present a clear and unambiguous state of affairs. Perhaps more than one ‘view’ (i.e. power and energy graph) is required?
Apologies I am not able to spend very much time on this for the next few weeks and will be working from an iPhone, but will try and do what I can.
The current implementation of the MySolarPVBattery app also supports: Consumption only, Consumption + Battery only. Consumption + Solar only. Would it be better to rename the app: MyHome?
This might be suitable particularly when other loads are added: diverter, EV, heat pump - if this can be made to work sensibly.
If we do rename the app, it could enable a period of time where both the legacy version of the app and the new version are available in parallel. This could provide an extended period of proving out and refining the new implementation.
I think my view is “yes that makes sense” @glyn.hudson is of similar persuasion
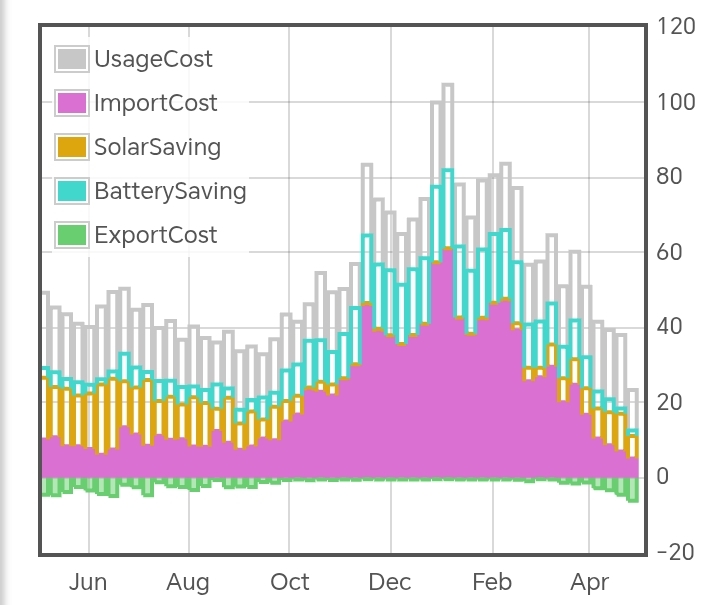
purple is the actual cost, i.e. import × unit rate (+ standing charge)
orange is what it would have cost without solar: consumption × unit rate
blue is what I saved by importing cheap power at night: grid to battery × 90% × difference between night and day prices (assumes battery is discharged in same day)
grey is what it would have cost on the standard tariff: consumption × standard unit rate (+ standing charge)
(When period is greater than 2 months, I like to show weekly instead of daily, then monthly above 1 year)
I would like the app to show me total cost or saving for the 5 series over the period in the graph. Average unit rate too.
Actual cost = £X (x.xxx p/kWh)
Standard cost = £Y (y.yyy p/kWh)
Export revenue = £Z
Solar saving = £A
Battery saving = £B
(Strictly speaking, some of the solar saving is provided by the battery and is difficult to separate. May need to tweak or define these terms better. Will also need localisation of currency symbols.)
If a second tariff is selected, I should be able to see which is cheaper. Maybe the graph only shows two sets of bars in this case.
Tariff 1 = £X (x.xxx p/kWh)
Tariff 2 = £Y (y.yyy p/kWh)
There does need to be a caveat about load shifting (or maybe some magic to automatically shift loads between cheap periods). My house is tuned to run on the Cosy schedule - if I switched to another TOU tariff, I’d need to adjust to a different schedule. A simple tariff comparison would not factor that in, and may provide inaccurate conclusions.
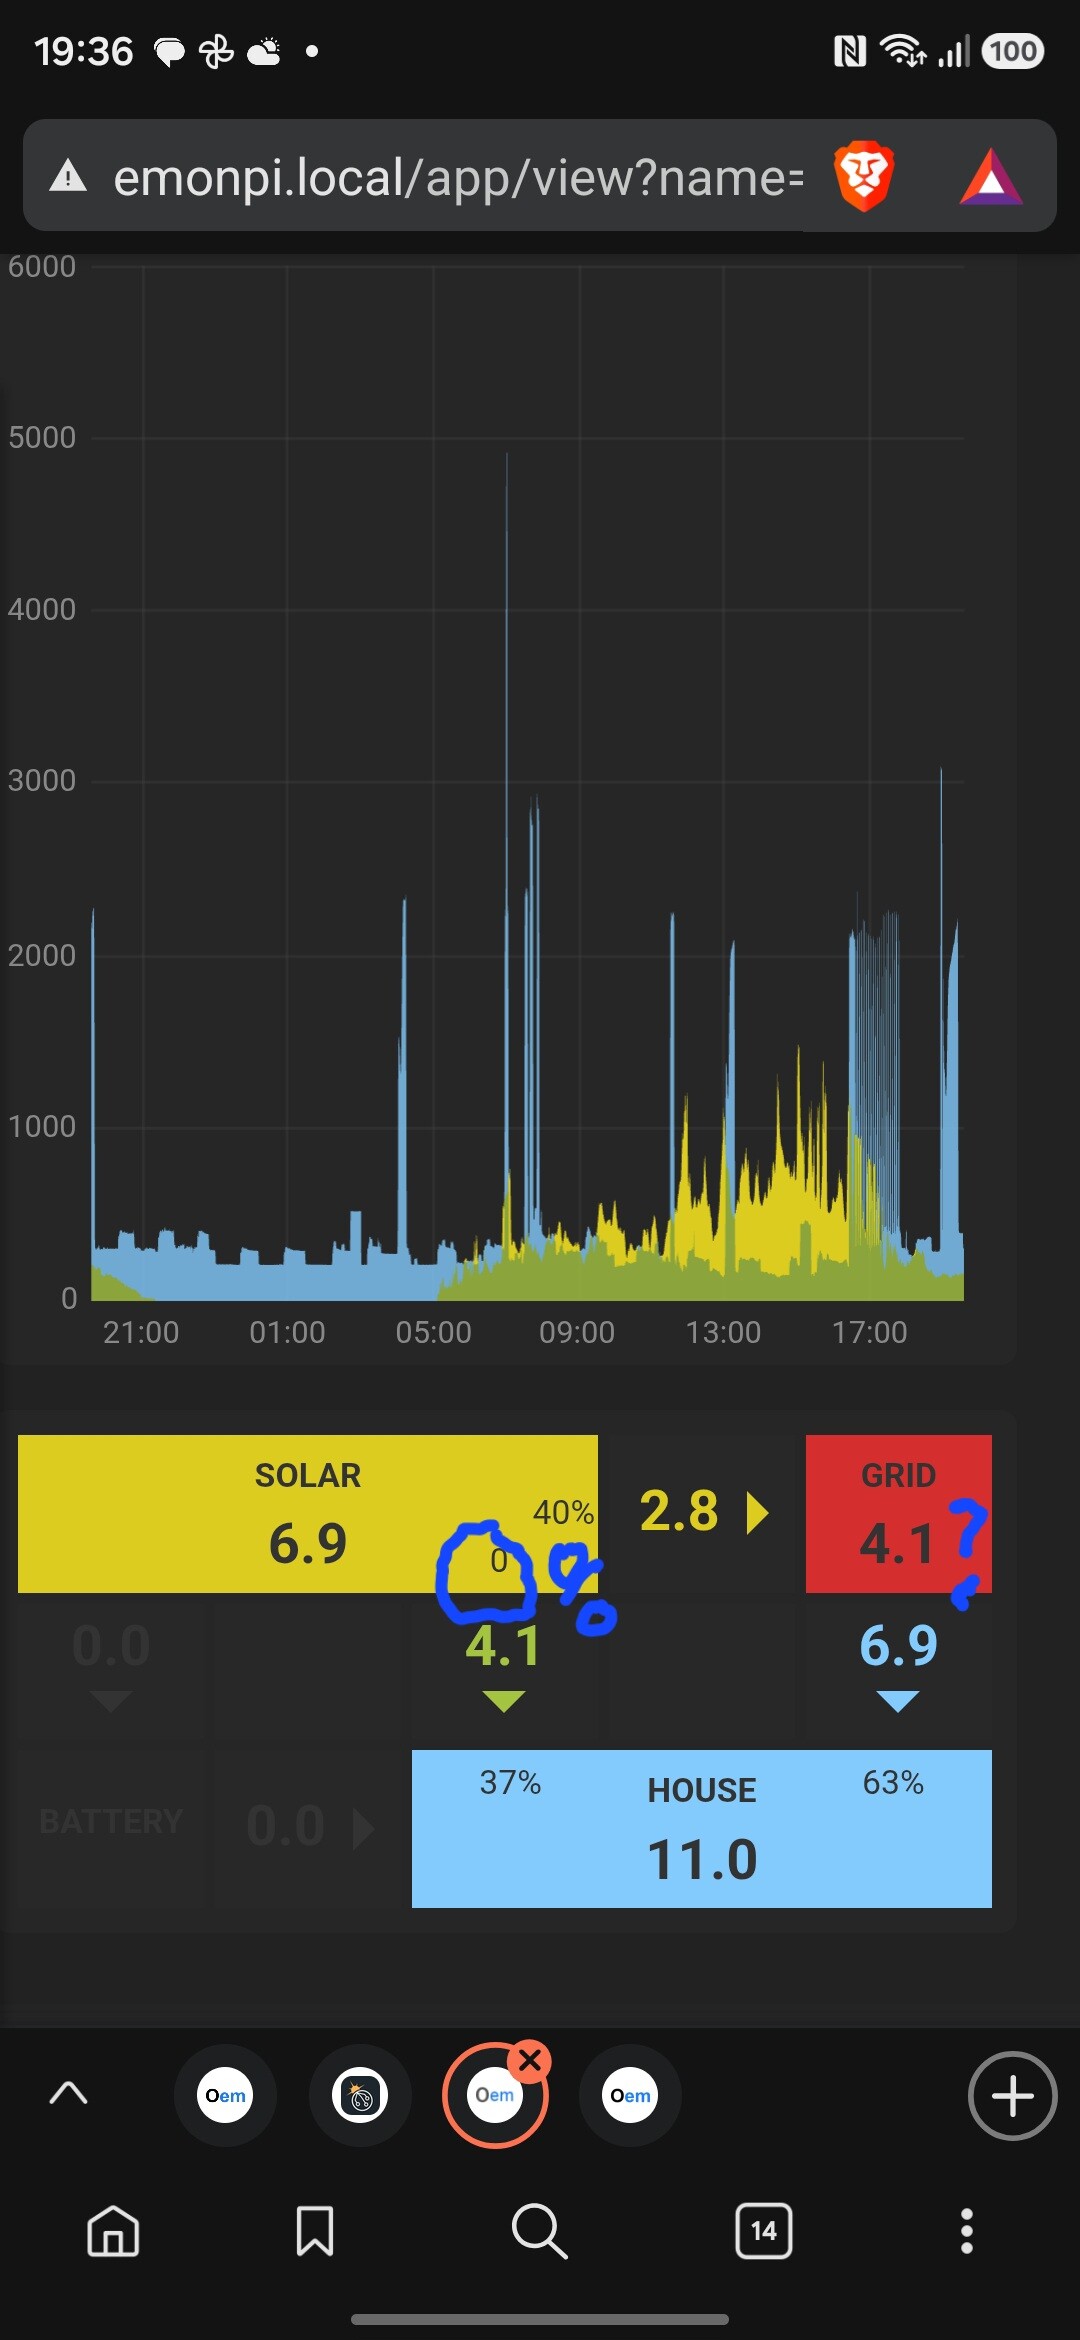
Thanks @TrystanLea. My system has two identical inverters each with its own solar string and DC coupled battery. So, as you say, I sum the data and feed it to emonpi so it sees them as one single unit, but in addition I also send the SOC’s for each battery separately.
The inverters are meant to manage the SOC’s themselves to maintain the same levels. So if, for example, one string gets shadowed, the other will compensate by sending some power over AC to boost the level. But as you can see form my graph, I doesn’t do a perfect job, so I like to keep an eye on it.
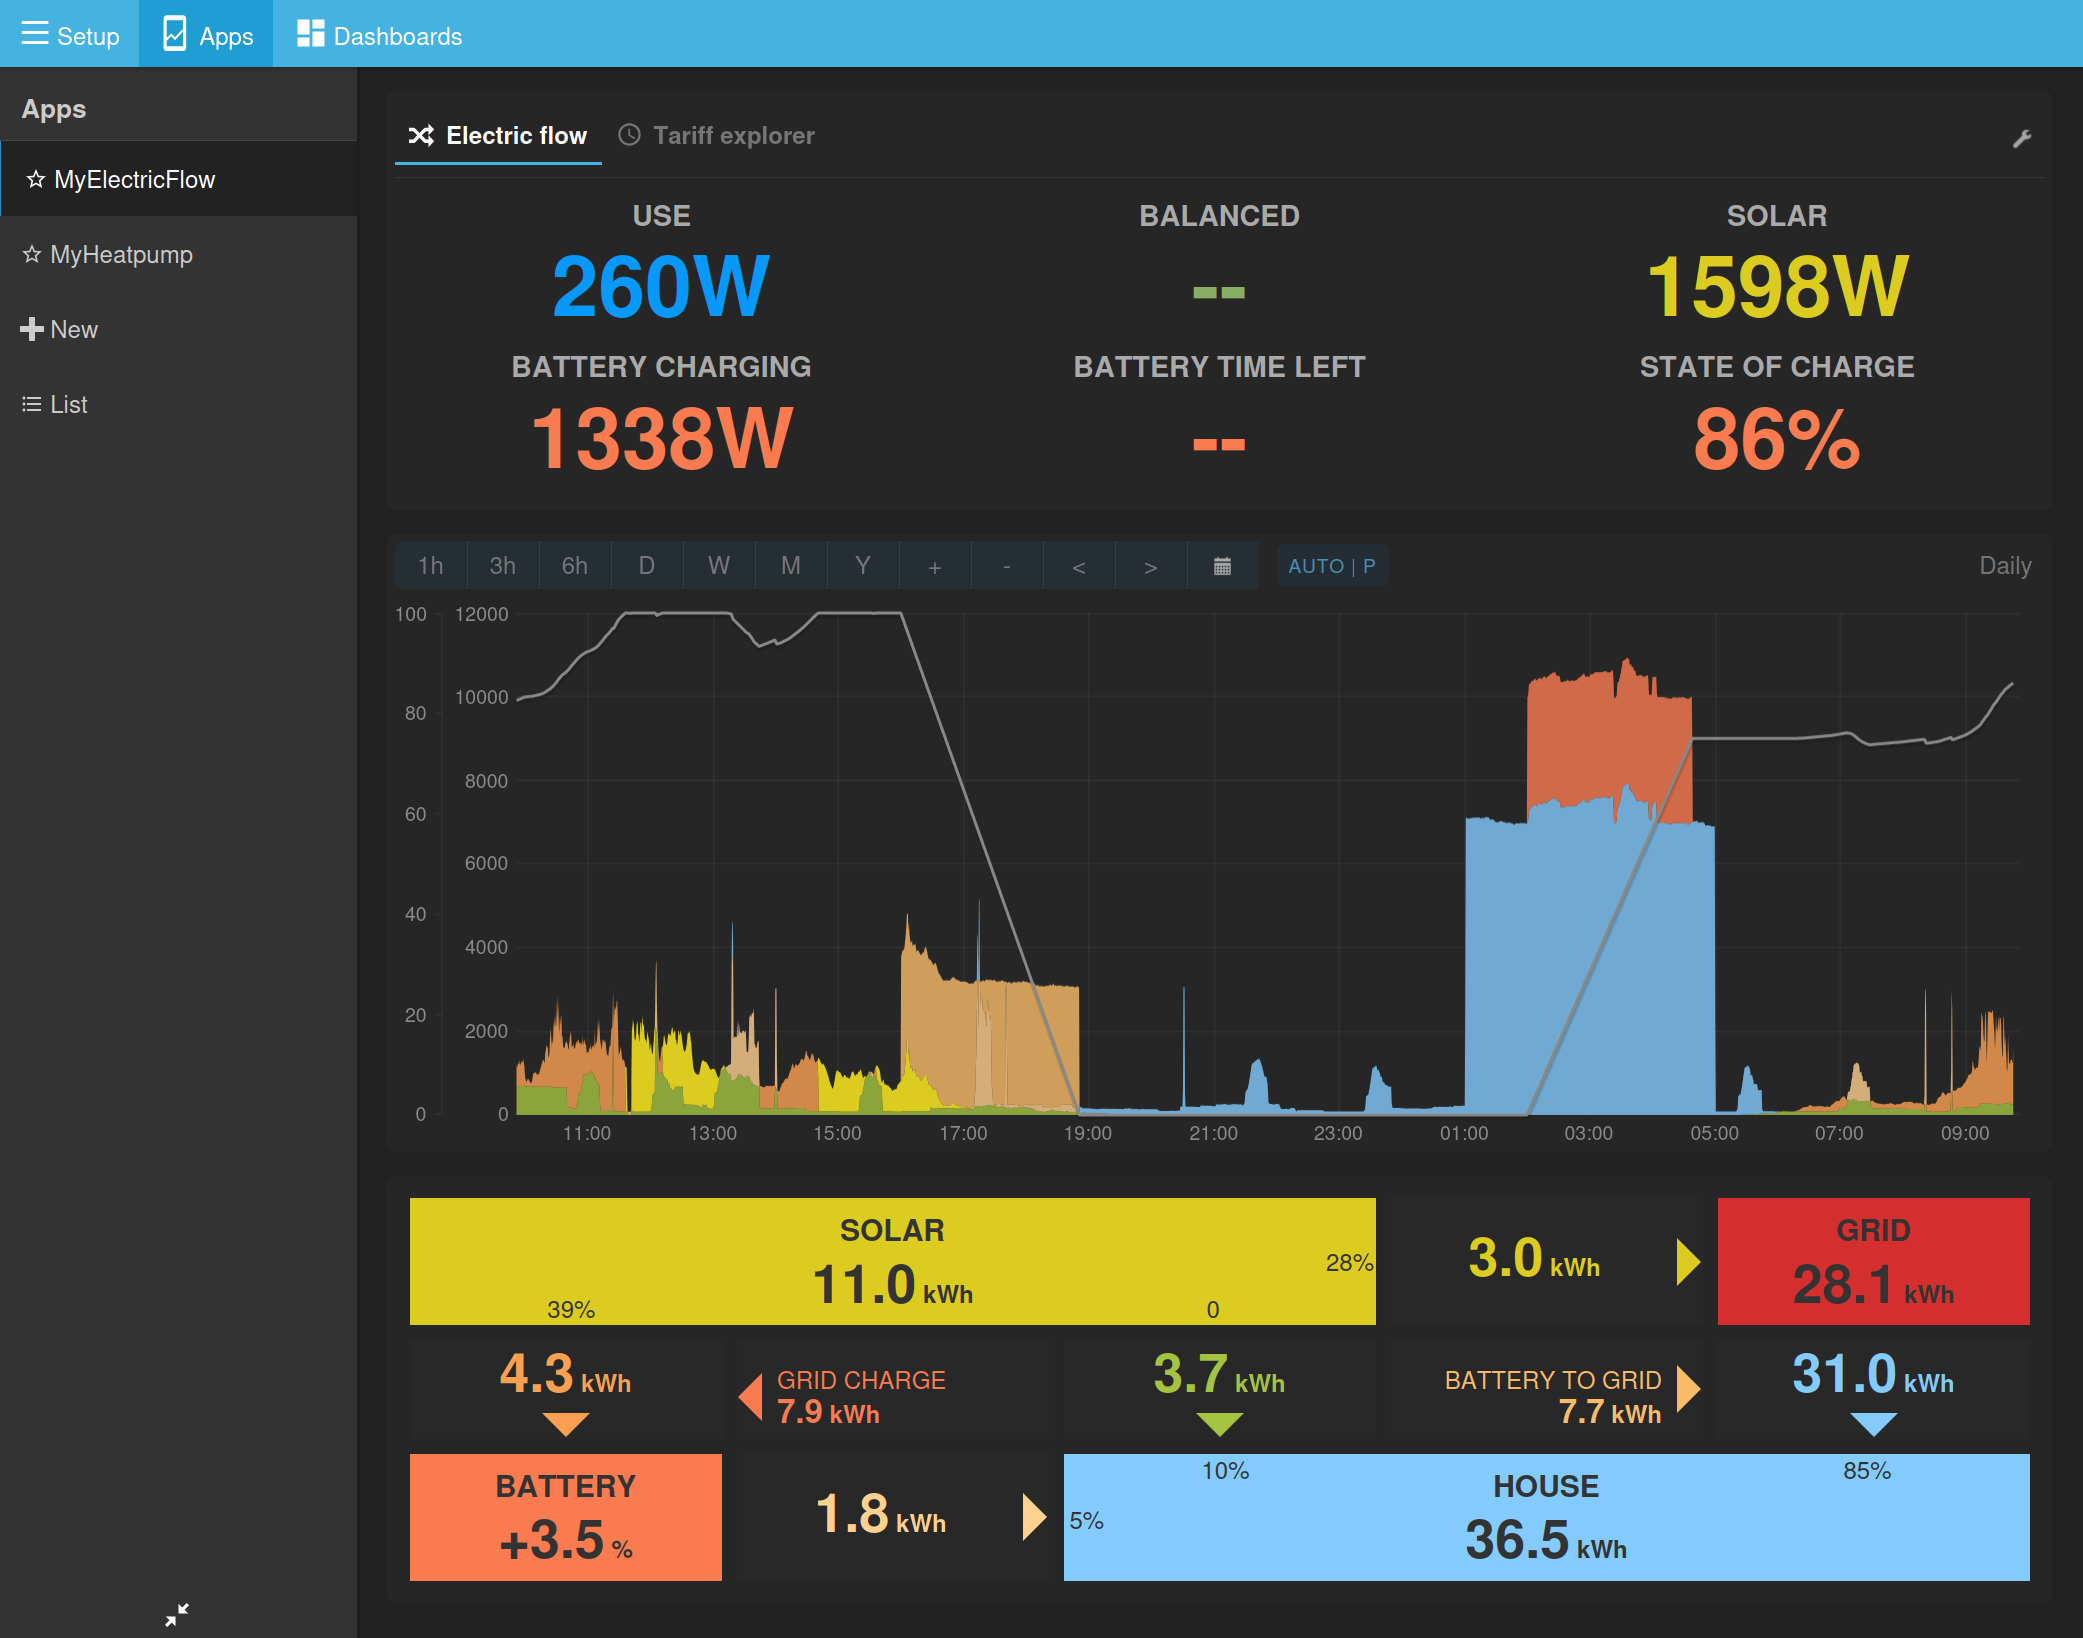
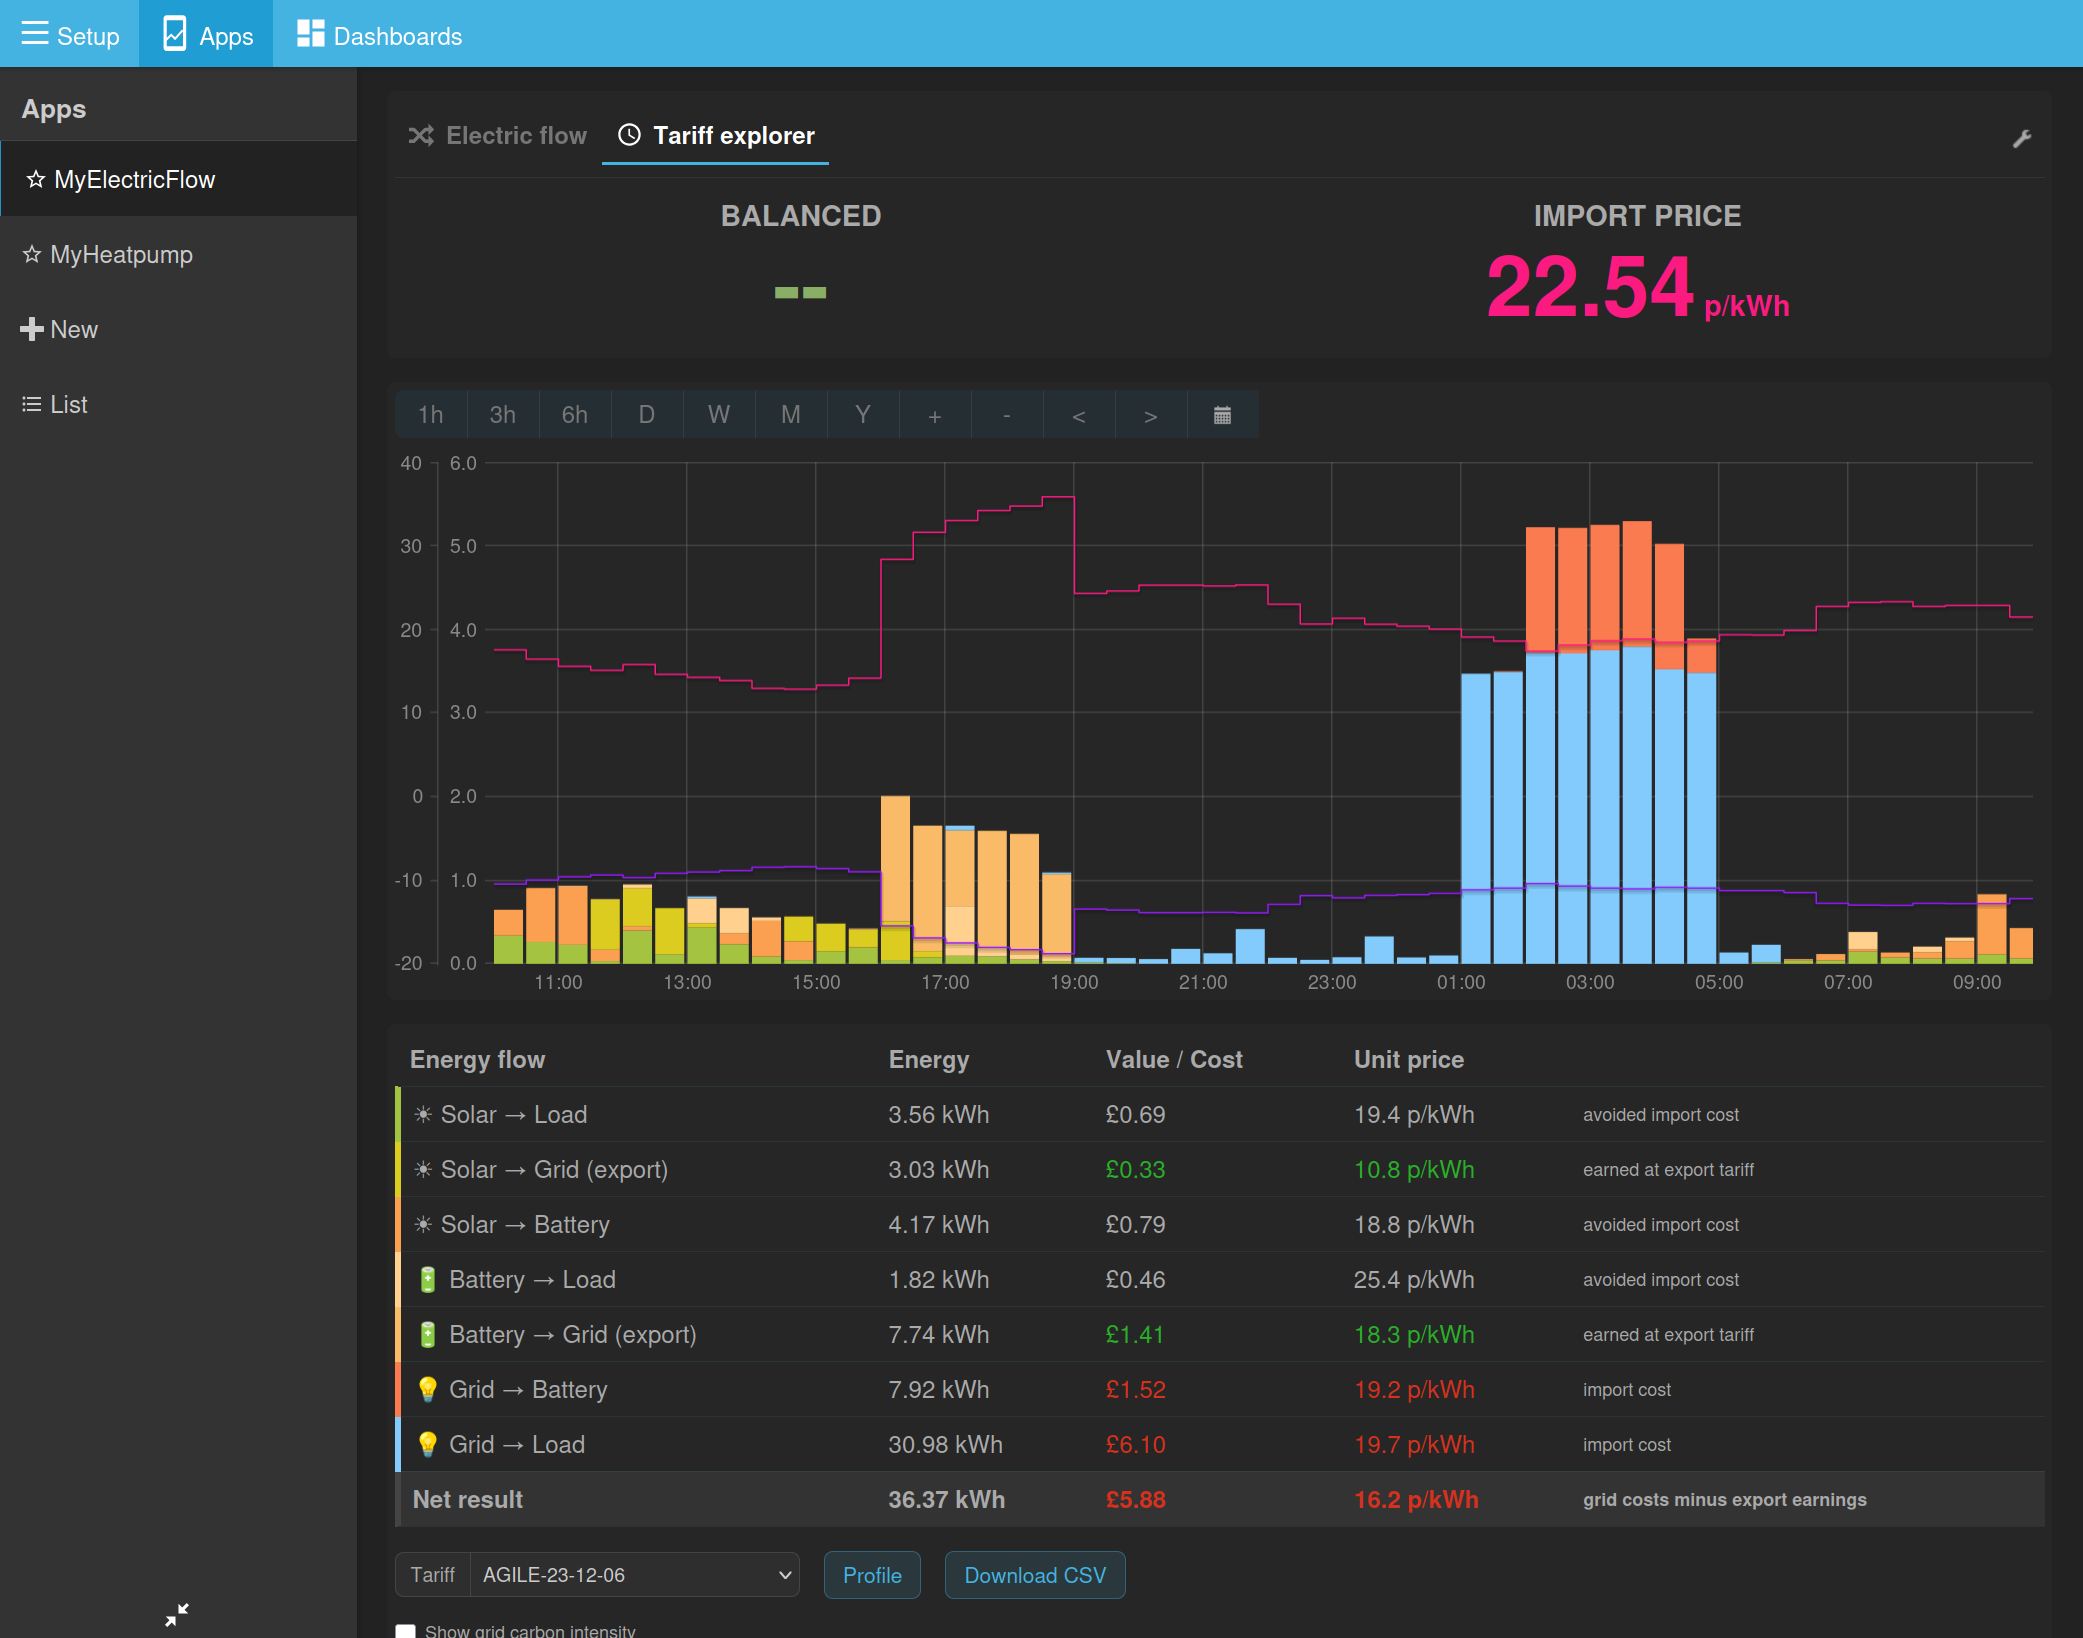
and it now integrated the tariff explorer in the same app - so as to reuse the same feed configuration and provide easy switching between energy and cost views for the same time window.
The original mysolarpvbattery app and octopus/tariff explorer are still available for backwards compatibility in the short term.
Next steps
Add option to select different export tariffs.
Add a custom tariff schedule builder to enable creation simple time of use tariffs.
Place the older apps in an app archive section, e.g when you go to add a new app, it doesn’t show the older apps by default but provides an option to expand to show the older archived apps if useful for comparison/testing in the short term.
Update Solar PV documentation to use the new MyElectricFlow app.
Update Emoncms.org to use this and the latest changes to Emoncms core as well.
I will then come back to the more fundamental questions of how best to present the data that your exploring above @Timbones and further developments such as multiple SOC lines and other load types. Cheers all!
@glyn.hudson has also just completed his epic new Solar PV installation: 38 x 515W Eurener panels = 19.6kWp (9.3kWp East / 10.3kWp West), 10kW Fox hybrid inverter and existing 9.5kWh AC coupled GivEnergy battery
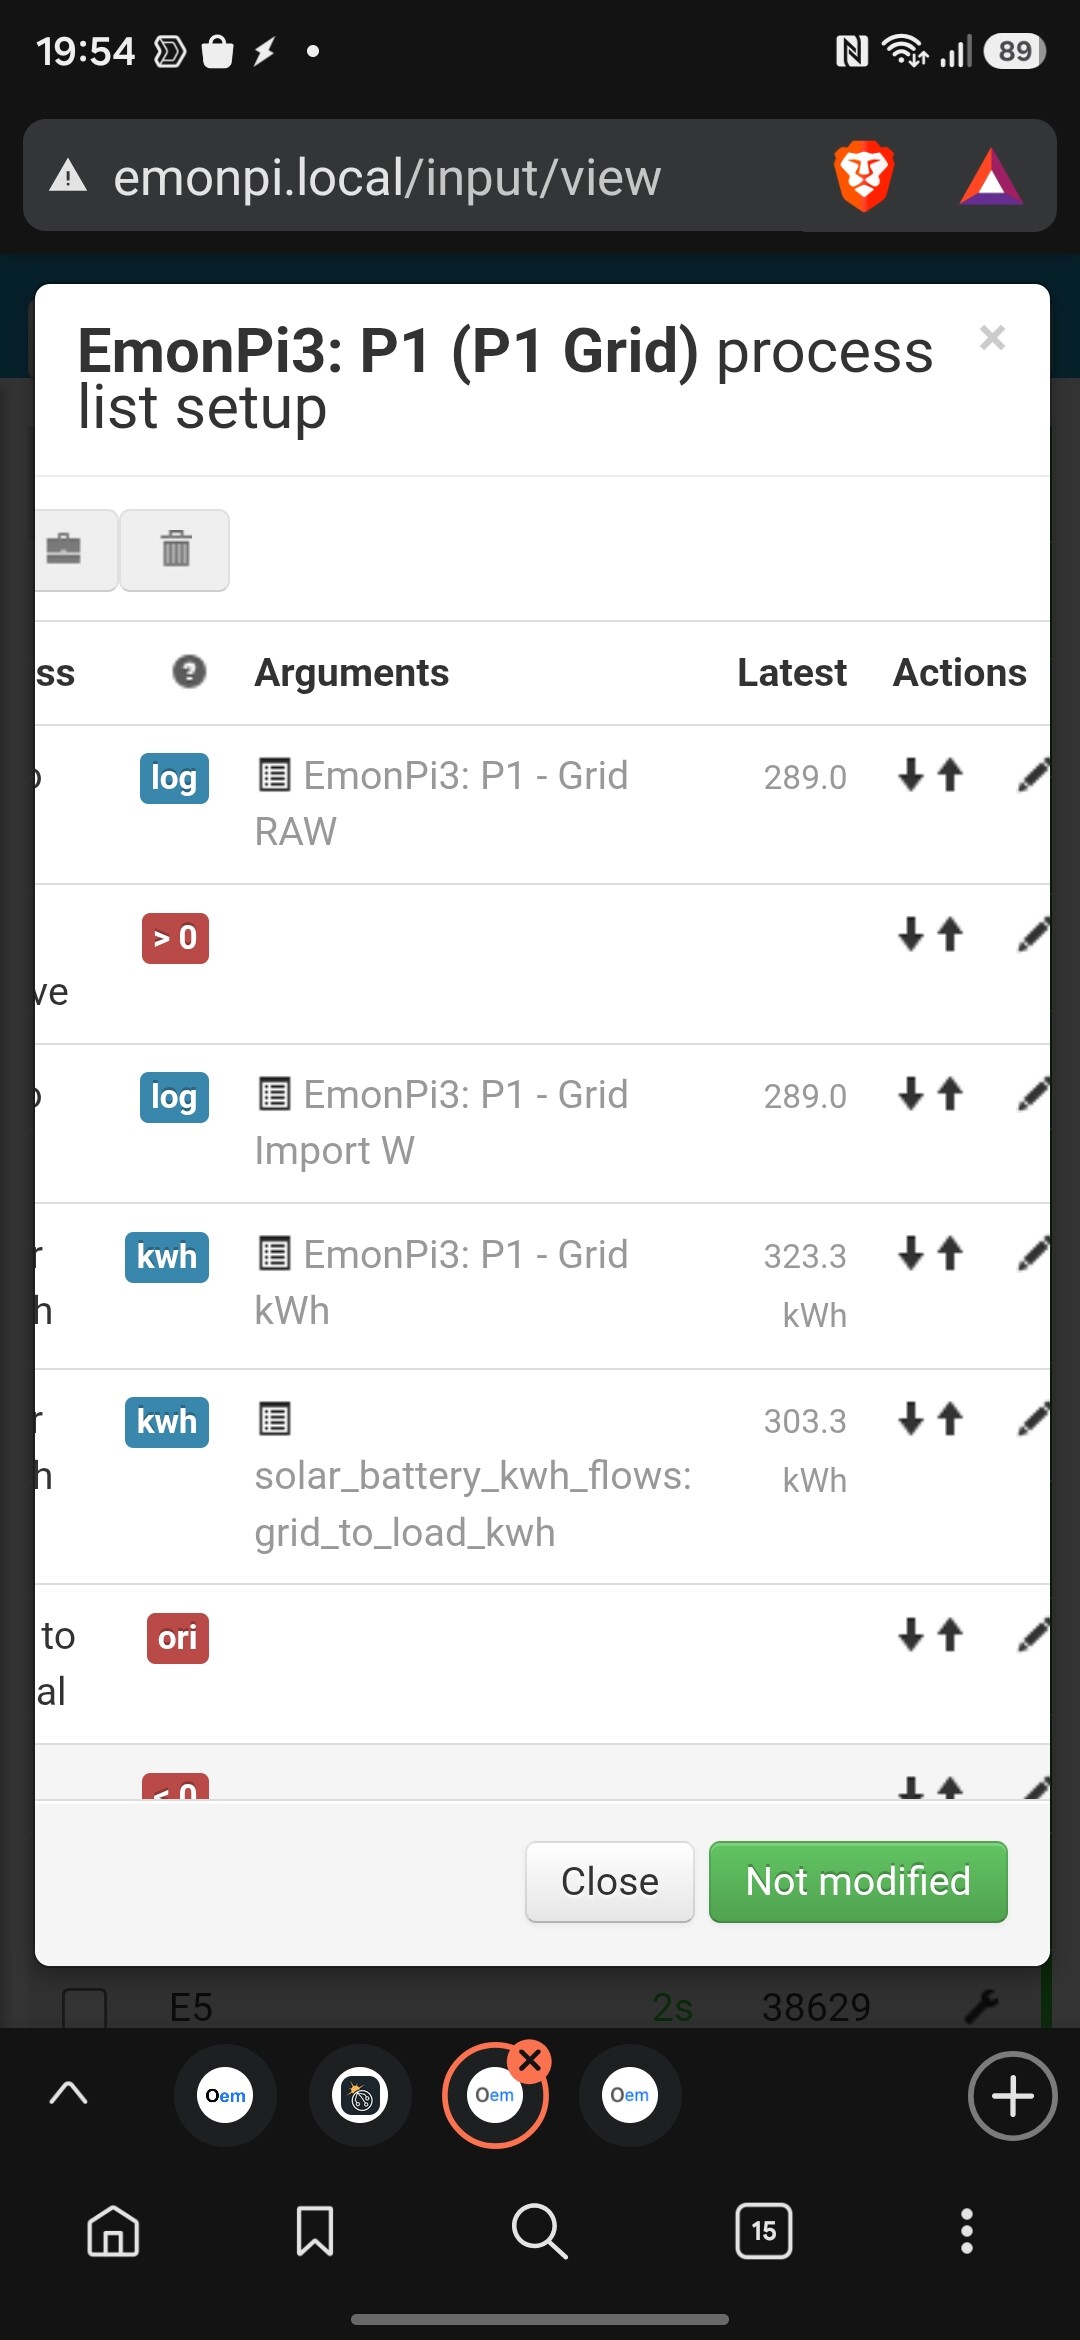
the solar battery kwh flows shouldn’t feature in your input processing, those feeds are written to via the myelectricflow app post processors..
I would remove the input processes for those and then rebuild the kwh flow feeds via the MyElectricFlow app config. Then use the chart to compare both over the same time basis..