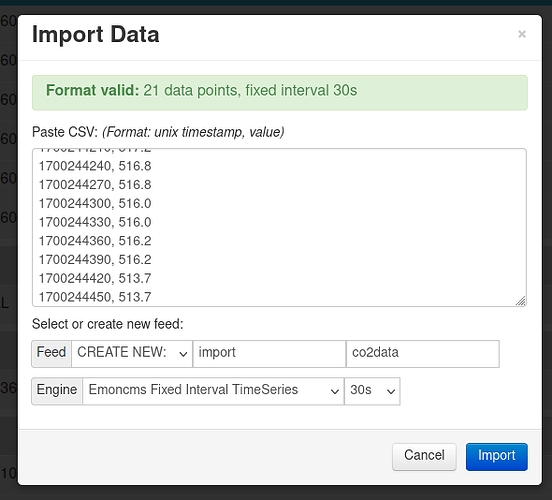
What would be the best way to get my legacy CO2 data in there? I can get it out of Influxdb in any shape I need but am just wondering how to best get around 2 years of data in there.
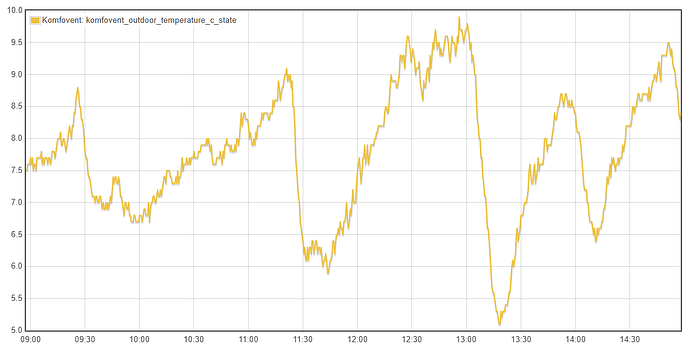
Weather comp needs a smoothing setting IMO ![]() E.g adjust based on average outside temp over 12, 24, 36, 48 hours perhaps?
E.g adjust based on average outside temp over 12, 24, 36, 48 hours perhaps?
Can you get that data in CSV form? If you can arrange in timestamp, value csv format e.g you could use the import tool on the feeds page:
Otherwise it’s more of a scripting task to fetch data from your current database and forward to the api…
I sure can get it in csv format but in the past I’ve had some trouble with feeding in larger amounts of data like that (with a certain number of data points it just locked up). But I’ll try again.
Definitely needed. It makes no sense to adjust flow temperature for the 2 hour super cold portion of the night, especially with heat still stored in the walls. The time constant for smoothing should be related to the intrinsic heat loss rate of the building. I will probably implement something like that on my Vaillant unit over ebus next winter since I have all the basics of the heat pump covered now. New project needed…![]()
Yea it is crazy that it’s not standard to do this… I drop my flow temp overnight but see lots of systems increasing flow temps on weather comp…
Daikin has averaging option for the external thermostat, but 0, 12, 24, 48, 72 hours… 6 Hours seems like a more reasonable period but its not an option.
My old school ground source unit has the thermistor in a sealed box not exposed to air. (mechanical damping)
Fridges used to do the same (sensor with a similar temperature response to a vegetable)
Sun and cloud? Or boost events on mvhr?
Typical Scotland - every type of weather on one day. Ventilation rates don’t change that figure much and it was constant anyway.
I see!
Quite a few of the big district heating schemes run look-ahead for similar reasons. When a cloud passes by for an hour or two and the entire city district dips by 3C it can cause havoc for the plant operators if all the building substations dutifully call for more heat via weather compensation.
I wonder if there are useful published look-aheads for degree days on a very local basis (look-aheads that include the effect of sun/cloud) that one might use to intervene in the weather comp to avoid units running harder during troughs and easing off during peaks?
Dark Sky used to be good but got killed by Apple:
Homely purports to do this (and more) but there’s nothing published to show how effective or otherwise it is. (most of the quantified benefits are in automatic time-clocking to chase time of use tariffs)
Some thoughts on reheat from setback and elderly pensioner modes:
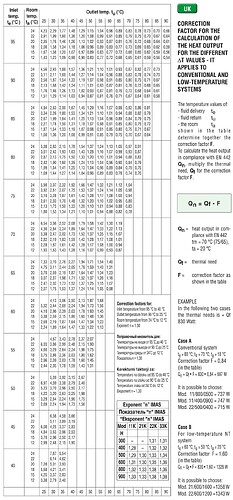
Take the dT50 output. (75/65 at room 20C)
At 55/50 the rads need to be derated 1.8x the size for a rom at 20C
At 45/40 they need to be 2.8x
But at 55/50 the rads only need to be 1.3x if the room is 12C; but 2.1x at 24C
And at 45/40 the rads only need to be 1.9x if the room is 12C; but 3.7x at 24C
Reheat from setback should have the heat pump working very nicely / very hard indeed. Maintaining elderly pensioner 24C setpoints should require materially larger rads.
A very interesting project and discussion thread. I have nothing to contribute on air changes and their implications for ASHP design criteria. I have some data on the effects of wind on energy use for my Vaillant aroTherm Plus 13.2kw unit. The weather data is from my Davis Vantage Pro weather station, electrical energy from the dedicated ASHP electricity meter and CoP via Sontex Superstatic 440 heat meter and emoncms. Daily average data were analysed in Statgraphics v4 statistical programme by multiple regression, mostly the effects of wind speed, air temperature and relative humidity on daily electrical energy use by the ASHP and the CoP.
The story for 01 December 2023 to 24 March 2024, some obvious and some surprising findings (to me):
Air temperature has the largest effect on daily electricity use and CoP.
Wind speed has a surprisingly large effect on electricity use and CoP (independent of air temperature).
Electricity Used per Day = 36.4 + 1.25*(wind speed) - 3.2*(air temperature). This model has an r2 of 90% so nearly all variability in electrical energy used is accounted for.
I imagine the effects of wind speed are on heat loss via the building fabric but the discussion thread also suggests it increases air changes.
As was pointed out in the thread, it is not usual to get high wind speeds at low air temperatures: wind speed and air temperature are also correlated here in the Scottish Highlands. However winds can be strong at around and below 0C so perhaps should not be ignored when thinking about design criteria.
Winter wind speeds here are inversely correlated with humidity. Low wind speeds with high humidity in winter can be linked via low air temperature (<1C) with reduced ASHP performance through increased defrosting, without wind actually causing the increased electricity use.
I wonder if house plants consume enough CO2 to make any difference to the modelling here? I have plants in every room in my house.
I’m interested in an emonTH with a CO2 sensor. This would be a great addition to the kit
That’s a great question I was also wondering about. I was away for the last couple of days and gathered just the right data.
My house is very airtight (<0.1 ACH) due to a vapor barrier. I’m showing datafrom the living room/kitchen with approx. 45 m² area. We have tons of plants in the living room (easily 20 plants; and not only small ones either) so that’s a perfect testbed.
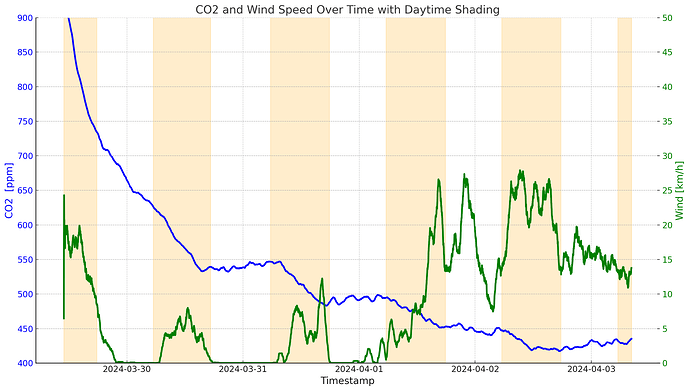
In the plot we can see CO2 level and wind speed, even though wind has only a small effect because of the vapor barrier. Day time as measured by a light sensor is shown as shaded orange background (orange = daytime).
We have two effects affecting CO2 levels: ventilation and CO2 consumption/production of plants during day/nighttime. We can very clearly see that there is a much stronger CO2 reduction during the day when the plants can use photosynthesis and consume CO2. During the nights, CO2 reduction is either going on much slower (first night) or we can even see very small CO2 increases or stagnation (following nights). That’s where CO2 loss through ventilation and CO2 production by plants are approximately balanced. Halfway through the last full day we reach the baseline 420 ppm CO2 value.
From the almost flat CO2 data on the nights of 03/31 and 04/01 we can deduce that on calm nights with little wind, the plants in our living room would produce CO2 at a rate to keep CO2 at around 500-550 ppm. Just the wind on the night of 04/02 was enough to counter that effect.
To answer your question: Yes, plants have an effect but it’s quite small and will only appear in very airtight houses.
In the gas industry we used Helium a lot for leak testing. Two reasons: the small molecule went through leaks more than most process gases and it is very easy to detect at very low levels using a thermal conductivity monitor.
It seems to me that a small amount of helium (balloon gas is a helium air mix and is readily available) introduced in a room and decay monitored would give a much better vent rate measure as it would be independent of any confounding factors like plants and people.
Background rates are very small although higher in granite cities and tors due to alpha particle production…still negligable.
Just a thought…
That might very well work but is a bit overkill in my opinion. The issues I’m seeing:
- The sensor appears much more expensive than CO2 sensors and will serve no purpose after the leakage test in most cases. The CO2 sensors are great for air quality monitoring afterwards
- The helium vent rate might well be larger than the air vent rate because it penetrates barriers more easily.
- Helium is a limited resource - every atom of helium lost to air will escape the planet. I don’t see the point of using it for an application where there is an alternative.
The influence of the plants is very small; and it’s easy to just get a few people together in your home, increase CO2 to a high level (say 2000 ppm) and then go for a walk to have a more or less free decay of the concentration. I think we don’t need super high accuracy here anyways to make an informed decision about how much natural ventilation is happening.
Electricity Used per Day = 36.4 + 1.25*(wind speed) - 3.2*(air temperature). This model has an r2 of 90% so nearly all variability in electrical energy used is accounted for.
that’s really interesting, thanks for sharing Peter!
To answer your question: Yes, plants have an effect but it’s quite small and will only appear in very airtight houses.
also great to see that! I assume you were away for that period and so we are only looking at the effect of the plants, wind and air change rate?


