Evening all
Is there a way of being able to put the cop data from the install manual into emoncms as a reference line to show where my actual cop is sitting. So I know it will just be a straight line but want to be able to move it depending how I adjust my curve through the heating season.
Thanks all
Thinking off of the top of my head, here are some ideas. No idea if they will work.
1) If you just want a straight line, then create a Virtual Feed with the following process steps.
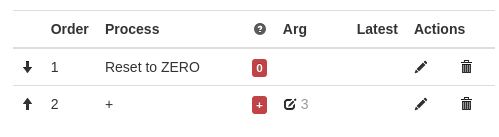
This is perhaps closest to what you asked for, but is maybe not what you actually need.
Trouble is, COP will change with both ambient temperature and flow temperature. It will not “just be a straight line”. If you’re using weather compensation, then one is derived from the other (via curve setting) but you need some kind of formula or lookup to get the COP for a given temperature. If you can figure this out from the manual, then a Virtual Feed that takes ambient temperature as the Source feed and then does maths to estimate the COP.
What COP data does your install manual have?
2) The “MMSPHeatPump” app can show “nominal efficiencies” for the heat pump, though it’s a little fiddly getting the data input into it. @MyForest explains how to it in this post and following ones. This basically does the calculations I described for solution #1.
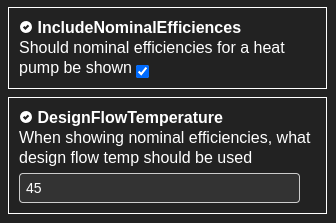
This will be the most accurate representation of manufacturers COP, but hardest to implement if someone hasn’t already done it. I’d be happy to help with this if you’d like.
3) The “MyHeatpump” app can simulate heat ouput using carnot equation. Just need to fiddle with the “Heatpump factor” until the chart matches numbers from manufacturer’s manual.
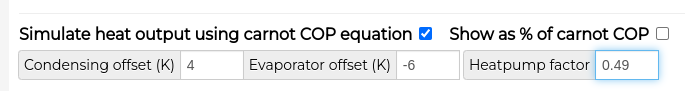
Not exactly what you asked for, but the easiest way to visualise actual vs expected performance.
1 Like