Please take this post with a grain of salt.
I’ll do a shameless plug for my mmsp heatpump app here just in case it helps.
Specifically it takes the interpolated_efficiencies and adds them to the graph.
I use it to guide me if I’m hitting the manufacturer’s suggested efficiency which is on the chart as the gold line:
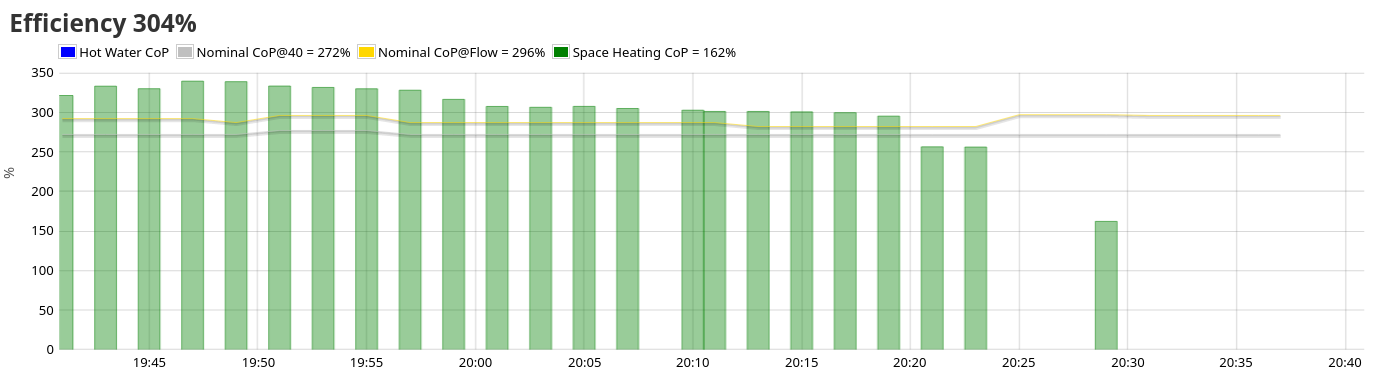
The grey line is "what efficiency would you be getting with this weather if you had a 40 °C flow so is like having a “things could be this bad” display. Of course none of us run our water that hot ![]()
You may find that setting up my app is more hassle than just working out the efficiency manually for some scenario you care about. Especially as you’d be looking to create a copy of the interpolated_efficiencies.json for an 11.2kW unit rather than my 14kW one.