I would look at this from a pressure drop. I have a suspicion that you’ll want numbers:
Ultrasonic Metering.xlsx (715.4 KB)
The slightly dog eared unit is a DN25 E4 with 260 mm x G 1 1/4" body; so has a Kv value aaround 12.
Pressure drop in service will depend on flowrate; flowrate will depend on power output / sytem dT. If youre system is running with a dT of 5 degC or above this is fine for up to 12 kW before the pressure drop becomes noticeable. 16 kW at dT of 7 degC also ok. 16 kW at 5 degC will work but is burning more pupm head than is ideal (spending £s on pumping electricity) so I’d step up a size if you’re on a really big unit.
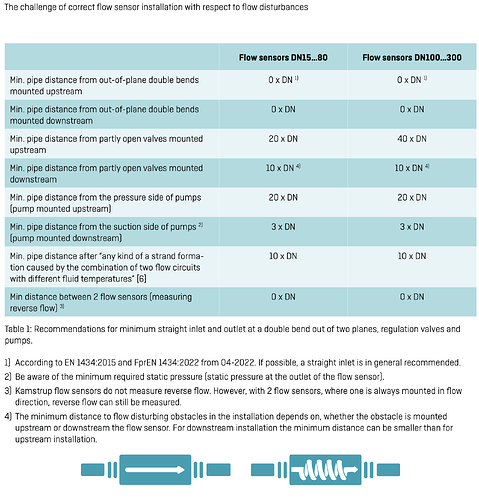
M-Bus and wireless M-Bus on this unit. Battery power. Limit on battery for these meters is 80 hours per month. You’re fine to read every minute at 9600 baud. You can’t read every 10 seconds. I can chuck in a mains supply for +£25 if you like. Then no limit.
Kamstrup units are nicer in this regard (every 10 sec on battery is fine), but you expect this at £500 vs £175 new (or £200 with mains). The Kamstrup unit also have a lower pressure drop but you can mitigate that by stepping up a size in the Axioma units if you’re fussed, as low flowrate measurement isn’t a think on heat pumps perticualrly.
Sontex excel when you’re full of glycol rather than water, and on the smaller meters because they draw power from the M-Bus so can be read as often as you like without killing the battery or needing mains supply.
Diehl are like the Axioma. Every 5 minutes for them on battery. The reason the Kamstrup is so good is that the previous generation was bloody awful (couldn’t read it every 5 minutes, which is all folks using them for non R&D applications care for) so they went way over the top on the next generation!
Landis are every minute for the basic battery powered meters.
It all gets a bit academic.
For the curious:
On battery most meters either use 32 second measurement intervals, and even longer filtering windows, or they use “adaptive” measurement intervals, where they measure say the flow every 2 seconds but only bother measuring the temperature every 60 seconds unless there has been a sudden change in flowrate that the meter has been configured to interpret as meaning that the temperature might be expected to change quickly. So when you read them every 10 seconds thats lovely but the data you’re getting is going to be measured less often than this and then “filtered” (usually moving average) before it is spat out on the M-Bus.
(and they can usually be configured in any one of these modes in software)
If you take a look at slide 32 / 33 here you can see that the meter shows a delayed rise and a delayed fall in the flowrate vs what we knew the flowrate and valve position to be from independent measurements:
You’ll see the same thing for most heat meters. Probably the flowrate change lags the pump/compressor electrical power change due to moving-average filters in the OEM data? Internal meter sampling intervals / filtering behaviour will be why. All comes out in the wash in the final energy figures but don’t assume that the ramp rates you see are really ramps. They’re probably steps. 
![]()


