Not necessarily an API. It could be as simple as one or more CSV files (or JSON or Parquet or format of your preference) that are refreshed periodically with the data. My thinking was it would be the data you’re publishing openly in the tables on heatpumpmonitor.org as this would be most easily set up. It is also anonymised which means the privacy controls can be less stringent.
For the granular individual data, I assume the heatpump owners wouldn’t want to publish it openly. We are working on a Trust Framework mechanism similar to Open Banking, where a third party service (an app for instance) can use a standard mechanism to get permission into an individual’s energy data. In that case you (the data publisher) and the app provider would need to be registered in the Trust Framework so your users can be confident the data access is from organisations that have been checked out and approved.
We’re not there yet, so I think we can assume individual device data is out of scope for the immediate term. I thought I’d flag up the concept as the heat pump data use case would be interesting to get set up.
No, we don’t mirror data. We just index it and point to the data resources on the data publisher’s site. As I mentioned, we prefer to index underlying data files rather than web renderings of the data as our intention is for the index to be fully machine-accessible to make it easier to include in data analysis tooling.
Ok great, here’s the json data file that is used for the heatpumpmonitor.org front page, stats, costs and graph pages: http://heatpumpmonitor.org/data.json. This file is updated hourly, though you are unlikely to see much change during that interval, the 30 day stats will probably change a bit every day but not by a large amount.
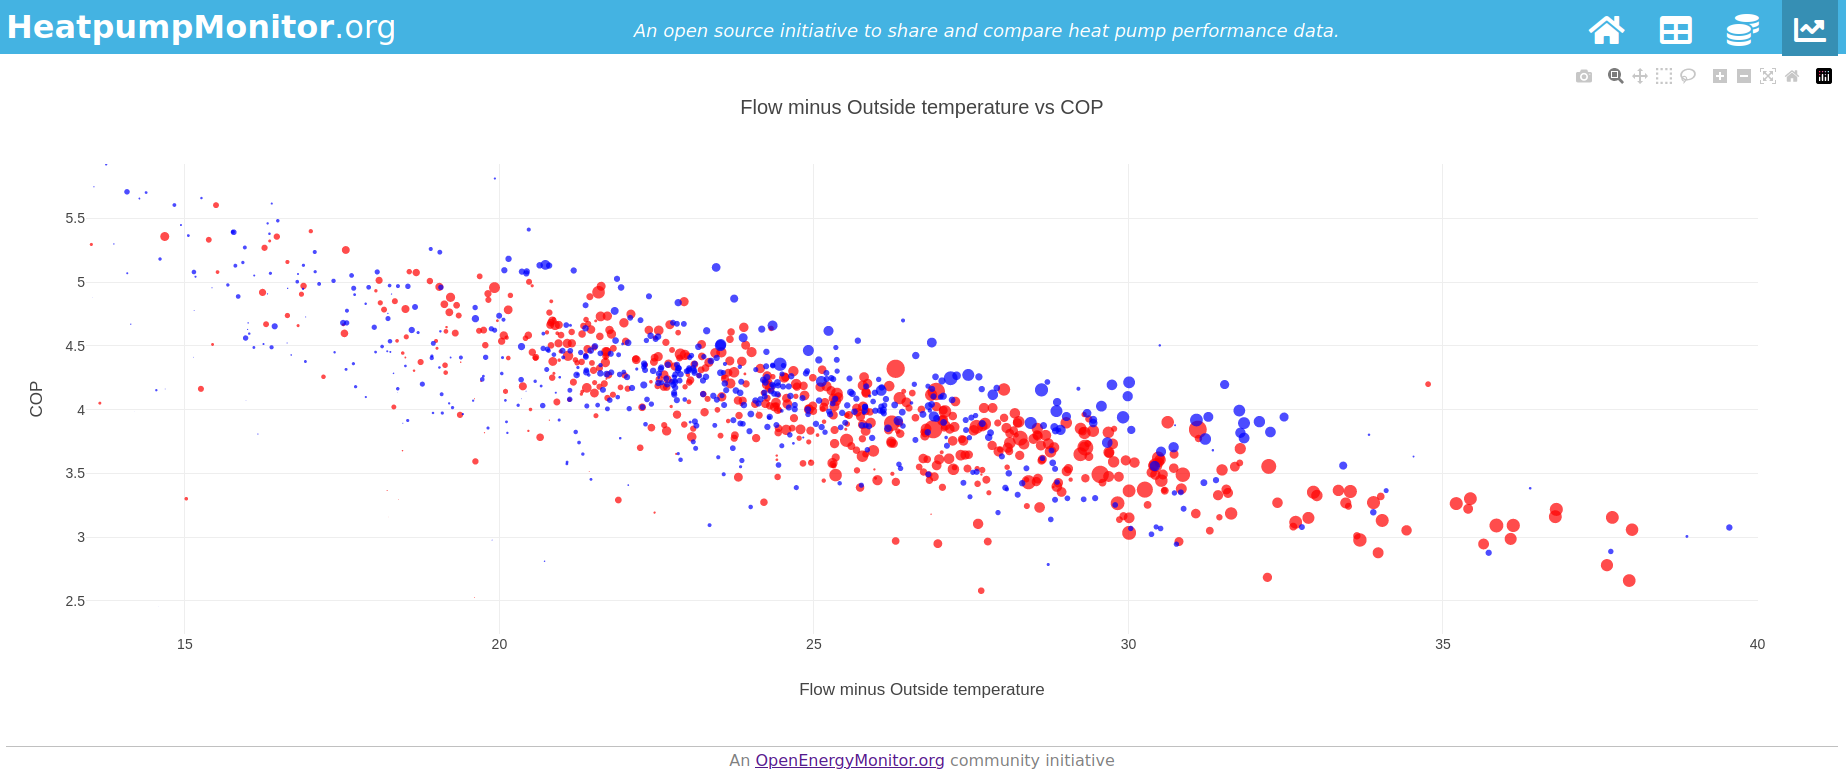
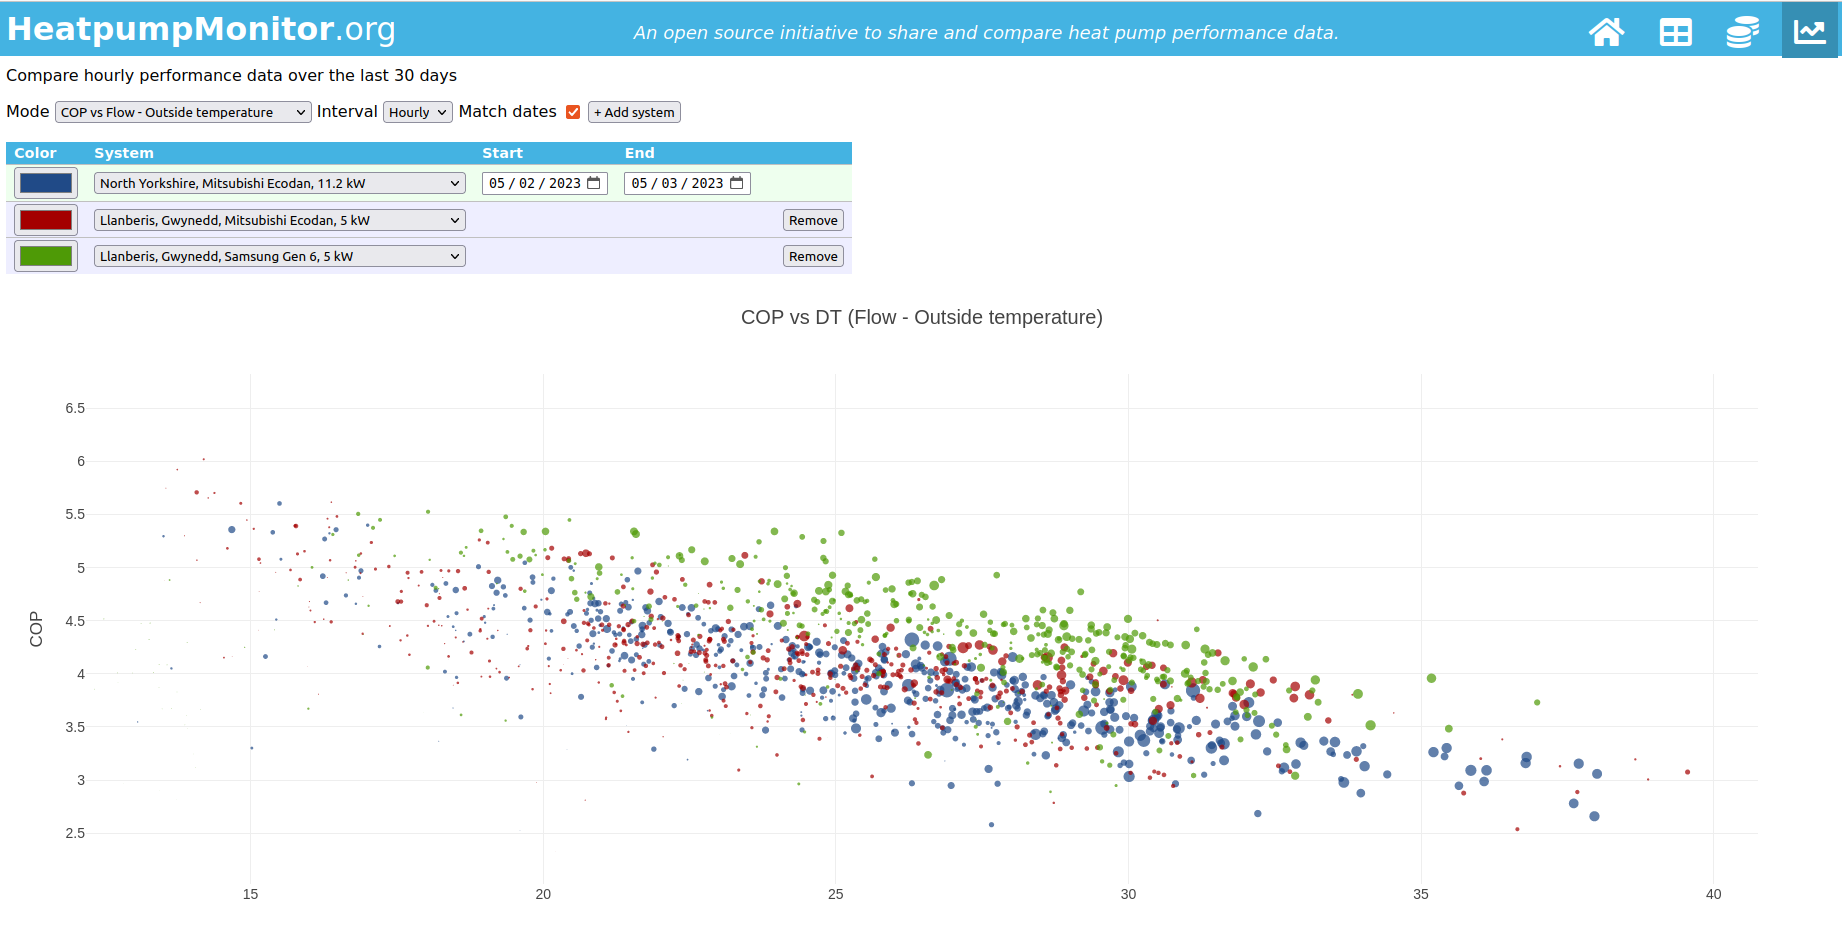
A few folk have asked for a way to compare more detailed plots of e.g COP vs outside temperature, or COP vs flow - outside temperature using more granular data for each system e.g hourly averages… I’ve made a start on this… not finished yet but through Id update on progress so far:
Here’s an example with @Timbones’s heatpump in red and my heat pump in blue showing hourly average COP vs flow minus outside temperature over the last 30 days:
The size of each marker is proportional to the heat output in that hour.
My reading of this plot is that we have a lot of overlap especially below a DT of 26K (flow-outside). Then I seem to have some higher COP’s from 26-32K and very few points at the wider DT’s that @Timbones is seeing.
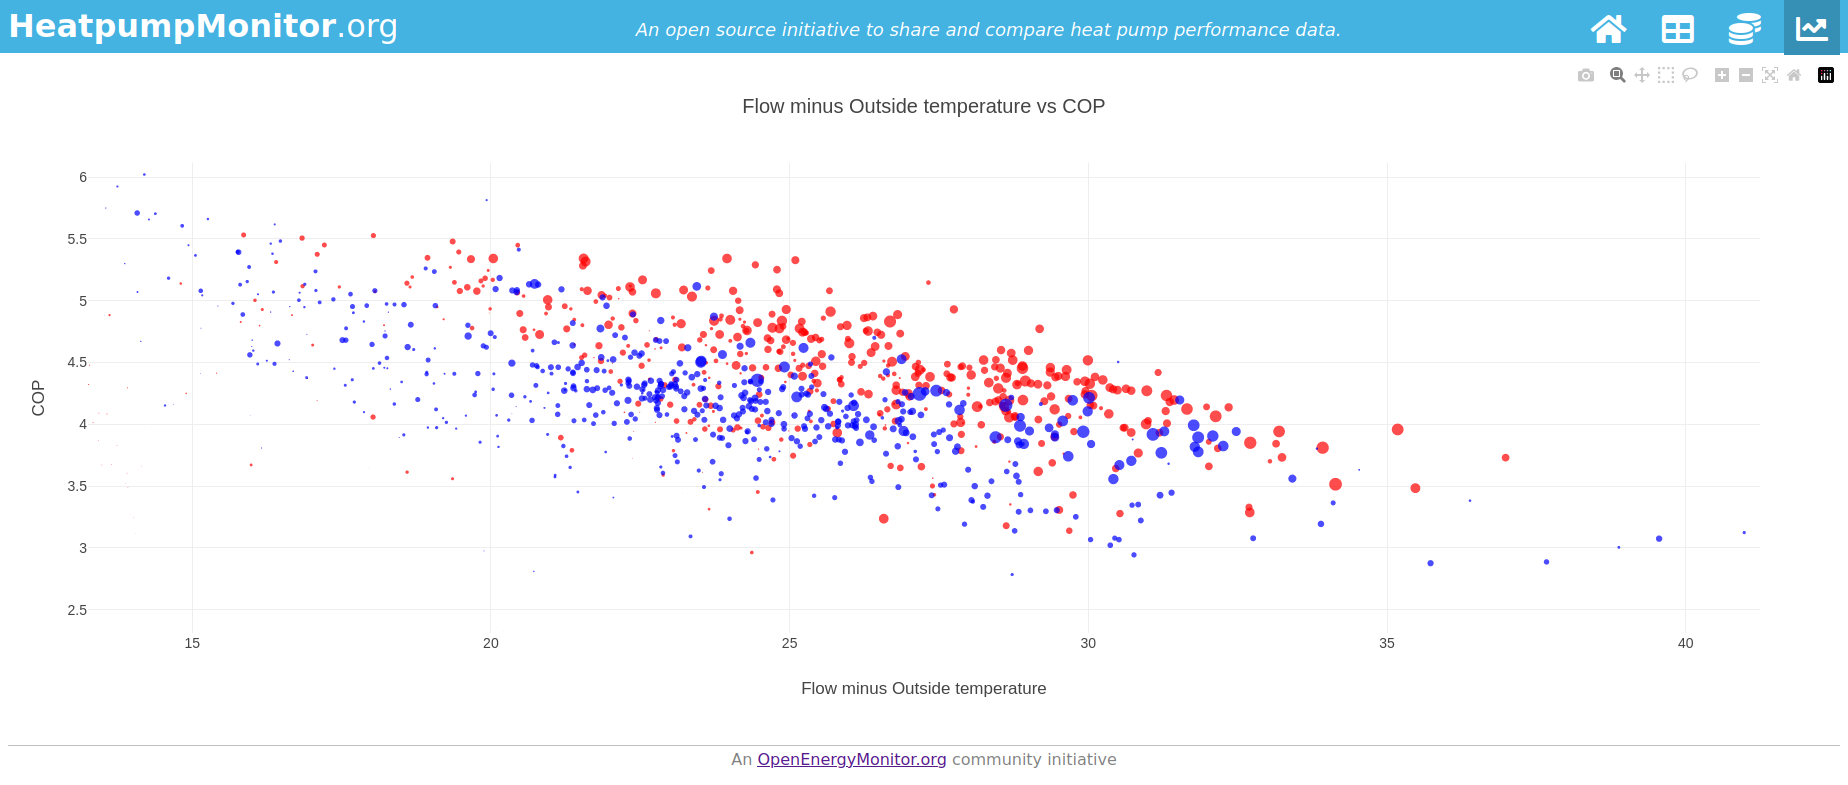
Comparing my system (blue) with @glyn.hudson’s system (red), gives a clearer shift in performance:
This is awesome! Exactly the sort of thing I was hoping for.
Some quick questions:
could this be packaged into an ‘app’ within EmonCMS, so that people can view their own data without having to share it? Perhaps without the comparing-to-another feature.
I’d really like to see how well my heat pump performed in February vs. December, or vs. this time last year. Either by selecting two time periods, or shifting the shade of the dots as they get older - is this useful to people generally? Or just tweakers?
is it just COP vs. temperature? what other comparisons are available? any thoughts on which ones could be useful?
is there a particular advantage to doing hourly averages? would daily averages require less processing while still providing the same insights?
While considering additions, could details of the measuring equipment be added? Such as, is it the controller reporting over some API, or a wired-in interface, or additional independent monitors direct to an emonPi or similar. That may help explain some things to outsiders, such as the relatively low precision (1°c steps!) of some measurements through melcloud.
I’ve also been thinking it would be good to (have the option to) capture additional information about each system, for example:
A schematic diagram of the pipework
Make and model of heat meter
Details of how the data is collected and uploaded
For example I have to pull most of the data back from NIBE Uplink and only do that every 2 mins, so the readings are a little ‘lumpy’
I guess we could add a ‘Profile’ page for every System, containing whatever details the owner is willing to share. I’m not sure whether that should be completely free-format, tightly controlled (Name : Value type of thing) or free-ish but aligning to a standard template.
@mjr@dMb yes I agree would be good to add all of these in, it would be great to have schematic diagrams and some kind of profile page and definitely full information on the metering used and boundaries.
These are amazing @TrystanLea , thank you for the effort here.
A couple of observations when you. hover on the data points.
Is it worth rounding them down to one decimal place?
And do you think it would be worth showing the timestamp for each data point? To help track down a day in particular for example?
Via twitter & probably as previously suggested the ability to normalise some of the cost and/or energy values on a per m2 basis would also be use. Possibly a tick box on each table - normalise to m2 [YES/NO]?
It’s difficult isn’t it. “Weymouth” is highest at over £11 per day but as per the comment that’s 244m^2. Then “Derby” is second lowest at about £2.50 per day and that’s 315m^2 - but it’s a Passivhaus. Those two properties are always going to be at almost opposite ends of the scale and difficult to normalise - unless we start comparing actual consumption with predicted consumption or something like that.
I’m mindful that we then get dangerously close to the argument about the unreliability of EPCs for predicting consumption values…
Interestingly, my EPC (done at end of the build) is pretty much spot on - extimate 60 kWh/m² per year, currently 61 kWh/m². This is total energy use rather than heating of course.
Nevertheless I think the ability to normalise for floor area is useful because it is understood (I think) by the audience and users of the HeatPumpMonitor that insulation levels vary across the sample - indeed by normalising by floor area this helps to show this to a certain extent.