Incompetent Installers , incompetent regulation Do I need a MIM-B19N?

Hi William,

I have finally bitten the bullet and started the self test routines built into my Samsung .

Forget the MIM-B19N , the Self tests are very revealing !

Heating Test 1 , Press switch K1 once.
pressing K4 repeatedly gives the following information on the four character display

1000 Comms status = OFF
2000 Ordered Baud rate= OFF
3000 Actual Baud rate = 0 , OFF
4008 Outside temperature of 8 C . So External Temp sensor is working!
5051 Discharge Sensor C,
6029 EVA in Sensor
7034 Inlet water temp 34 C
8035 Outlet Water flow Temp 35 C
9010 Condenser sensor 10C
A000 Amps = 0!!
B000 Fan RPM = 0, Stopped.
C000 Target discharge Temp , C
D480 EEV ?
E100 No Protection enabled!
F024 IPM Temp 24C

On running the De-icing Test test no 2
the White Vapour/Steam began pouring from the device with the fan OFF!

Thinking better I rebooted the Heat Pump.

Clearly de-icing IS working and consuming lots of electricity!!

I will pluck up courage to find out How much Electricity is consumed during de-icing !

I do not need a MIM-B19N !

ian

Hi William and Christian,

The Samsung outdoor status tests,

6029 is the Evaporator Sensor Temperature sensor at 29C

D480 is the Electronic Evaporation Valve at an opening of 80h.

E100 is the Motor Power Module Temperature of 0 C. ??

Given that every test passes with flying colours I assume that Everything is O.K

My Heat Pump just does not have the power in these conditions. Hence the Cycling.

The violent cycling will , eventually , quickly wear out the Heat Pump.

I have stopped the Cycling by dropping the evening temperature to 12 C, Hypothermia.

What Do I Do now?

An incompetent installer with a self serving “registered charity” as regulator.

ian

My heat pump was operational last winter and honestly, the first time I ever saw or detected a defrost cycle was on the 9th December this year when I happened to look at it and saw it was frosted up. I thought something was wrong because those with Mitsubishi units on here are always talking about defrosting, but I realised it must be because we had not had cold enough temperatures last winter to need defrosting.

When the cold snap came it was clear to me that the reductions I had put in place on the water law were not going to keep the house warm enough so as I said above, I bit the bullet and reinstated the 15/-2, 37/50 recommended temperatures.

I then decided to stop fiddling and to trust in the system for a few days and it looks okay with the caveat that those sub-zero days were more expensive.

If I was you:

  1. I would set the overnight temperature to 2c less than your normal temperatures, so the house doesn’t get too cold, then leave it running.
  2. I wouldn’t worry about cycling; if it breaks then claim a new one on the warranty.
  3. I would keep an eye on the device’s own usage and generation statistics, for instance using the photos below I believe my CoP for all of December including the cold snap was 3838.1/1346.7 = 2.85. This info is available on a daily basis through the control panel, you can see daily values too. Keep a log of CoP by day, share some of this info here.

  4. I would contact Samsung support (01932 575604) and ask how the defrost works and how much energy they expect it to consume during defrost (mine seems to use just under 1kW but is a 16kW model). Are there any settings that you can use to make this work better for you?
  5. I would consider getting an emonPi to monitor the heat pump (1 or 2 CTs, maybe 4 DS18B20 temperature sensors for flow/return/outside/inside plus you would need a little breakout board to use all 4 with the emonPi). Alternatively there’s a heat pump monitoring package but I think that’s more than you need. EmonTx v4 would probably be cheapest but you’d want to check with the shop exactly what you need.

You keep using the phrase “violent cycling”; I’m not sure it’s violent at all?

Please, run your heat pump so you are comfortable and warm.

Hi Christian,

Again , Many Thanks for the information about your Heat Pump consumption in December of 1346 Kwh.

I thought my 520.4 Kwh December consumption was excessive!

Perspective reset.!

I have been pondering the Heat Pump flow temperature variation against outside Temperature using Weather Compensation.

A typical demand graph , as set by the 201*, 202* and 203* Filed parameters is shown on the first graph.
WL1_Image.pdf (5.8 KB)

A typical COP Variation of Efficiency with outside temperature is shown in the following graph.
Heat-pump-COP

On Multiplying the Demanded Transfer function by the COP transfer function the following graph is produced (Scilab)

Transfer_function_1.pdf (8.7 KB)

The Resulting Actual Transfer function, Water Temp against Outside Temperature is highly non-linear.!

At low outside temperatures the Heat Pump Control box is demanding more power when the Heat Pump can supply.

The difference between the demand and supply of power are clear.

Being unable to meet the demand the Heat Pump rapidly cycles.
power_Dec_15-19.pdf (33.8 KB)

QED , my heat Pump is too small for the winter conditions.

ian

Hi Christian,

I will buy one of your recommended sensors , but , later in the year.

I will also take your advice about my use of the word violent , as in Violent Cycling.

My tests with the heating and separate De-icing tests have shown up on my home made energy/Power sensor.

The De-icing is shown as a high frequency burst of perhaps 300 Watt amplitude.

Most of my "Violent Cycling is therefore probably the result of the High Frequency bursts used to provide a shock wave , breaking up any ice.

Normal water Heating has no high Frequencies and an amplitude of perhaps 250 Watts amplitude.

I will not pass final judgement until I have performed a much longer self test on the Heat Pump.

So, I may have overdone my anxiety with the Cycling, de-icing et al.

The very Low frequency Cycling of the Water Flow Temperature has also stopped because of the 50 l Volumising tank.

I will , however have to reduce the large Electricity costs , circa £260 for the month by removing the HOT Water tank supply.

many thanks ian

Hello @iantelescope sorry to hear that the heat pump has been giving you so much trouble. That cold period in December was really testing for a lot of heat pumps , coupled with some astronomical high electricity tariffs it has not been an easy time!

Are you able to share the monthly energy consumption and generation figures as recorded by the heat pump itself (available on the samsung display) as shared by @christian above. I read that you had a lot of trouble getting the flow sensor installed correctly, hopefully that is working now and giving you reasonable figures via the display (assuming its the Sika VFS flow sensor you were referring too)

What was you annual gas consumption before installing the heat pump? Ideally if you have consumption in kWh rather than cost as it’s hard to make comparisons on cost these days. What did your installer determine you design heat loss to be? and do you know the conditions choosen? e.g -3C outside? What is the capacity of the heat pump and do you know the design output of your radiator system at 35C/40C/45C? Sorry if you have already mentioned these, I have read through everything above but may well have missed something.

To give another point of comparison, my ecodan heat pump consumed 17-20 kWh/day through December 9-16th (outside temperature averaged -0.5C, minimum outside temp -5C). I got about 60 kWh/d of heat for that and an average COP of 3.3 for that period. My electricity unit rate for that period averaged 35.4p/kWh, which is about £6-7 per day. My total electricity consumption for the heat pump in December was 407 kWh.

@glyn.hudson has a Samsung heat pump and it’s the best performing heat pump in our list of heat pumps sharing data openly, see: https://heatpumpmonitor.org, so there’s probably a good chance that with a bit of work you can get yours running well. Have a look at Glyn’s dashboard here for a more detailed view Emoncms - app view dashboard, try clicking on a particular day to see the detailed power consumption, heat output and flow and return temperatures. Glyn had a lot of cycling in warmer weather but the performance was really good. I think your graphs are of the colder temperatures and so are probably defrosts? Glyn’s samsung extracts heat from his hot water cylinder to defrost the heat pump as far as Im aware. Glyn’s December consumption is also around 400 kWh (our houses are very similar).

Our outside temperatures here near the coast in North Wales are usually quite a bit milder than what you probably experienced.

1 Like

Hi Trystan, Christian and William,

Yesterday , my kindly neighbour offered to lend me his Oil filled Electric Boiler .

My Neighbour was concerned about the large clouds of white Water vapour appearing nightly during December.

I blushed to the roots of my hair, being, previously a staunch advocate of the benefits of heat pumps".

Being human and male , I have lost the all important "face ".

My neighbour further enquired if I would be returning to my Gas Boiler given the 520 Kwh consumed in December.

I told my neighbour that I could not return to a gas boiler my “installer” having demanded it’s removal in June 2022.

The performance of my “installer” has been indefensible, as has the behaviour of the MCS “regulator”.

As of now, January 2023 my Heat Pump aphorism is

"Isn’t it grand! Isn’t it fine! Look at the cut, the
style, the line!

"The King is in the Altogether " ,

I am sorry to admit to having lost “the faith” but Heat Pumps must , by 2023 be efficient and stable.

Heat Pumps Must have some leeway between Hypothermia and Fuel poverty.

Please see the attached graphs of energy and power 6-7 th Jan.

energy.pdf (12.6 KB)
power.pdf (6.6 KB)

I currently use external K type pipe clamps to measure water Temperature.
I will , later this year, hopefully, get a device to accurately measure the output Power using a water flow sensor and a water temperature sensor inserted into the water stream.
I cannot therefore accurately measure the COP.

My Annual gas consumption was 8800 Kwh , I do not enough data for the Heat Pump Energy Consumption.

My “Shell” Smart Energy Display has not worked since installation in February 2022.

My Samsung was delivered with a Heat Pump power meter and a Cylinder power meter which have never been fitted.

Shell is charging 33.763 per Kwh and a whopping 50.66 p Standing charge for a smart meter with no display.

So , with the exception of my home made power meter, I an unable to see what is happening!

ian

Hi Trystan,Christian and William,

I have added the Samsung’s own monthly Energy readings from Aug to Dec 2022.

The Total Energy consumed by the Samsung since installation is 1240 Kwh.

Given that this only represents 5 months of consumption the very approximate annual consumption is , approximately 1240 x 12/5 = 2976 Kwh. My "installer " estimate was 3853 Kwh.

My heating consumption in 2021 was 10,747 kwh.

My very approximate ~Cop = 10,747/2976 = 3.6 with my “installer” estimating a Cop of 3.35.

My Average flow Temperature was circa 35 C with my installer originally estimating a Flow temperature of approx 47 C.

These “installer” estimates were, within a reasonable margin for error , confirmed by three others asked to quote.

So, My Very imprecise Consumption is about par with the original estimates.

My Very imprecise Cop is about the same as the original estimate.

The original MCS documentation does not give the Outside Temperature for these estimates…

Many thanks , with your consumption information I have had another **another perspective reset !

Many Heat Pump users are far worse off than me!

With the returning higher temperatures the White Smoke, over consumption warnings ,De-icing and large Electricity consumption has stopped.

I will now increase the Field settings 201*,202* and 203* to -5/45 and 15/33.

Many thanks
ian

Hi Ian,

I’m really glad you have reinstated warmer settings, although I suspect your -5/45 should really be hotter given you are so much farther north and my setting is -2/50 (I have radiators).

WRT the steam, I have never seen any from mine but it’s out of sight.
I found this short video on YouTube which says it is normal.
One thing occurred to me - have you checked that the drain holes in the bottom of the outdoor unit are clear?

I remember that only when we started the install the penny dropped that with a 22000kWh heating demand, our electricity bill was going to increase by probably 6000kWh/year (SCoP 3.65 estimated by installer).

1 Like

Thanks Ian, are you able to get the monthly energy generation figures from your samsung that should give you a more accurate idea of COP rather than a comparison with the previous year’s heating energy consumption for the gas boiler.

There should be two sets of figures: ‘Consumption’ and ‘Generation’

See @christian’s post above:

To Trystan and Christian,

I stand corrected …I did not see Energy Generation!.

Total Generation from 19th Dec Jan 8th = 699.4

Total consumption = 233.1 from 19th Dec to Jan 8th = 233.1

Therefore, Cop ~ 699.4/233.1 = 3.0000 exactly !!

Many thanks you have made my day. At last some good news!

The Heat Pump seems to be efficient.

I cannot however examine what happened during the deep freeze from 6th Dec to 19th Dec.

My Heat Pump is , however, now showing a different form of cycling. See attached graph
power.pdf (12.2 KB)

This Cycling only occurs when I use the Hot Water with the Cycle period being exactly 10 min.

The Cycling that occurred during De-icing had a different Cycling frequency.
power_Dec_15-19.pdf (33.8 KB)

I suspect that the Heat Pump is unable to supply enough Power to meet the demands of de-icing and / or Water Heating.

My Theory is that the Heat Pump power supply is overheating , switching OFF, cooling down for 10 minutes and then switching ON again.

The 5Kw Samsung is , perhaps, underpowered for the demand , especially during the sub zero temperatures.

A larger powered Heat Pump would , yet further, increase the Energy , and money, consumption.

ian

ian

Hi Ian,

I’m glad you have restored some faith in at least the heating part of your system.

I assume the cycling you refer to is in power.pdf between 14.00-17.00?

During that time it’s only using 300w at peak, I’m not sure you need be concerned.

There isn’t really enough info to glean anything else - in order to support your suggestion something was wrong, we’d need to see some or all of the following temperatures for the same period, on the same chart:

  1. outside
  2. flow
  3. return
  4. target
  5. tank

The real question I think, is; did it get your hot water to an acceptable temperature?

Hi Christian,

Again Christian , many thanks . Your advice is welcome.

Please see the following Temperature Energy and Power graphs for the same time interval.

The Power is again shown as Power.pdf
power.pdf (12.2 KB)

The Energy is shown as Energy.pdf
energy.pdf (22.4 KB)
This shows 1500 Wh of Energy being used during the oscillations!

The Heat Pump Output is shown as abs_temp_HP.pdf
abs_temp_HP.pdf (9.7 KB)

The Delta Temp Heat_pump_out - Heat_pump return is shown as del_flow_temp
del_flow_temp.pdf (11.0 KB)
This shows the Oscillation on the power as an identical oscillation in the Delta T .

So, the flow delta_T temperature and the energy of 1500 Wh shows the Hot water being heated.

But why the Oscillations ?

ian

Hello @iantelescope thanks for these, could you give a bit more detail on your monitoring setup? you mentioned using an Arduino above, is that using a CT sensor or reading from a meter? How are you doing the temperature sensing?

Would it be difficult for you to share the above data as a CSV file? ideally if you have 10s data that would be great. It would then be easier for us to zoom in on the periods with the oscillations. Ideally if you have flow and return temperature separately.

It would be easier if you simply pasted the image into a post rather than using PDF.

Hi Trystan and Brian,

The Following represents my , hopefully, unambiguous , description of my current measurements.

I will buy , or build a better measurement structure when I have more money!

Power Measurement

I measure the Power using a Current Transformer ,CT, clamped across the Heat Pump Mains input.

The CT output Voltage is then fed into an Arduino.

The Arduino “program” performs no Filtering or Windowing on the measured voltage.

The Arduino then calculates the RMS Energy in Joules over a 10 second measurement period.

The RMS Energy over 10 seconds is then stored as a measure of power when multiplied by a Calibration Constant to give RMS Power.

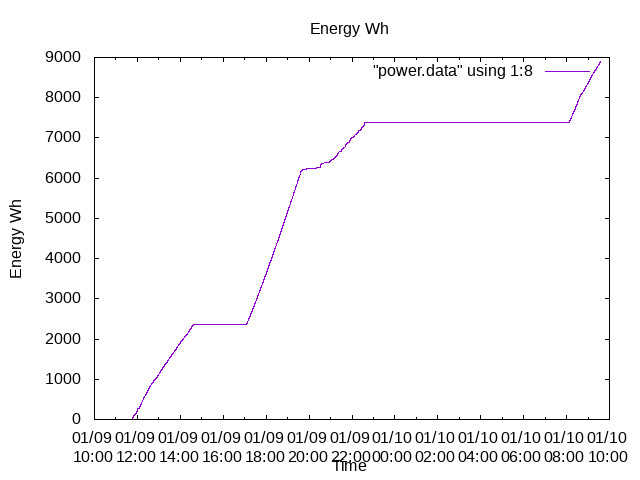
The RMS Power is then put into an accumulator as a measure of RMS Energy.

Both Power and Energy are stored on an File on an SD card,.

Power and energy data
1619.csv (43.7 KB)

The Data consists of the following space separated data fields

Year Month Day Hour Minute Second Power Energy.

Temperature Measurements

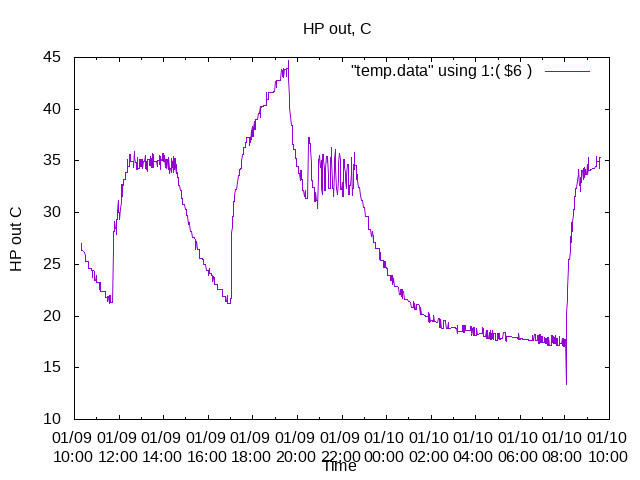
Four K type Thermocouple Clamps are attached to

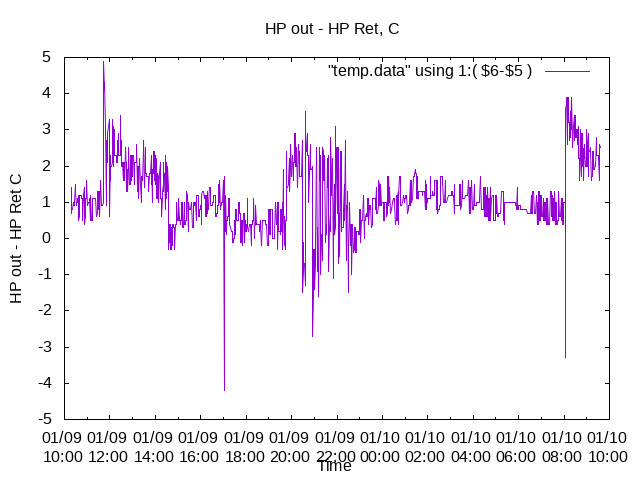
1 The Heat Pump Output

2 The Heat Pump Return

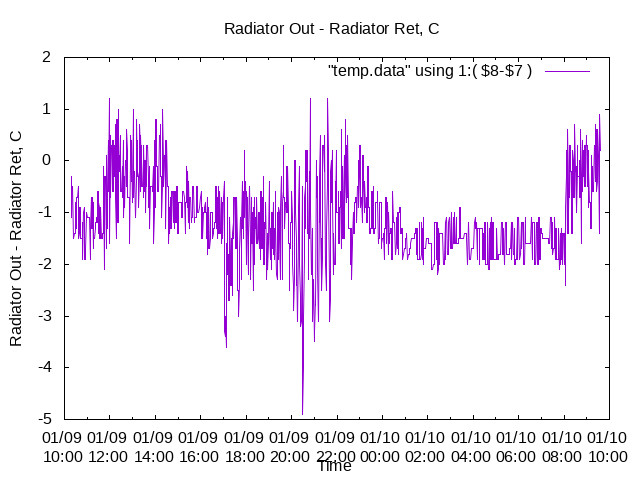
3 The Radiator , or Heat Exchanger Output.

4 The Radiator, or Heat Exchanger Return.

I have stored the Temperatures using a four input K type Temperature Logger.

Temperature Data
01061939 .csv (51.9 KB)

The Temperature data is stored on an SD card in the following Format

AT 2023-01-06 19:39:34 1m 29.3 31.6 30.2 30.3 C

where

2023-01-06 is here the year - Month - Day

1m is the Temperature Sampling Period

29.3 is the Heat Pump Output Temperature

31.6 is the Heat Pump Return Temperature

30.2 is the Heat Exchanger or Radiator Output Water Temperature

30.3 is the Heat Exchanger or Radiator Return Water Temperature.

The Measured Temperatures are here the external Temperatures of the pipes!!

The Temperatures shown here are NOT, therefore, the Water Temperatures within the pipes themselves !

File Formats

I will in future show the Output Files as both PDF and Jpeg.

For 9th Jan to 10Jan the files are now
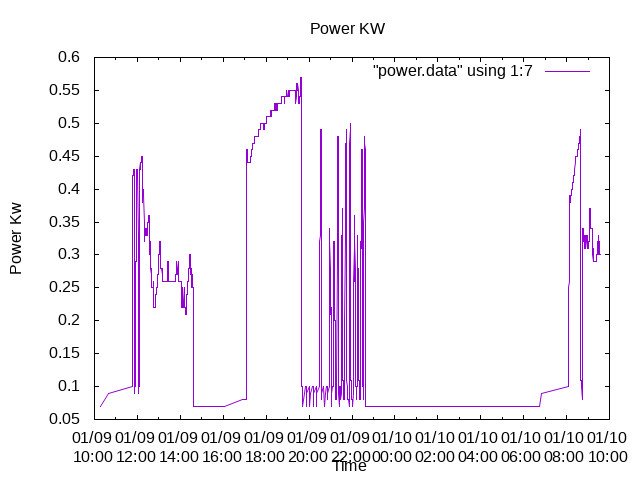
power
and
power.pdf (9.4 KB)

Energy
energy.pdf (16.2 KB)
energy

Absolute Temperature
abs_temp_HP.pdf (9.9 KB)
abs_temp_HP

Delta T HP water Temperature
del_flow_temp.pdf (10.5 KB)
del_flow_temp

Heat Exchanger ( Radiator )
del_rad.pdf (11.0 KB)
del_rad

Hysteresis?

Could the Oscillations or Cycling be the result of the Hysteresis setting of the Water Law Thermostat?

The Hysteresis setting appears to be set by selecting from

1: Field option 2091 Option 0 . Neither Water Law Thermostat nor Room Thermostat Switch used.

2: Field Option 2091 Option 1. Room Thermostat only used.

3: Field Option 2091 Option 2. Room Thermostat AND Water Law Thermostat used with Hysteresis = 0.

4: Field Option 2091 Option 3. Room Thermostat AND Water Law Thermostat used with Hysteresis = 1.

5: Field Option 2091 Option 3. Room Thermostat AND Water Law Thermostat used with Hysteresis = 2.

All of these options work on my Heat Pump,

I will experiment with changing the Water Law Thermostat Hysteresis, 2091 options

ian

Ian, thanks - this is a bit more usable.

My interpretation of your data is:

  1. from 12.00-14.30ish, normal heating, looks fine.
  2. from about 17.00, water heating, looks fine.
  3. from about 20.00, normal heating. The usage pattern here looks like mine does, when the heat pump is finding it incredibly easy to achieve the flow temperature according to water law.

Of course I may be wrong but I saw similar patterns on Glyn’s public dashboard, especially when his flow temperatures were very low.

What water law rules were recommended for your system?

Hi Christian,

Perhaps my neurotic contemplation of My Heat Pump performance would be allayed with Power , Energy and Temperature Graphs from other users?

The Oscillations are clearly real in that they consume lots of Energy, but are the Oscillations common with other users?

Are these Oscillations the result of Hysteresis?

Many years ago , a Greek engineer, perplexed by my use of “Hysteresis” translated Hysteresis as “madness” .

Perhaps my Heat Pump is “mad”?

Neither my “installer” nor "Dalliam Samsung " nor “Telford” have ever advised or recommended any system settings for my "unique " system.

ian

Have you seen the public dashboard thread?

Have a look at the Samsung 5kW one, click on All Time then click on the column for 7th October, I think you will see similar performance.