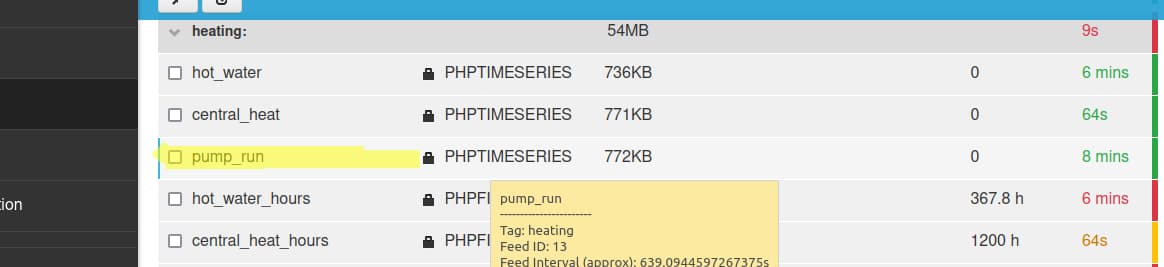
I have a feed that is defined as PHPTIMESERIES, the sensor only writes a value on change, or every 10 minutes. My understanding is this means the emon database holds a time-value pairs.
To get the step in the data, when my valve changes I now write the old and new value with a 1 second gap between them. e.g. when valve opens I have data like
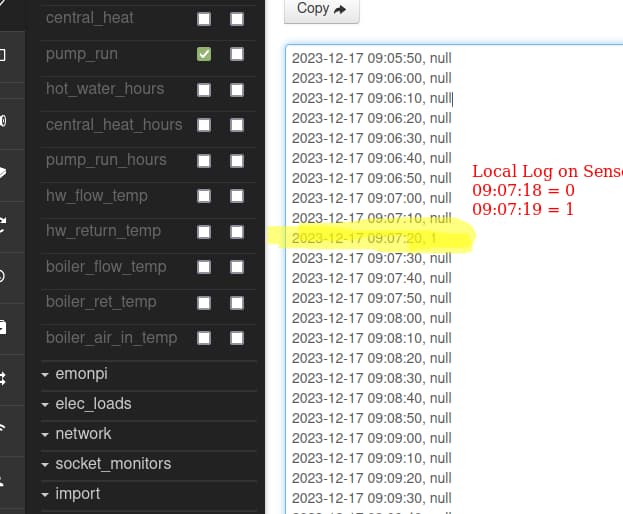
09:00:00 = 0 (API call as 10 mins since last one and no change)
09:07:18 =0 (API call when valve opens, value before change)
09:07:19 =1 (API call when valve opens, value after change )
I can see these in the local log of the emon API calls of the Sensor.
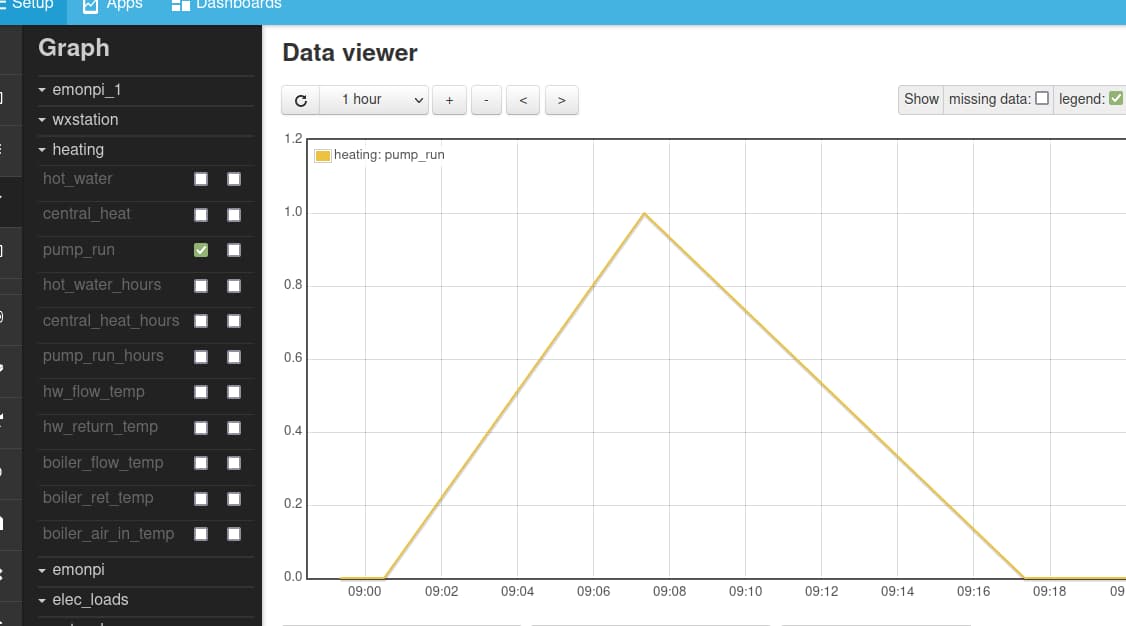
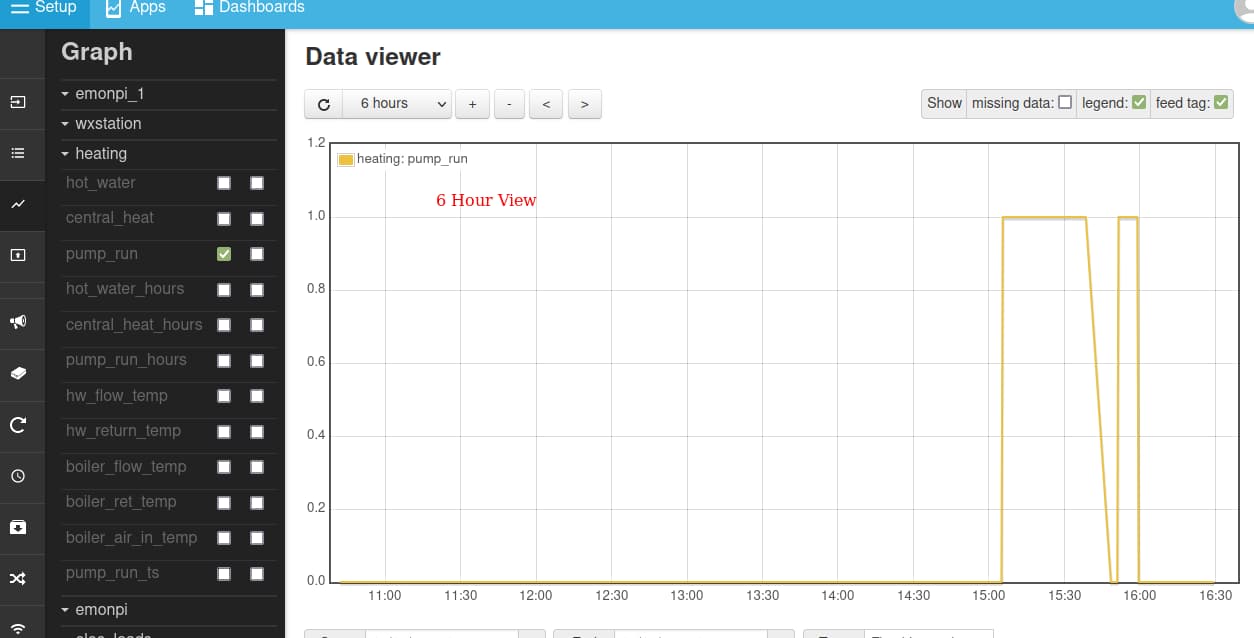
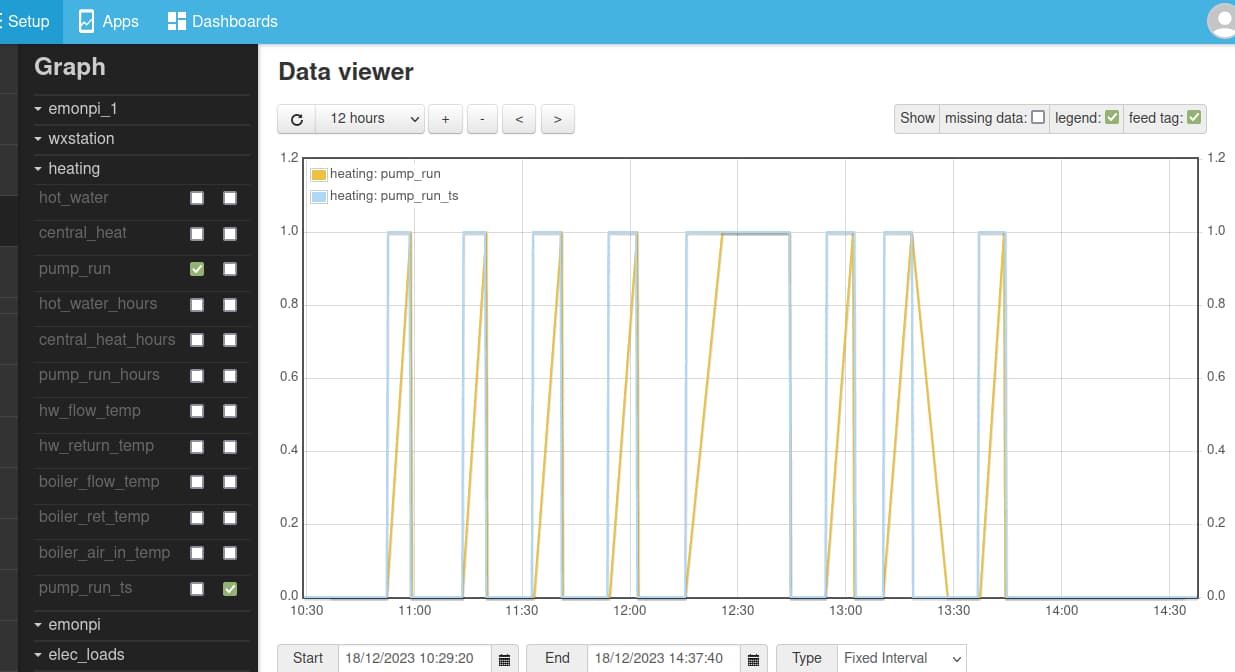
When I look at the graph on I still don’t see a step as the point at 09:07:18 is not there (picture 1),
There are a lot of null values at 10 second data resolution, the same as when I use PHPFINA what I was expecting to see was just the three time value pairs? PHPTIMESERIES seems to respond the same way to PHPFINA in both the graph and API?
Am I missing something obvious about the difference between PHPTIMESERIES and PHPFINA, I tried searching its still confusing?
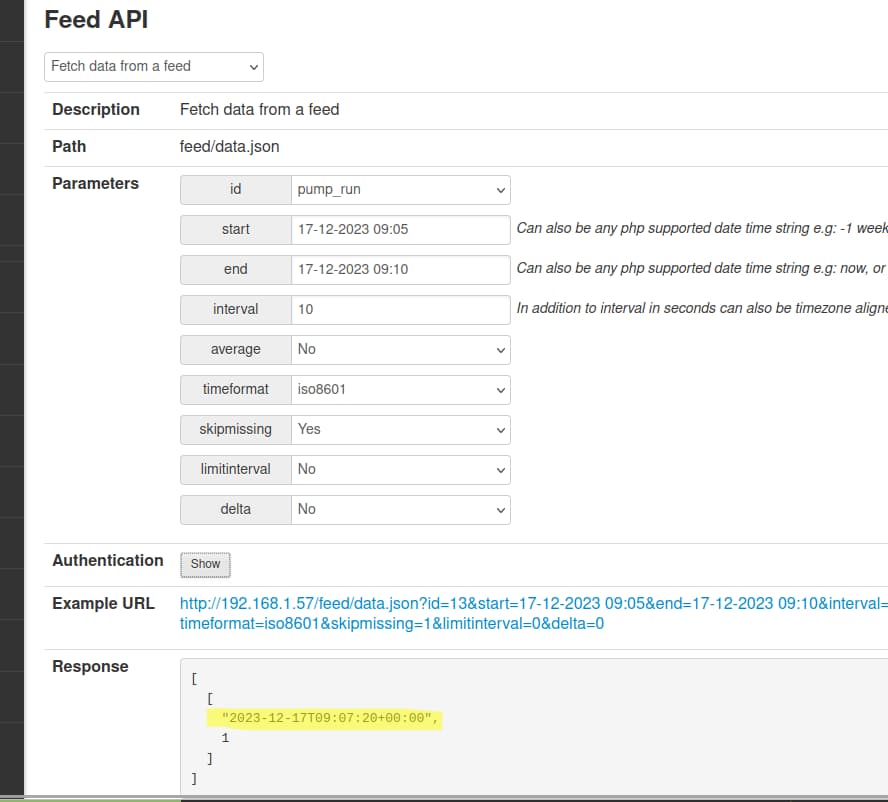
You are correct in how the data is stored. What you’re struggling with now is how that data is read out of the feed. With the interval set at 10s, emoncms is sampling the feed and returning values that it finds at those intervals. It won’t see or return the values in between.
It will also return nulls for every time point in between the stored measurements. You can hide the nulls by selecting the appropriate option at the top of the CSV section.
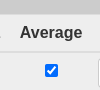
You may have more luck ticking the “Average” option for the feed, which will replace those nulls with some value. This may give you something close the step graph you’re looking for.
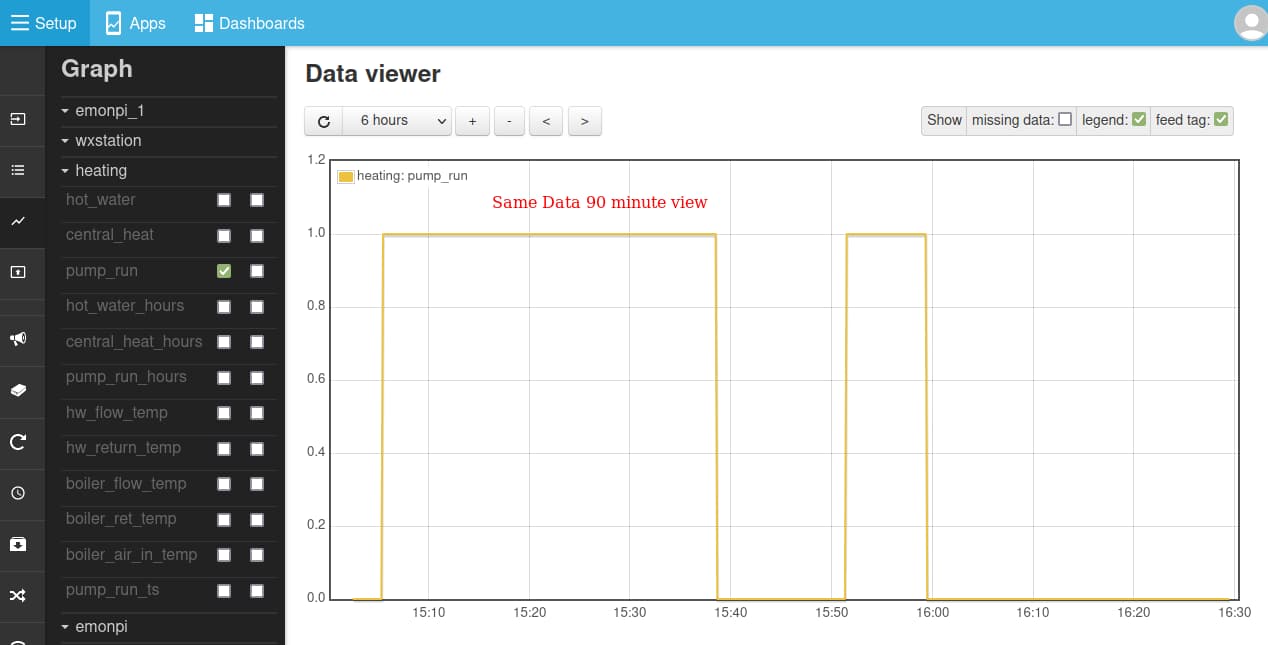
Thanks for confirming, I changed the writing system to allow 10 seconds between samples when the valves change. See attached This is the same data viewed over 6 hours and 90 minutes. Over 90 minutes I get what I am looking for, over 6 not!
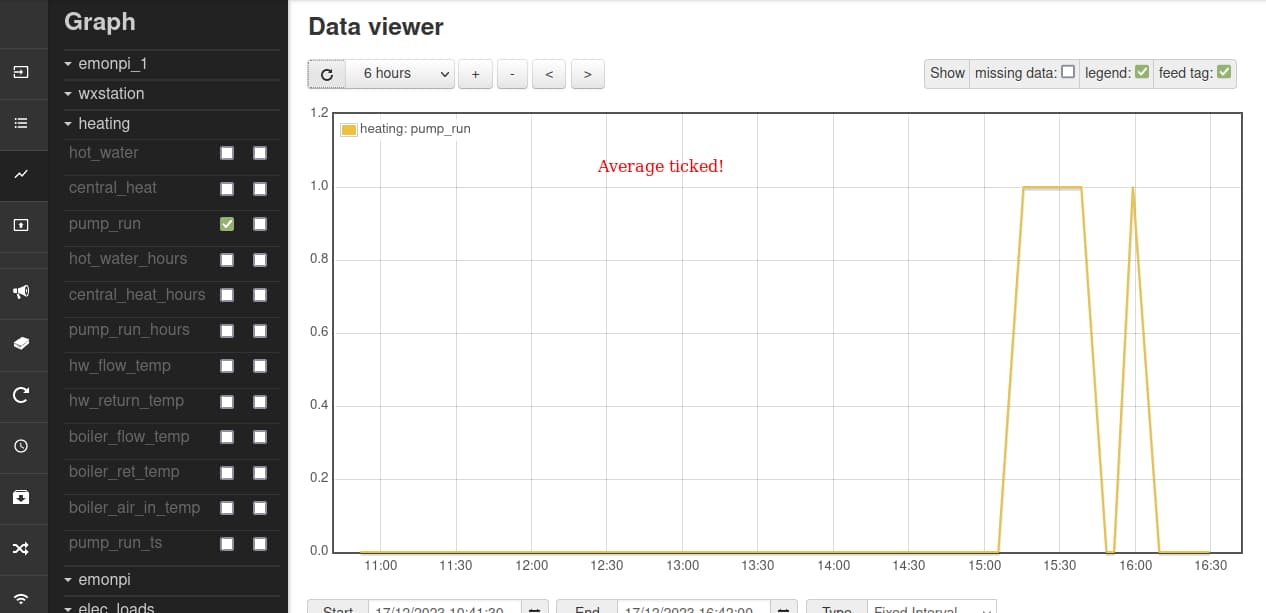
Adding averaging seems to interpolate between the points and does not get what I want! I think the conclusion is it can’t be done in the graph module with PHPTIMESERIES.
I will change the source system to write 0/1 say every 20 seconds, and set up a PHPFINA feed at 20 seconds, although this seems an inefficient way to do it. Perhaps my history of 9.6kbs links and expensive VSAT data is influencing me too much in a world with fast, free WiFi?!
Should we be asking @TrystanLea how the graph software deals with the Variable Interval TimeSeries data, particularly when the intervals between data points approach the horizontal resolution of the graph?
Yes I think an explanation from @TrystanLea would be good! attached shows the valve over the last 12 hours with data logged as PHPFINA (blue) and as PHPTIMESERIES (Brown).
PHPFINA does what I need, although it’s pretty wasteful, although as Tim says storage and bandwidth is cheaper than it was!
In this situation Industrial process historians will typically apply a “Digital” attribute to the feed metadata, this perhaps informs the visulisation layer to display differently? (there is usually also a state table e.g. for a valve 0=Moving, 1=Open,2=Closed,3=Error etc.
In the interests of accuracy, both storage types can be used if you’re sending updates every 20s instead of only when they change. Of the two, PHPFINA is more efficient on space.
Perhaps what is really needed is a new feed type that only records changes, and an API / graph that knows how to present it properly.
I was under the impression that we already have the first - PHP Variable Interval Timeseries. I agree, what appears to be missing is the graph module’s corresponding interpretation for a binary digital input where you can assume the state reported at the conclusion of the previous change is the state entering the present change, and it connects the points and displays the two states unambiguously. I think this would need to be a configuration option, in the hands of the user.
Yes what I really meant is PHPFINA is wasteful at 20 seconds compared to PHPTIMESERIES based on state changes (or a 10 minute maximum period of no samples) that I had before.
I think this is the question - how it is visualized (and how it’s reported by the API when queried), it may be more states than 0/1 but would be an integer.
You could also have an attribute that would mean hold the value (draw horizontal line to the current time) if there are no new values. This could be used for things where the data is sparse, but you know there will be a new point coming e.g. a total written at midnight.
Similar to the graph in the case of PHPTIMESERIES it would be nice to get the actual time-value pairs out the API as an option. I can get close to this by setting a frequency of 10 second and dropping all the Null’s but it’s not the exact time of the sample.
My digitals are zone valve positions, pump statuses and boiler firing on my central heating.
This will soon be expanded to include number of mobile phones in the house (I am assuming no one would leave the house without their phone?!) all these change infrequently.
I see a lot of discussion on heatpumps etc. What does everyone else on here use for valve states and the like?
PHPTIMESERIES should do exactly what you need.
Some changes allong the last years by Trystan broke it by doing averaging where it should have continued to return what is stored only.
This and minor changes to graphs to adapt them to other engines, made the viewing of data in graphics approximations that might not fit schenarios where high precision is needed.
Should be addressed for sure.
Note to everyone: In the later versions of emonCMS, the databases are called Emoncms Fixed Interval TimeSeries and Emoncms Variable Interval TimeSeries.