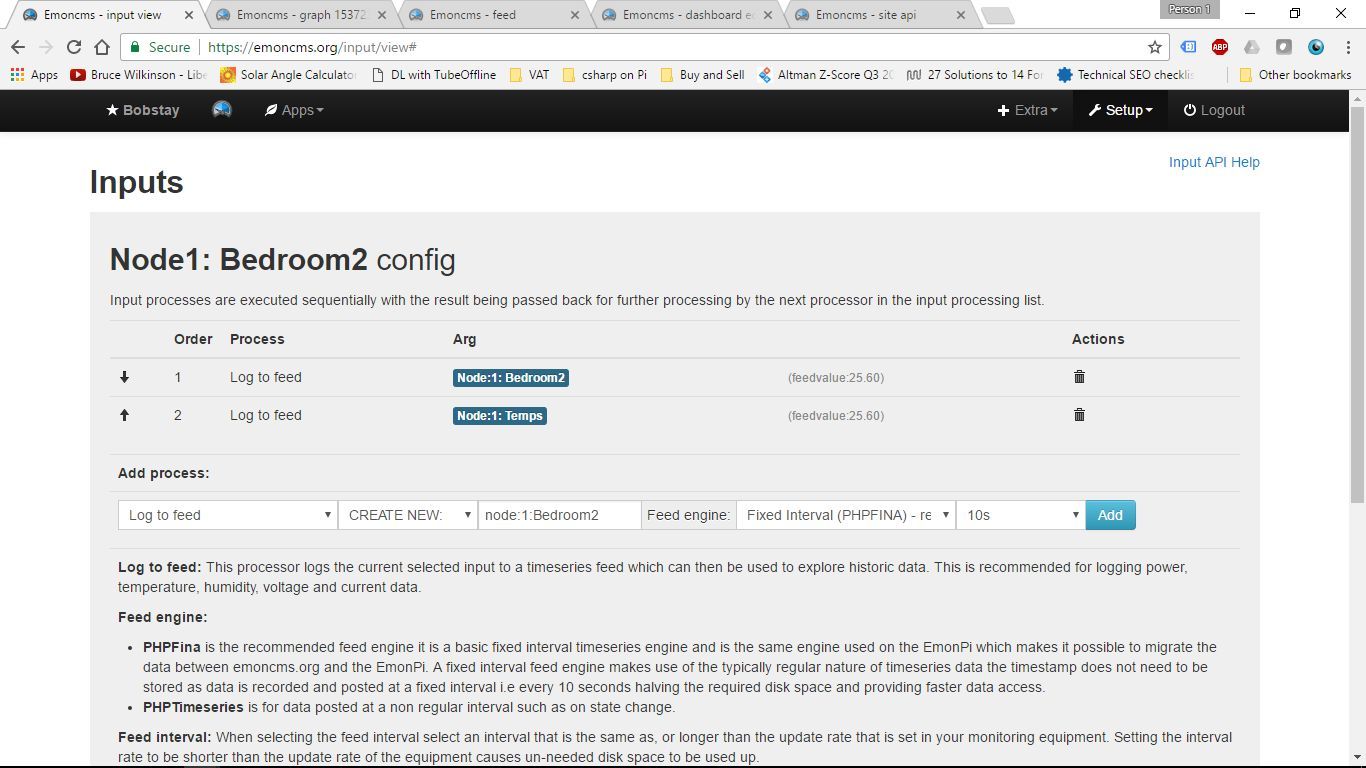
I am trying to monitor 4x temperature probes, which will be installed in different locations. The temperature entries come in every minute.
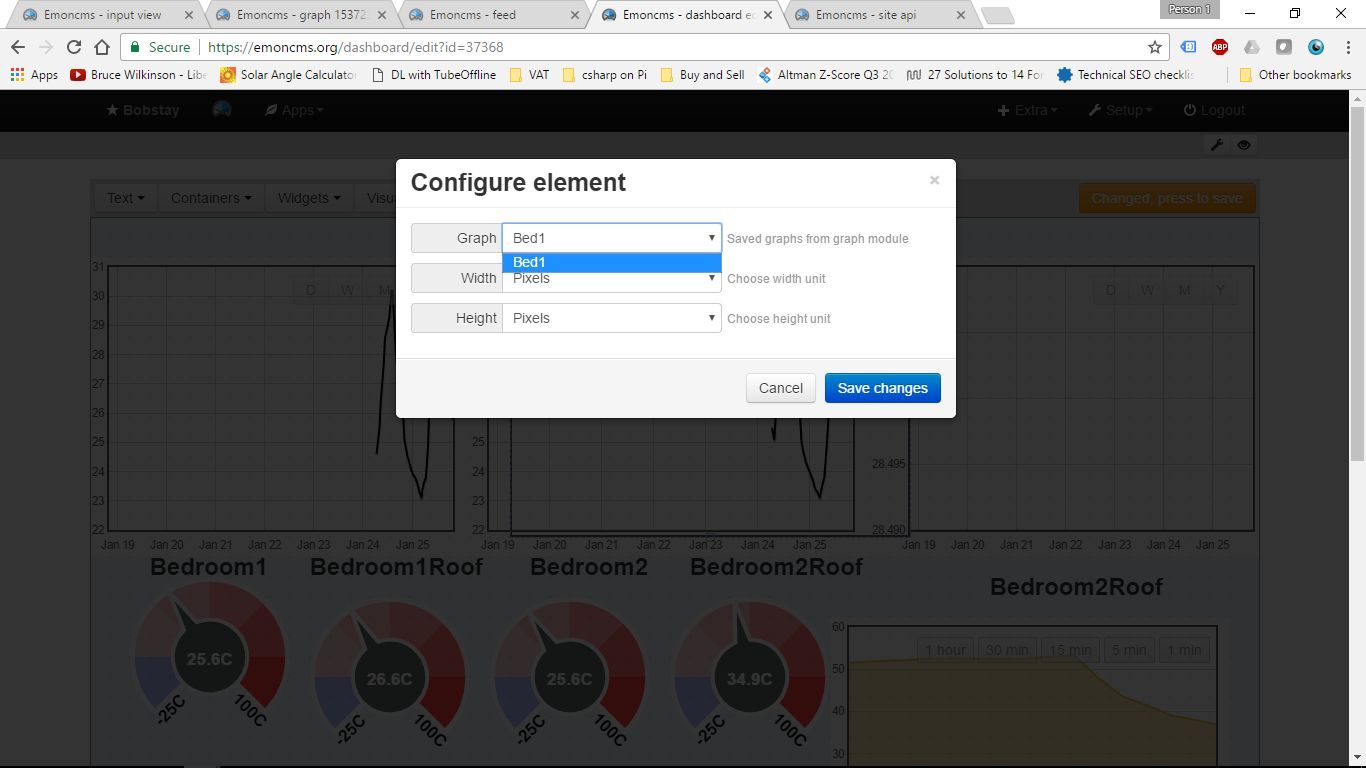
When trying to graph the 4 sensors together on a single graph, only two of them have data.
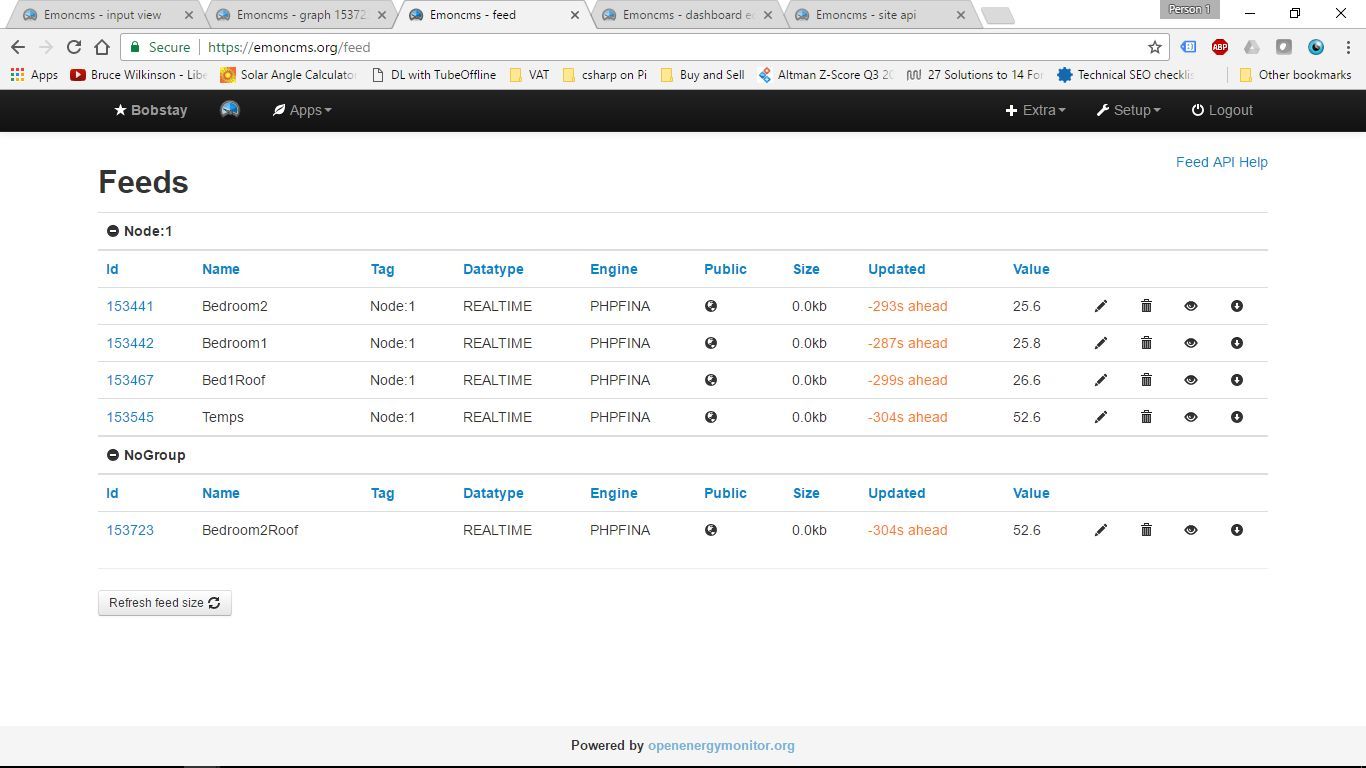
As you can see in the last screenshot, the “Bedroom2Roof” sensor changes the whole time, yet it doesn’t want to work on the graph. In fact, they all change the whole time.
I put it next to my computer fan with the earlier screenshot, with a temperature of 52.6, and then moved it away when it dropped to 37.9 to prove the data is logged correctly.
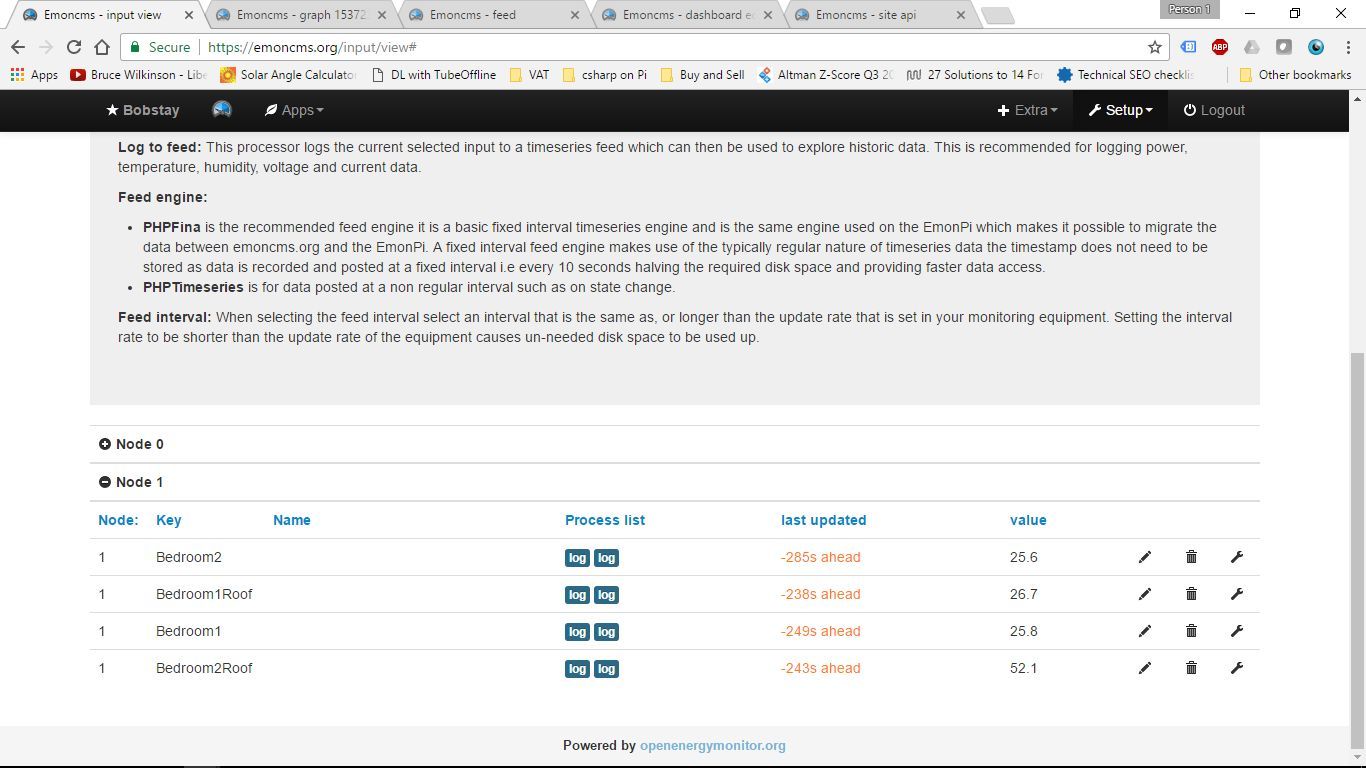
I have 4 temp sensors, named “Bedroom1”, “Bedroom1Roof”, “Bedroom2” and “Bedroom2Roof”.
When trying to add a “graph” visualization to the desktop, these “inputs” are not available. They are set to log, each to it’s own name, as per the attached screenshots.
Why would these inputs not be available as graphs?
You have asked what is basically the same question here also:
Asking the same question twice helps no-one, people will waste time answering one thread when there is already an answer posted elsewhere, and someone finding one thread later will only have half the information. Keeping everything in one place means that everyone can see the full picture.