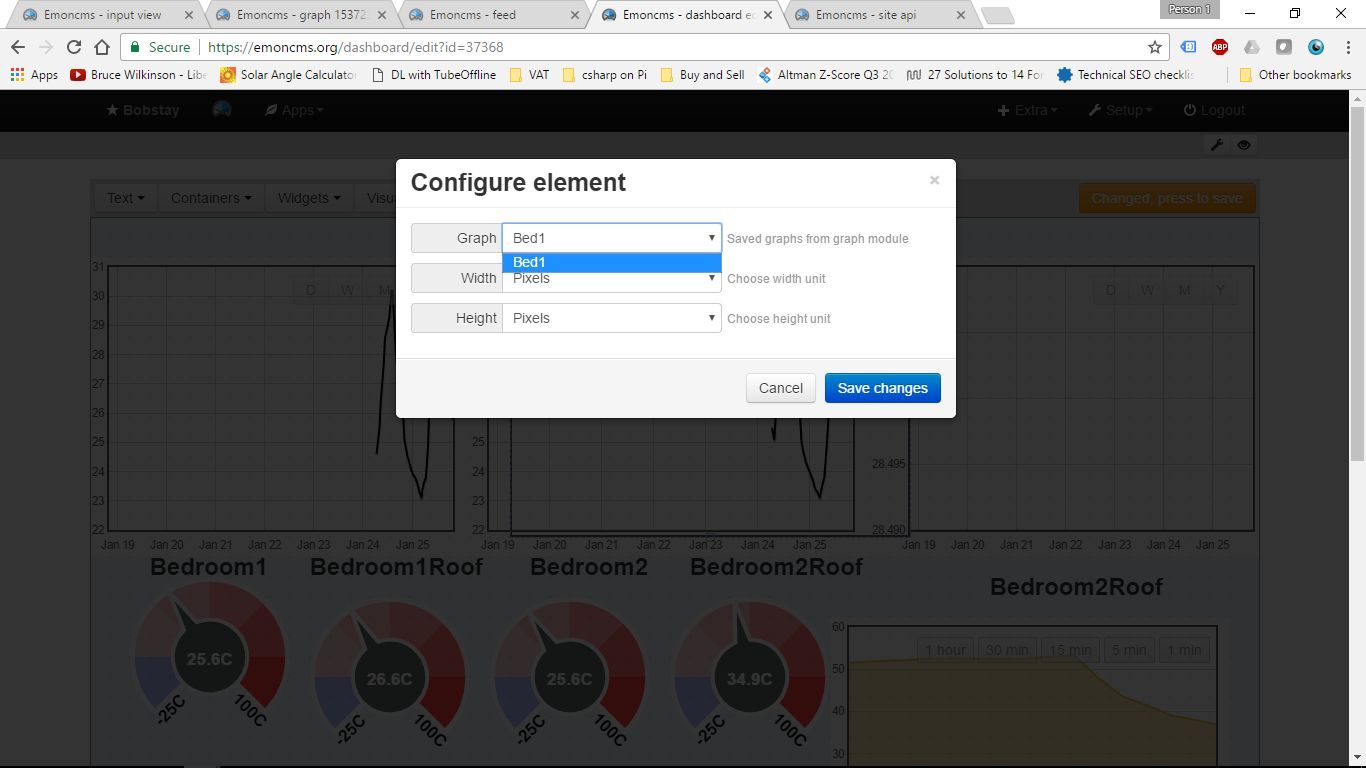
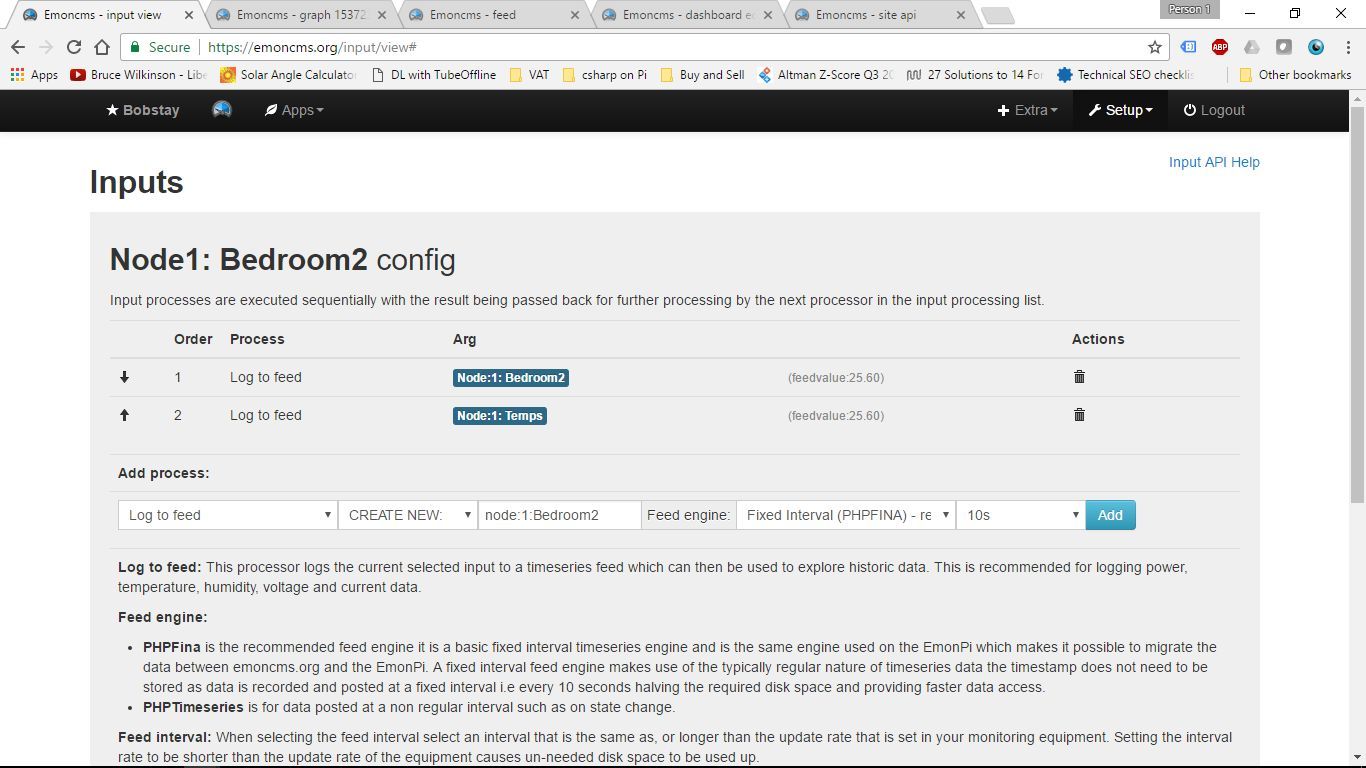
I have 4 temp sensors, named “Bedroom1”, “Bedroom1Roof”, “Bedroom2” and “Bedroom2Roof”.
When trying to add a “graph” visualization to the desktop, these “inputs” are not available. They are set to log, each to it’s own name, as per the attached screenshots.
Why would these inputs not be available as graphs?