Hmm… something has gone awry such that some systems aren’t appearing. Paging @TrystanLea…
I will have a look when I’m at my computer later, if they are not listed it’s likely missing stats rather than the actual system entry as I haven’t touched that.
Apologies, now fixed, the new data loading script was not loading more than the first couple of weeks for your system for some reason, all working now.
@TrystanLea my system has had a wobble and is showing no data, would you mind taking a look when you get a moment please?
I’m not sure if it is related but I had a blip on my power metering a couple of weeks ago and had to re-process the feeds.
Have you updated your emoncms install?
@Timbones thank you for the prompt, I had missed that. Done and now up and running once again.
2 posts were split to a new topic: My Heatpump App - auto-configuration not working
A selfish feature request. ![]()
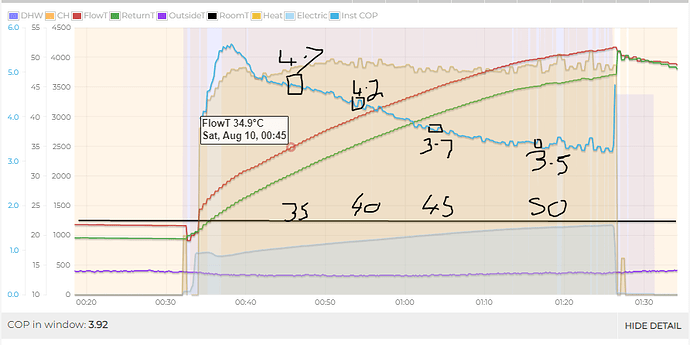
When showing DHW runs. Would it be possible to add the insta COP figures from flow temperatures of 35C, 40C, 45C and 50C?
A bit like this.
I’m writing an Energy Stats blog article at the moment and I’m finding isolating these data points a great way to compare different setups during hot water runs.
I’m having to pull all this info manually!! ![]()
I would also love to somehow expand on this data with some charts etc.
- So we could look at the differences that outside temperature make.
- As well as start % charge (for a Mixergy) or indeed starting cylinder temperature (for a standard cylinder). Which would prove once and for all that starting with a colder tank yields better performance during hot water runs. But it would be interesting to see at with SOC/temperature the real gains come… cos there definitely seems to be a sweet spot at around less than 40% full on my cylinder.
Maybe we need to start collecting % SOC and cylinder temp in the first instance?
Is it already possible to custom design a window size e.g. from midnight to midnight? If so, how? And if not could that be a potentially useful feature for anyone else? I seem to be spending a lot of time trying to line the windows up to see patterns in daily behaviour…
I’m slowly exploring what’s available - being able to filter on type of heat meter is great to see how many others with same type as mine have dodgy data, and I’m sure there’s a lot more to discover yet!
Clicking on a day in the bar chart should show you the power consumed/produced for that day.
Is that what you mean?
Oh yes thankyou, that is just what I wanted. I don’t often go back to the bar chart!
Nice feature request idea @Zarch cant make any promises yet on my end as I have quite a long development back log but if anyone else wants to have a go at implementing this, that would be very welcome!
2 posts were split to a new topic: HeatpumpMonitor: Immersion heater vs. System Boundaries
