I would like to invite you all to take a look at the new heatpumpmonitor.org site that’s in development. We have it over at https://dev.heatpumpmonitor.org at the moment for testing!
First if you are not sure about the new table view, the original is available here as well: https://heatpumpmonitor.org/system/list/original.
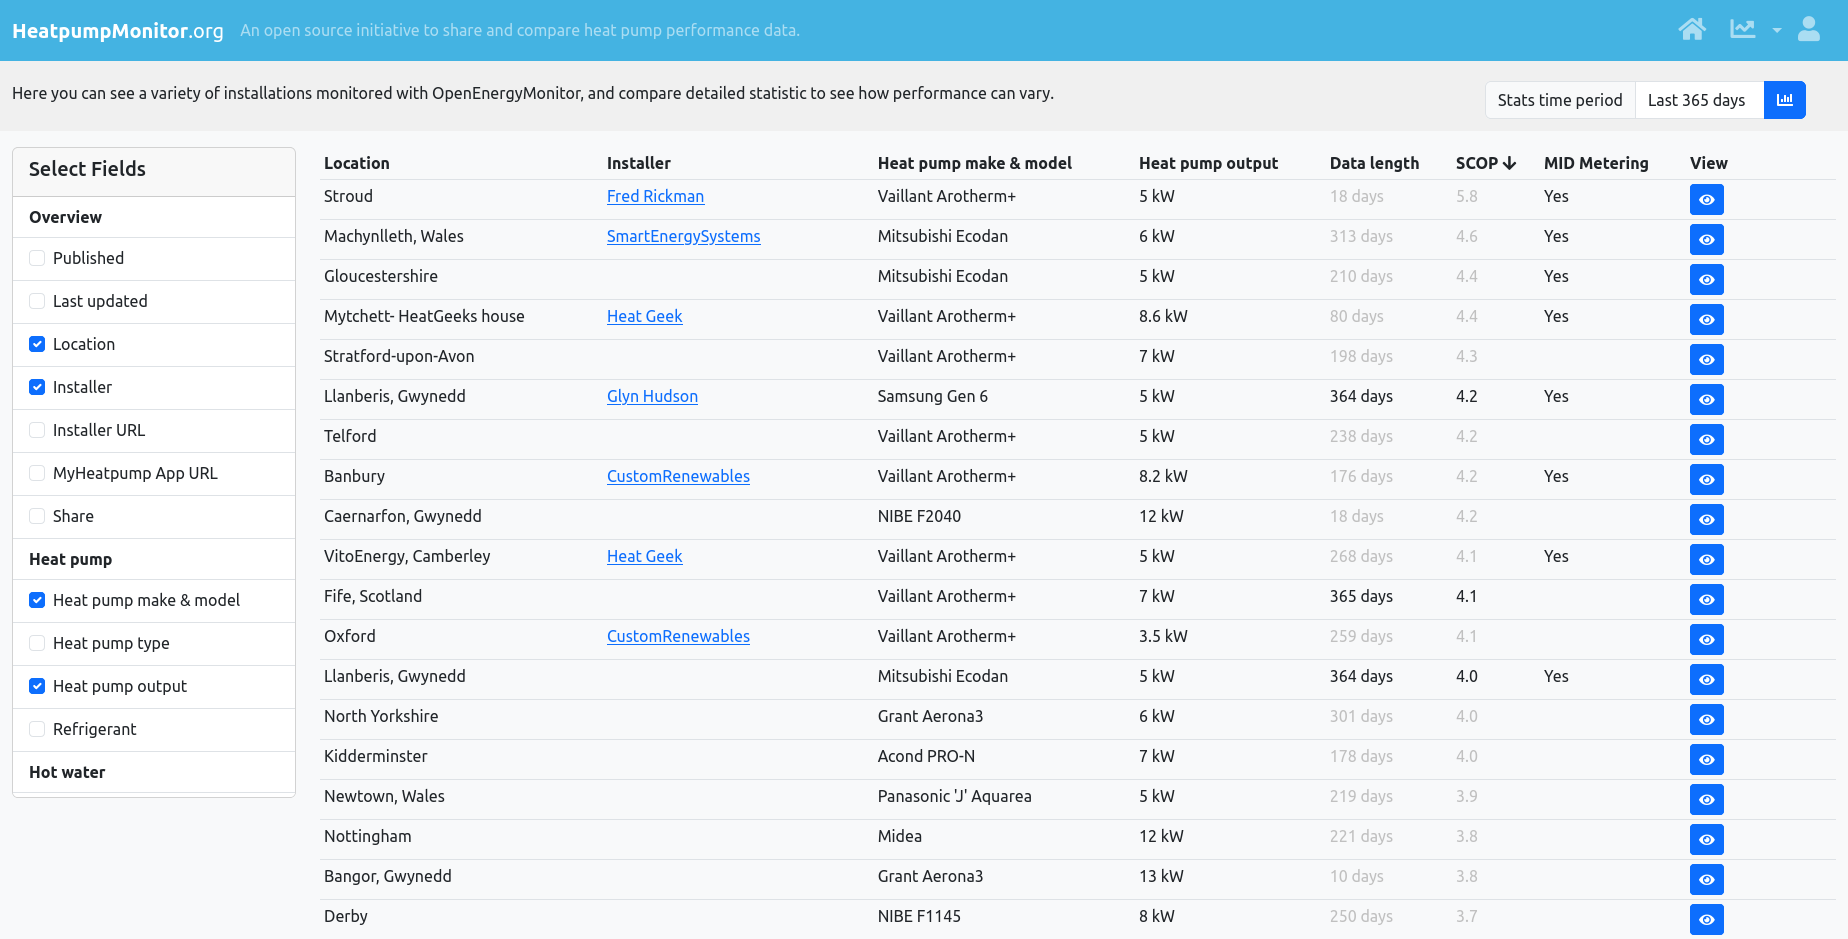
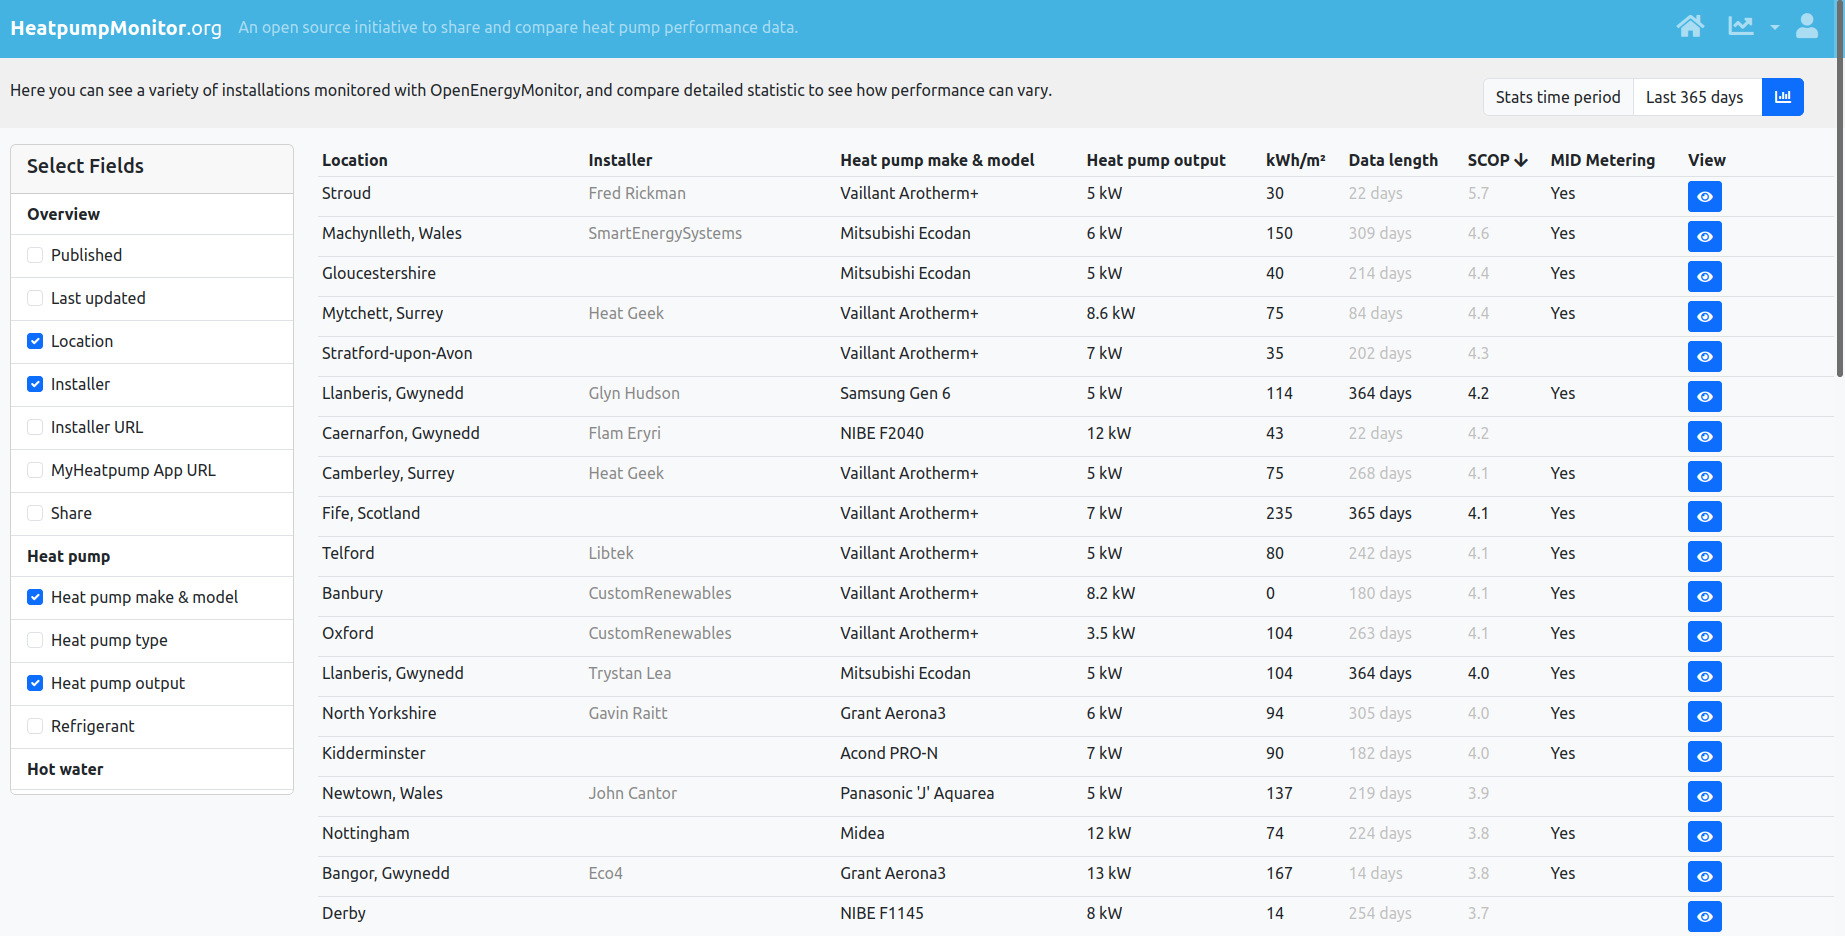
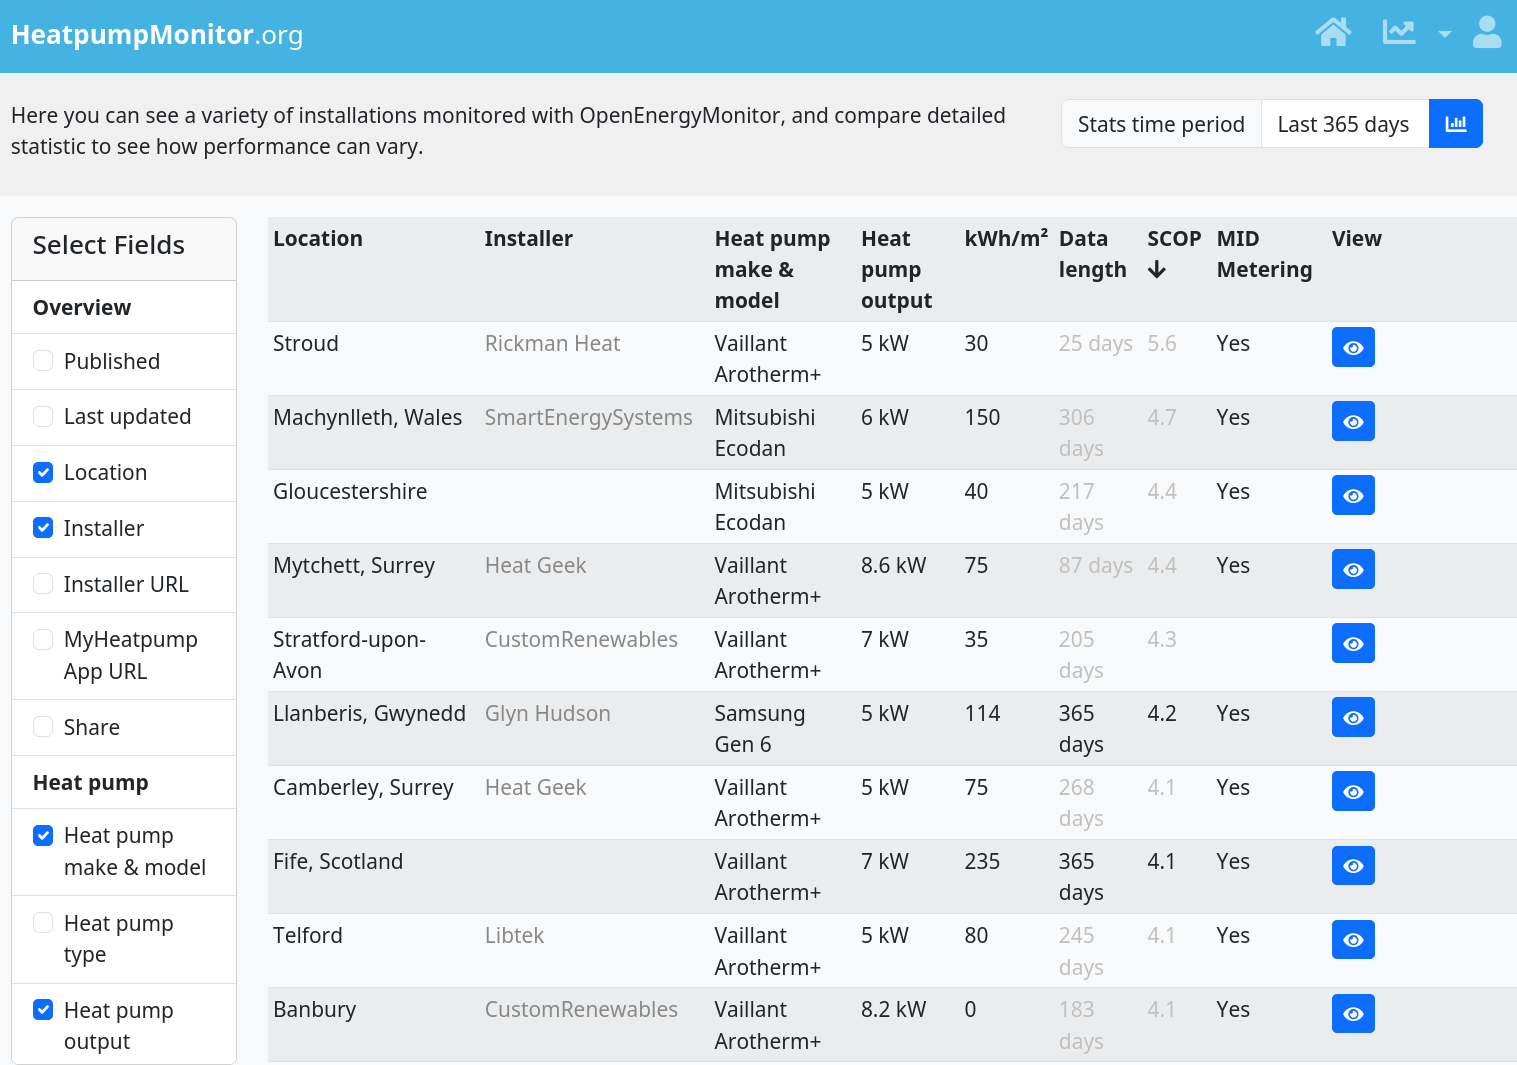
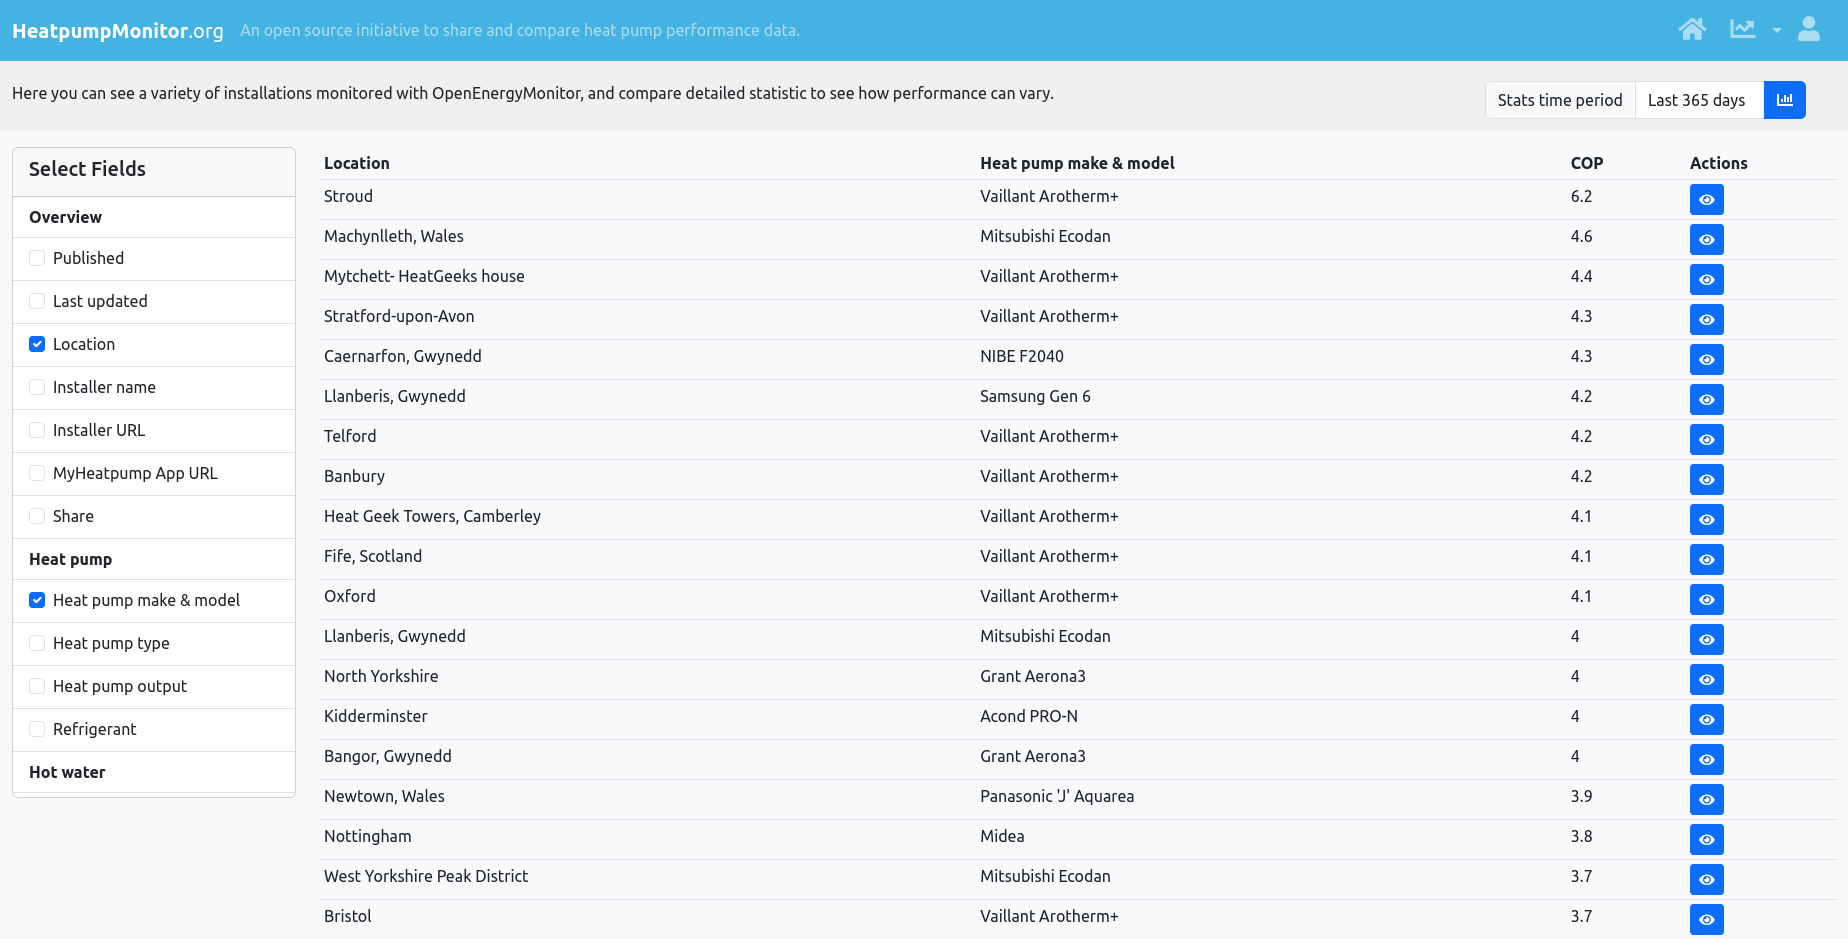
At the moment the home page is again a table view of the systems, but not all of the data fields are shown by default, you can instead select from the left hand side field selector. It’s also possible to select from a range of different stats periods (top-right) including specific months, as well as the last 365 and 30 days:
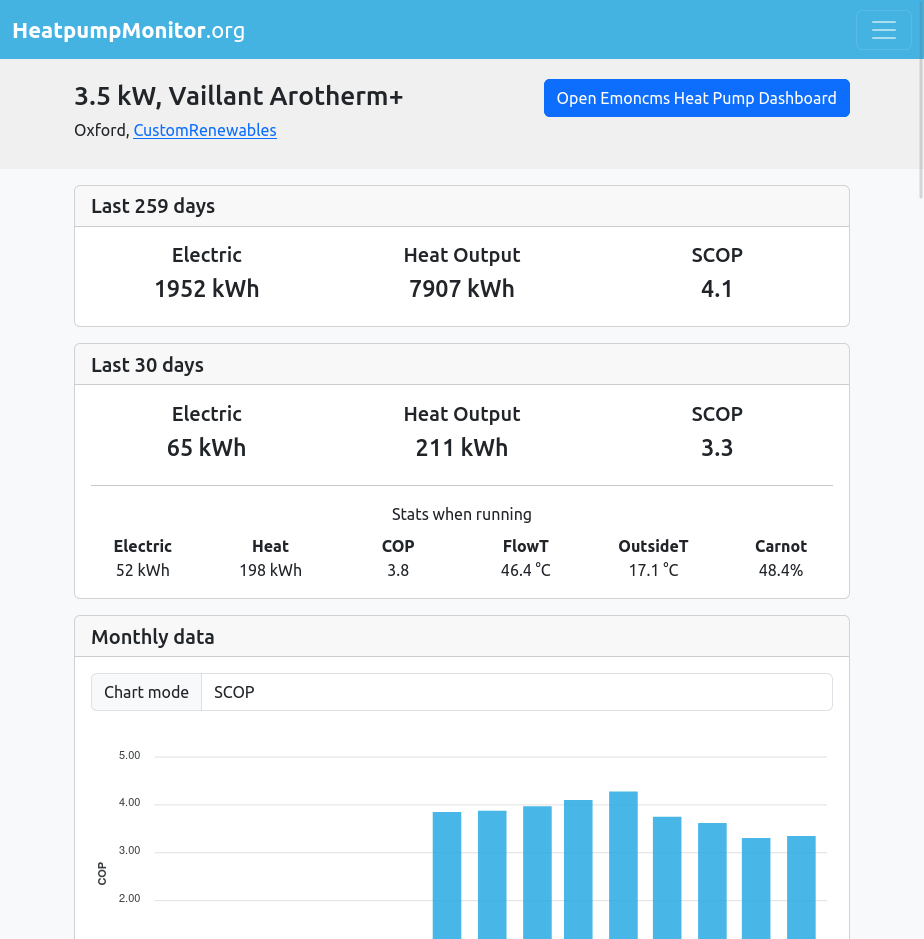
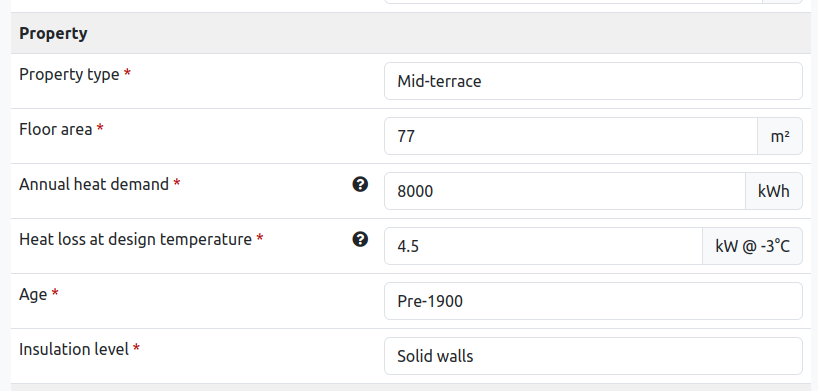
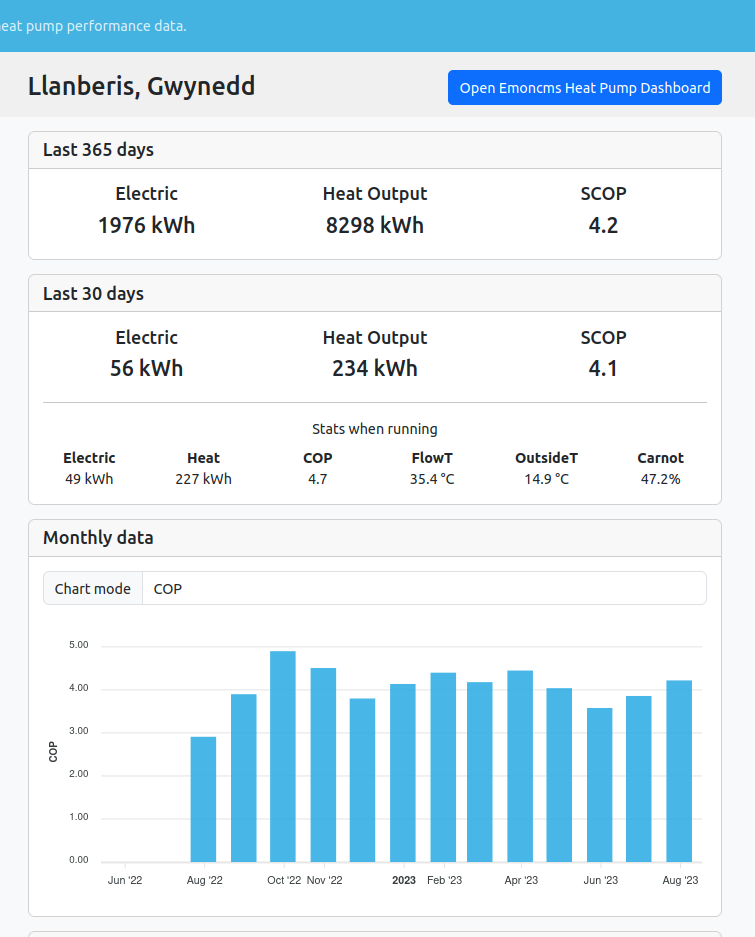
Clicking on the Eye icon opens a in-built dashboard page for the system with both cached stats and form data:
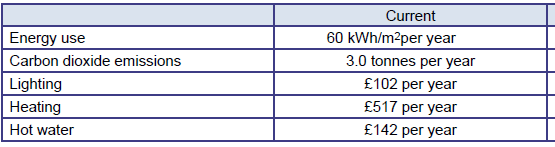
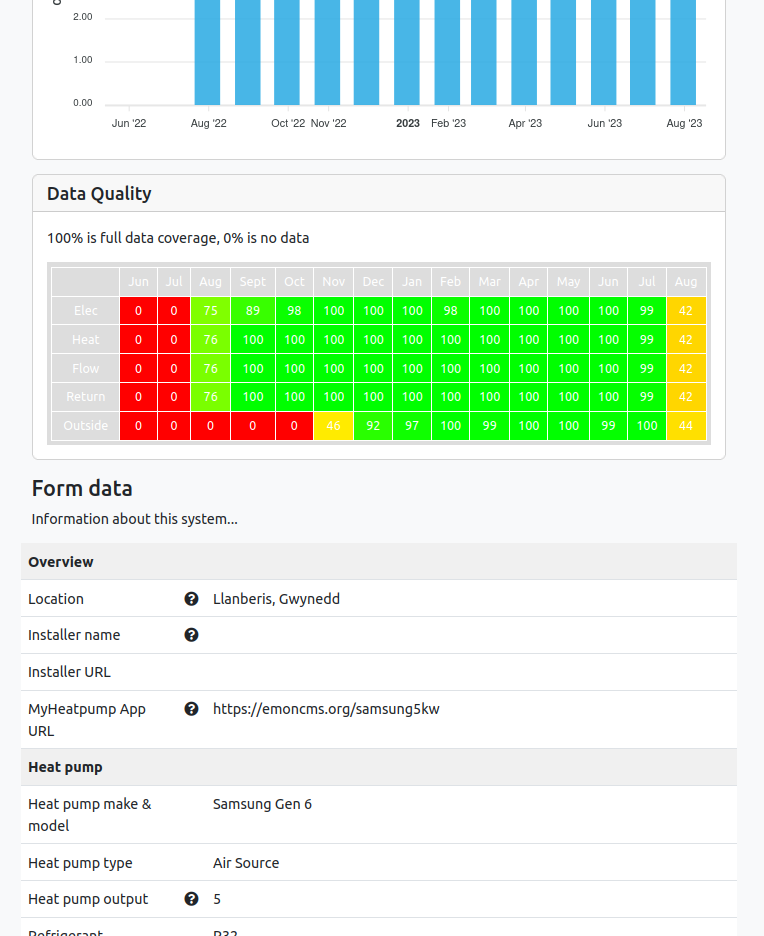
including a data quality table below that:
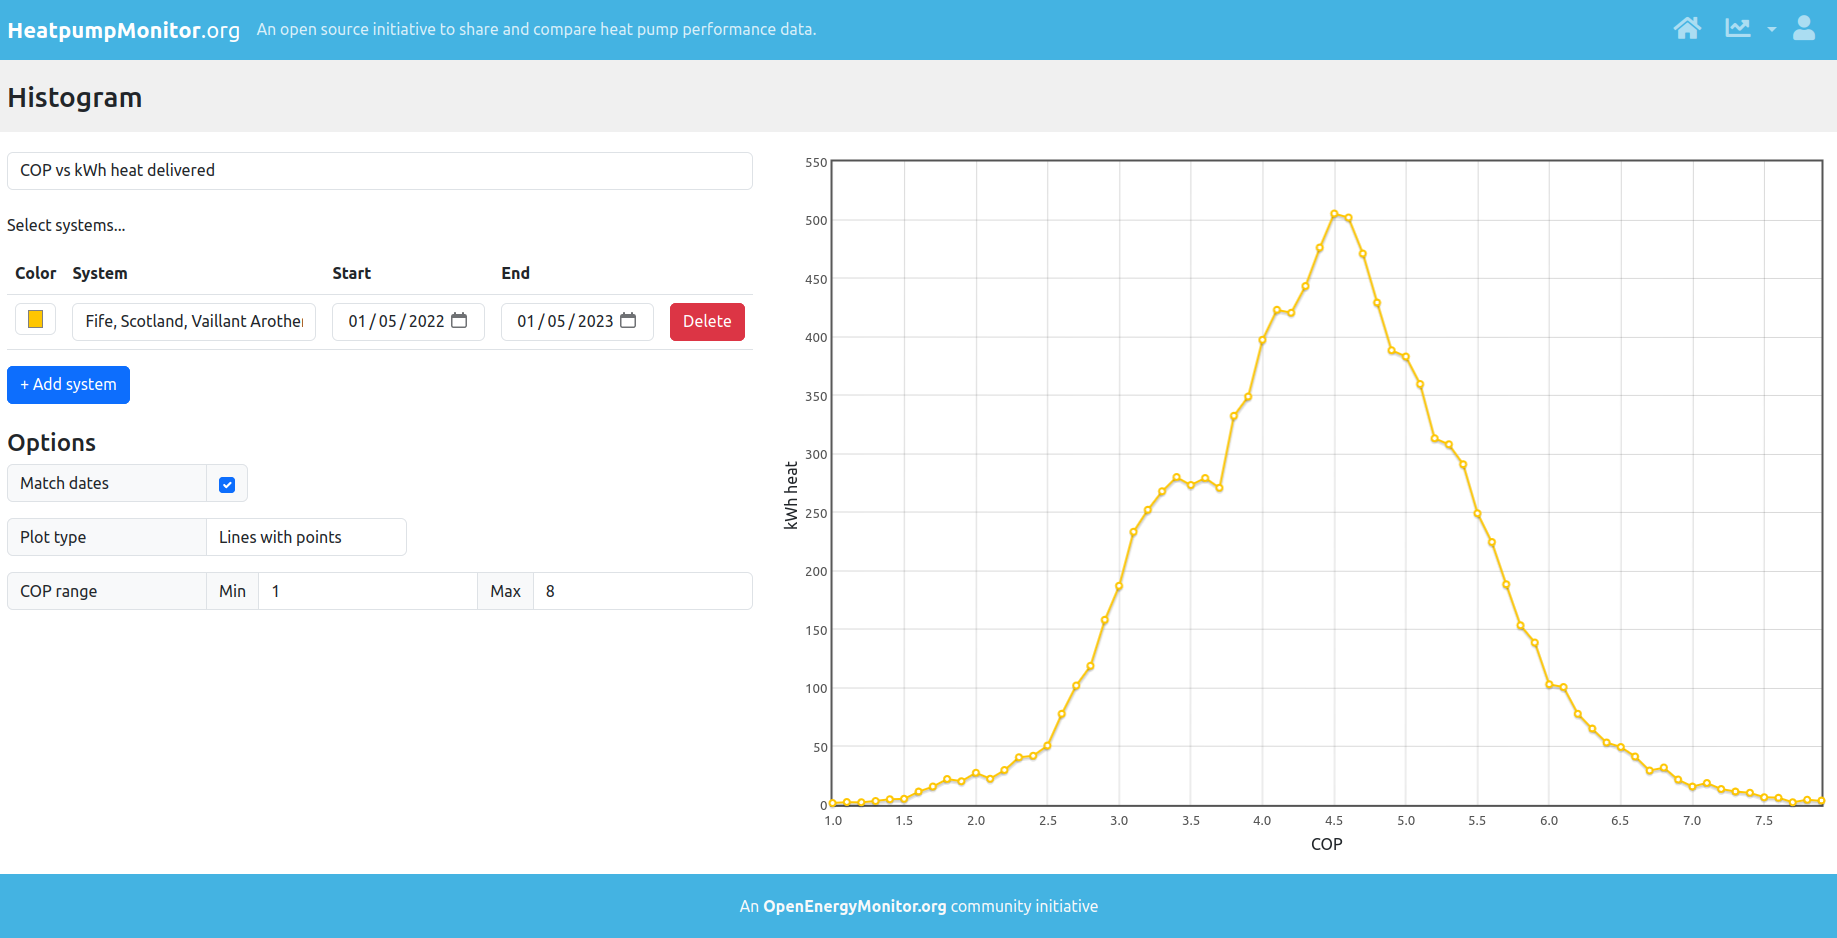
There are a number of new graph tools. The histogram tool is particularly nice, making it easy to explore the distribution of COP’s or flow temperatures seen by the system:
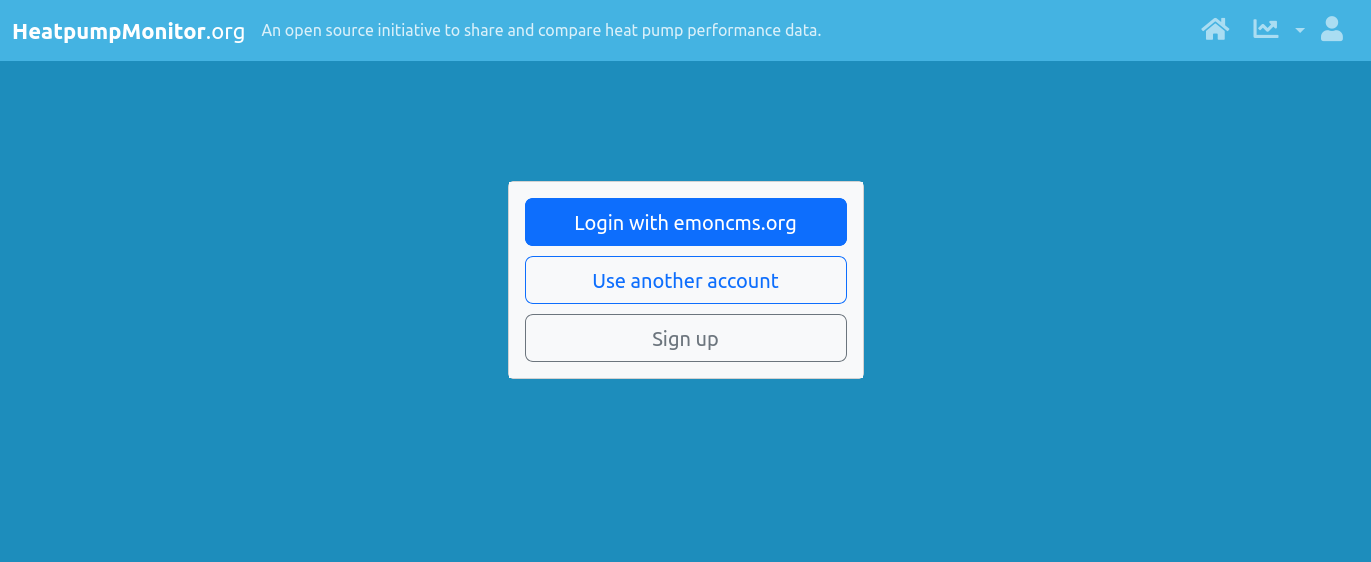
The big difference with the new site is the ability to login and change the form data. If you are sharing data via an existing emoncms.org account, it’s possible to login with the same credentials and your system should be linked automatically.
If you are sharing via self hosted or dataplicity link I need to send you a welcome email with the login credentials. Please send me a private message if you’d like this at this early testing stage.
Once logged in you will see this page, which is a list of systems associated with your account. It’s possible to add and administer multiple systems here.
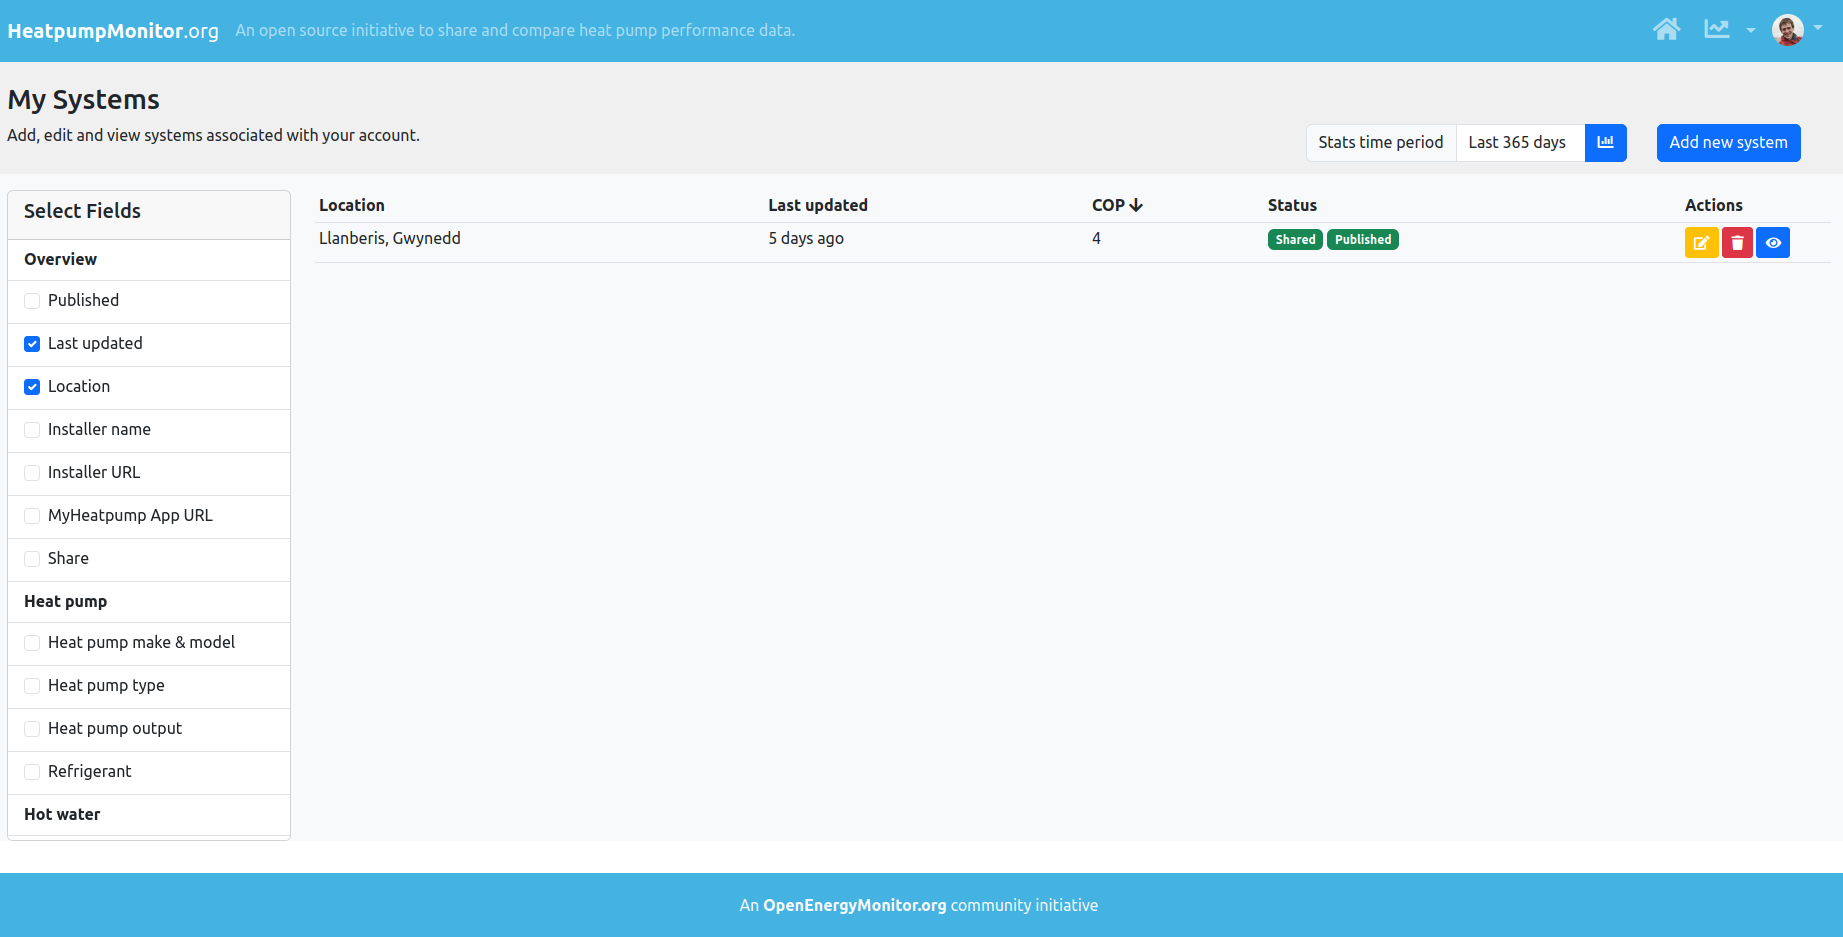
Click on the yellow edit icon to edit your system entry. Changes to the entry are welcome at this stage but may not persist through testing if we have to rebuild the site from the original data on heatpumpmonitor.org.
Comments and lists of issues and bugs welcome!
We are planning to add an overview welcome page so that new visitors aren’t immediately presented with the full table, more to come on that.
Cheers for testing!