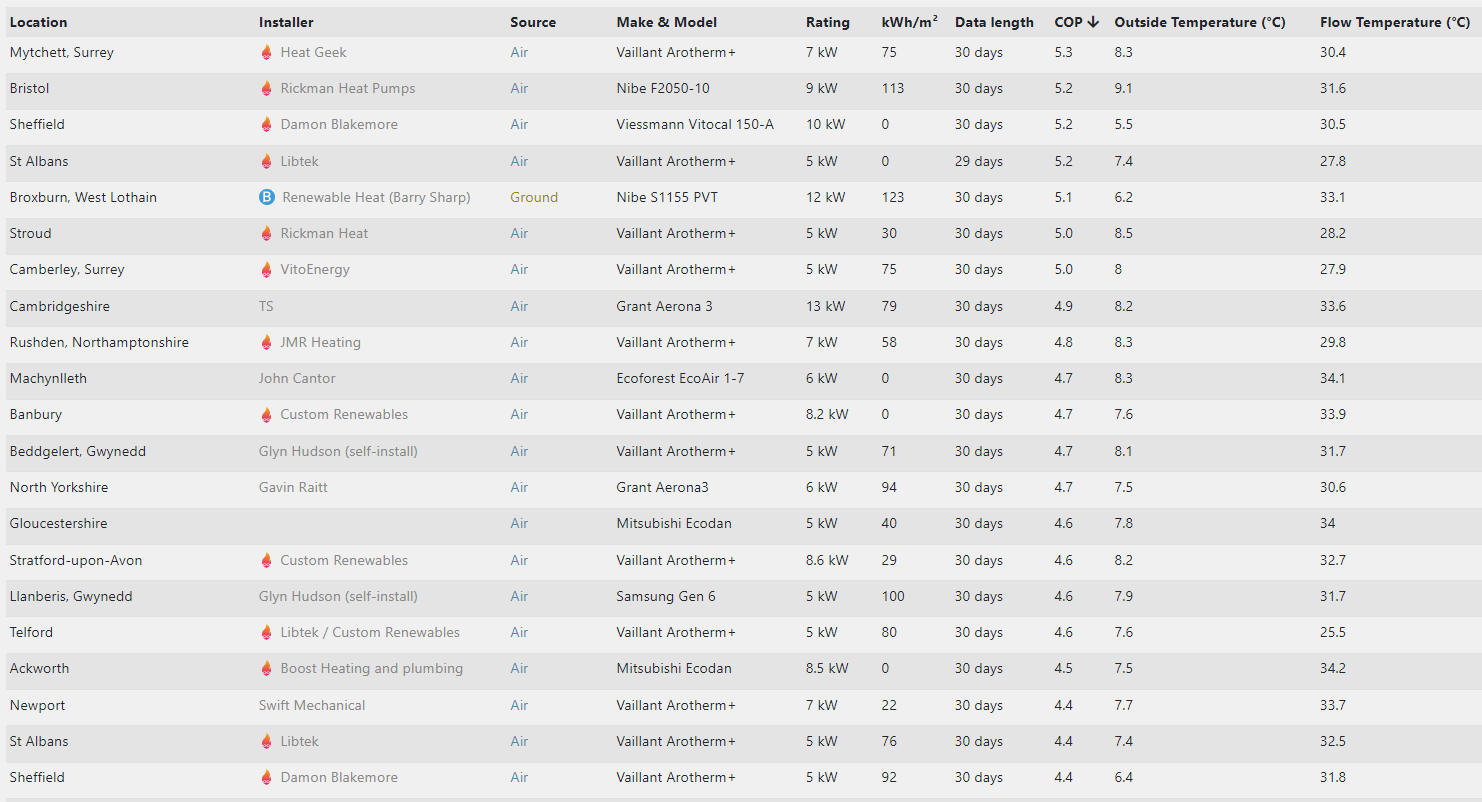
Fully appreciate seeing the outside temp as we do have it virtually tropical here compared to some, however there is also a lot of value in seeing if a system is monitored with MID metering at a glance, especially when looking to compare and for potential troubleshooting system issues (oversized, poor config etc).
While you can compare two similar systems, knowing that the data you are seeing is certified accurate to within 1% rather than manufacturers best guess based on the sensors they could get at the time is also valuable. If I noticed two systems with a 4.3 SCOP one with MID and one without I would be more inclined to trust the data from the former.
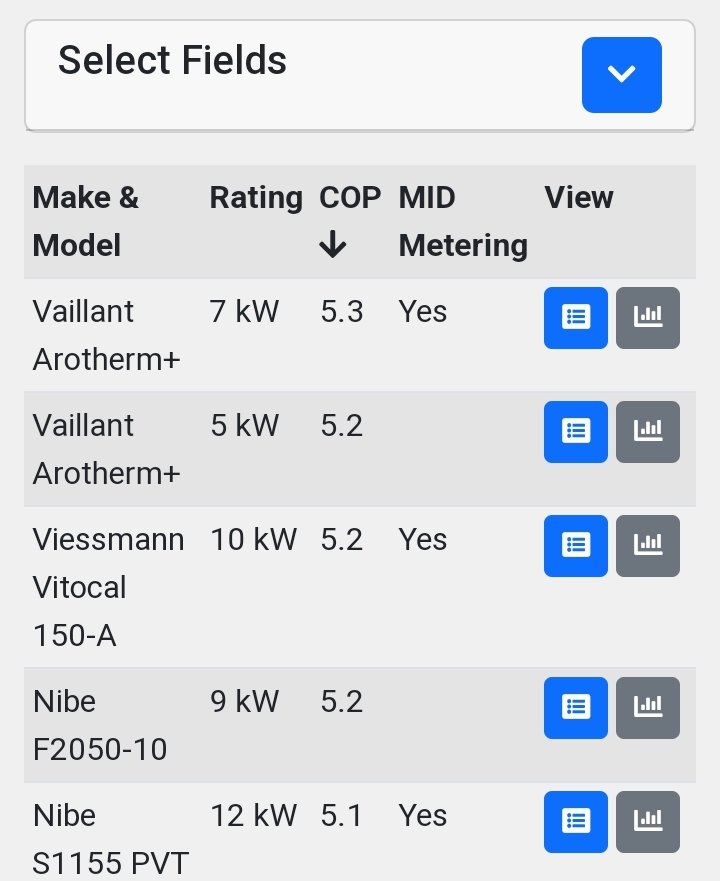
Maybe this could be shortened to MID and yes / no or a checkbox if you wanted to make room for another field?
Thanks, I did see the check box but the original comment with pic was based on the heatpumpmonitor page and maybe changing the defaults (just stating why I liked the MID in the default view for that page)
Fully get that it cannot be default on my 6" mobile screen unless I suddenly get a 16K phone screen and SuperHD vision or a neural implant
You can change the columns but two things
a) when you press refresh you lose your columns and it resets back to default columns
b) the question was what columns deserve to be on that default view? ie the best columns that give you the best picture of why heat pumps are where they are in the chart. If that makes sense?
Personally the MID column is the most important one of all.
Without making any judgement anything that isn’t MID metered is unreliable, they may be accurate and they may not be, you never know.
I do know that some data is being manipulated to compensate for perceived errors in the internal data from the heat pump on some installations. As this is possible it automatically makes the data unverifiable.
For the list to be of any use we really need to know which ones are being measured accurately.
We’re getting to the number of submissions (99!) where we maybe should have a MID filter option at the top that will only show systems with accurate data.
something that I think would help with interaction between discussions on this forum, and the heatpumpmonitor data.
Often we have discussions along the lines of “my system does this, your system does that, other system does the other”, and it really helps to be able to look at the stats for system in question to inform yourself. But it is impossible to remember who lives where (given that they are only indexed and described in the heatpumpmonitor.org selectors by location name) , and frankly I although I’m sure we’re for the most part all very happy with where we all live, I am not particularly keen to know or remember who lives where!
the other option to go back in the threads to where a person posts a specific link to their own system is time consuming and tedious. As the table grows this gets harder.
I’d suggest adding either a “signature” on posts, or a quickly/easily visible attribute of the users profile, with a link to the heatpumpmonitor system belonging to that person. that takes care of the forward lookup.
The reverse lookup would also be useful: on heatpumpmonitor.org suggest to add an attribute to the table of “forum username”, and also put this attribute in the descriptor visible in Compare. So that in Compare, I can compare “Ian” with “Glyn” rather than “Milton Keynes” with “Llanberis”.
I’d suggest also that the compare drop-down also needs to be filterable by system type and size as part of choosing from the list - one is more likely to want to compare amongst similar, although not always of course.
It’s already there - you just need to visit your ‘Preferences’: Click your icon top right, and again on the ‘Head & Shoulders’ icon in the drop-down list. Click ‘Preferences’ then ‘Profile’ in the header, and type in the “About me” box. Scroll down and Save when you’re done.
To see yours (or anybody else’s), click your(their) icon in the relevant post, or (almost) anywhere it appears.
You can add your county, town or whatever you’re happy to make public to your ‘Location’ or wherever, if you wish. ‘Country’ is especially useful because it gives us a good idea of the electricity system you’re likely to have.
The other metric I think that makes a massive difference is internal temp.
Outside temp, inside temp and % of hot water / space heating are the three biggest swing metrics imho. So indirectly, flow temp when running.
I know I can never get much higher than where I am on the charts because I have a high water demand (25%), I like to heat to 20C internally and Sheffield has been one of the coldest parts of the country this last 30 days.
Someone ‘down south’ in warmer parts who likes it 19C inside and only does a hot water run every 2 days is always going to beat me.
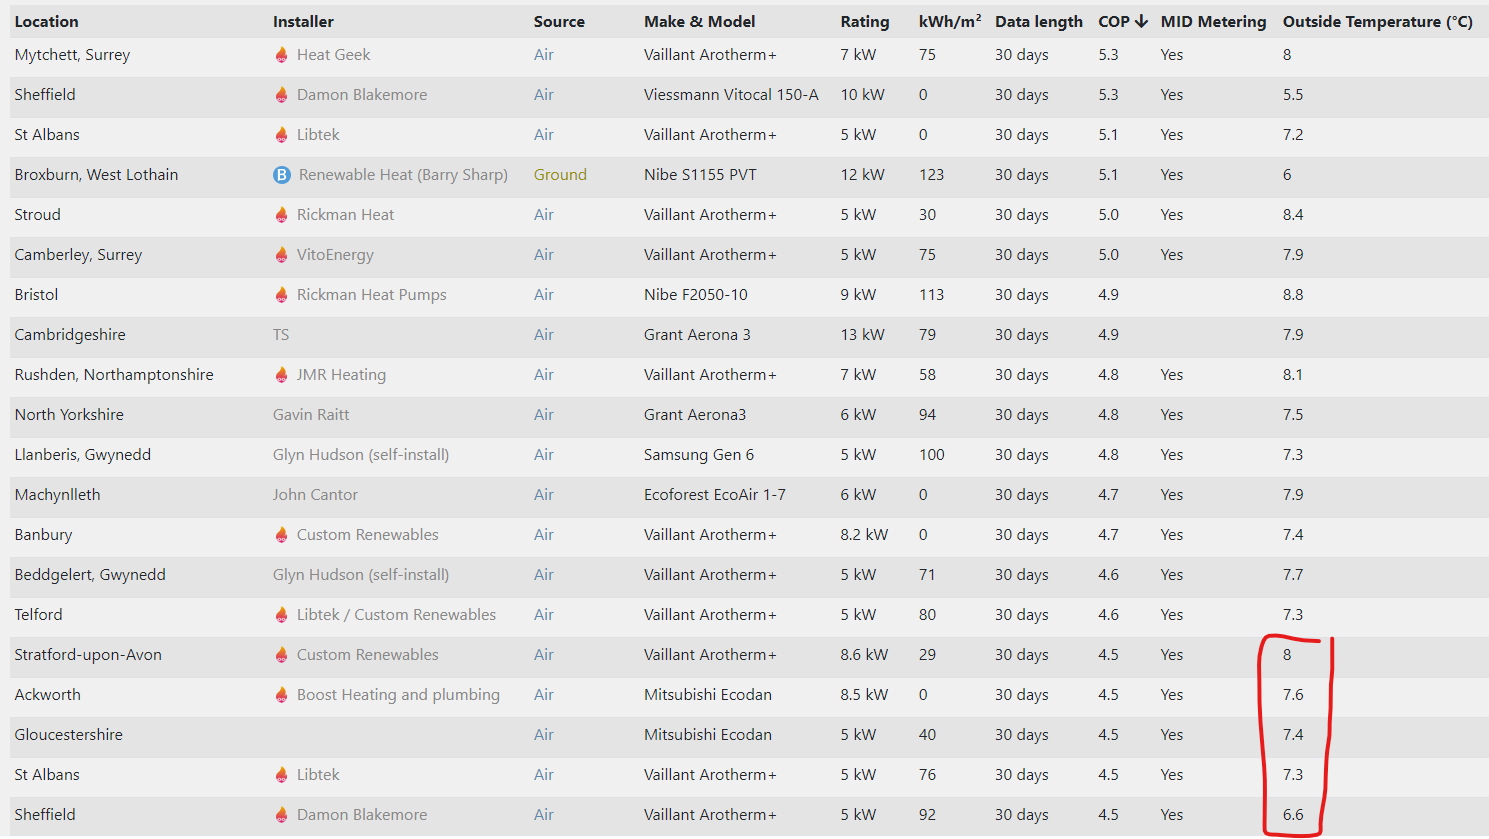
Is it possible to have different default sort orders for columns?
For example:
If I add outside temp column and then sort by COP (high to low), outside temp also sorts high to low.
Which dumps me at the bottom of the 4.5 COP, despite me having the coldest temp?
Surely colder outside temp and better COP should be rewarded??
When I asked why does it matter, what I really meant was I didn’t realise it was a competition.
You could argue that somebody like you who lives somewhere colder than somebody with a COP of 5.0 should be higher up the rankings because they have done a better job based on all relevant factors.
I wouldn’t think any more or any less of you or your heat pump if you were higher up the chart than the others on the same rounded COP.
It is clear that your Vaillant heat pump in your house has done as well as others in a warmer climate.
Do we need to know any more?
If the table is sorted by COP then it probably needs to be done to more than one decimal place although it probably doesn’t need to be shown.
The biggest variable when attempting to compare my own system performance (in isolation or against other systems) from one day to the next is dhw vs heating energy.
Being able to specifically focus the top level chart on either just dhw or just space heating would make comparisons much simpler and more relevant.