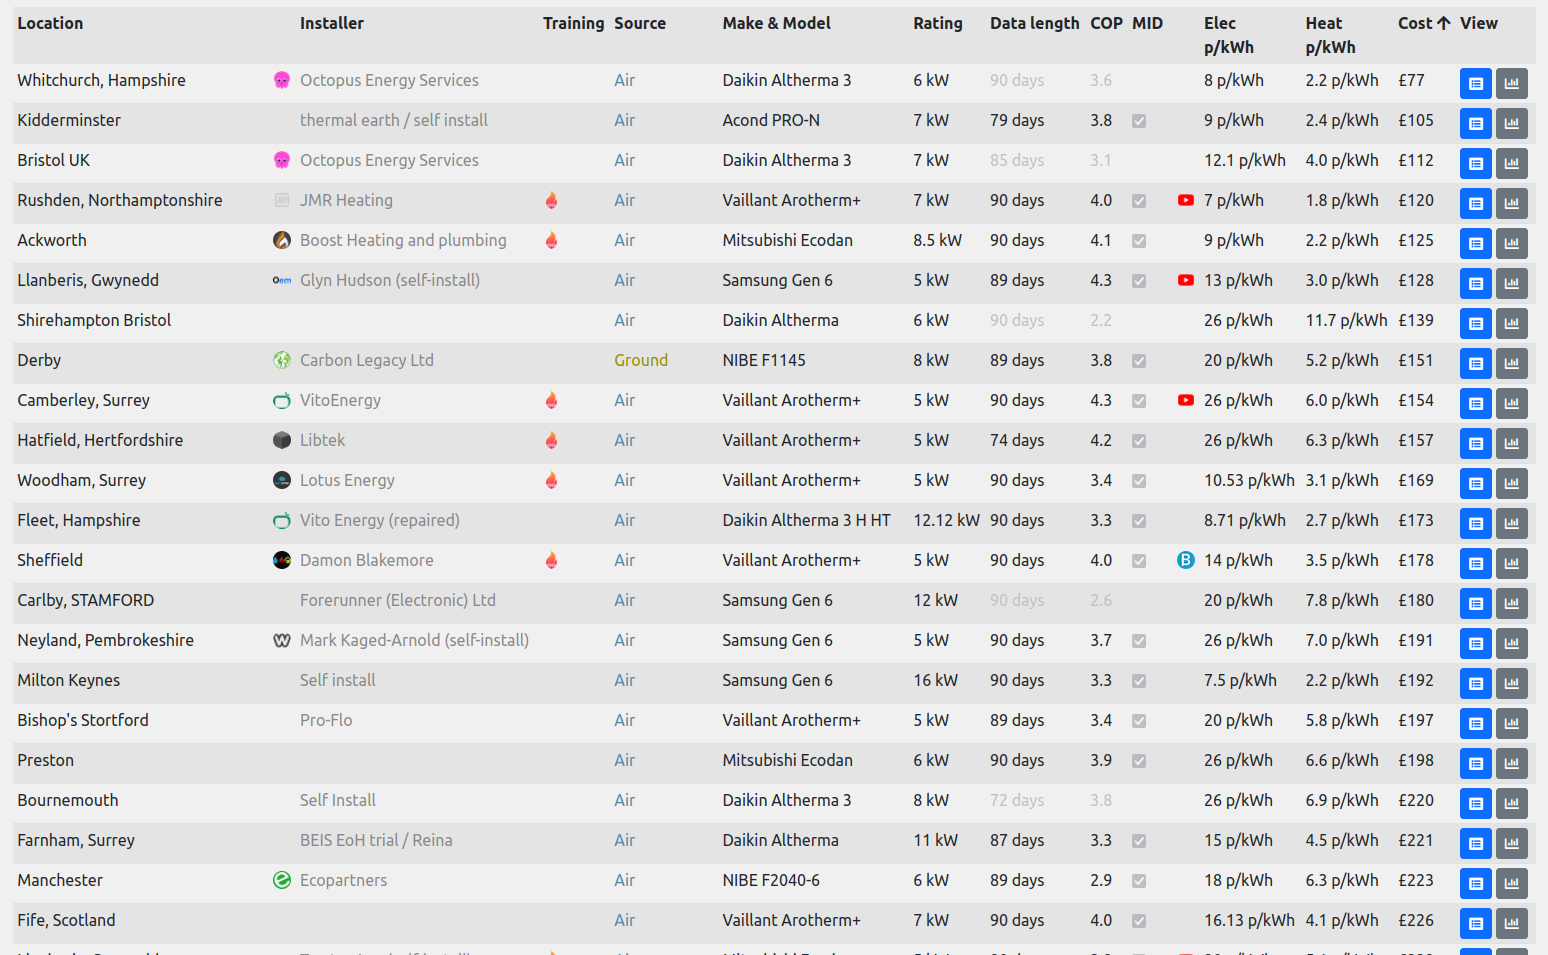
I’ve published the latest version of the site to the main (non development url).
I’ve made some minor changes to the columns visible on mobile so that the training and learn more icons are also shown. Sizing that page also shows/hides the relevant columns.
The resizing, showing/hiding of columns and fields sidebar is still a bit crude and needs more work. I haven’t quite worked out how to get this to work as well as I’d like so will be doing more work on this.
I think the best next step is to make available computed fields such as kWh/m2 electric and cost and then try and work out a nice layout with tabs to switch between different views e.g: ‘top of the scops’, ‘heatpump + fabric’ & ‘cost’.
My Heating / DHW feed comes from MelCloud so I had it working for quite a while until Mitsubishi started blocking requests made too quickly a couple of weeks ago.
There would then be a gap in this feed until I got it working again with a 5min update time.
Trystan,
As you may be aware, there is an initiative under way to expand the FAQ page to cover heat pumps in general (not just monitoring add-ons/programming as at present).
This might usefully include a list of (e.g. non-HeatGeek) “good” installers/hardware.
Could the heatpumpmonitor database be expanded to include a star rating system for 1) installer performance, 2) hardware user-friendliness, 3) performance versus manufacturers’ claims, 4) economics, 5) etc?
I realise that this may not be retrospective, but I sense that potential HP purchasers might value the experiences of others (good and not-so-good), even if the foregoing tests had to be distilled into a single extra column.
Hello @SarahH, thankyou for your thoughts on this.
For installer performance, I assume this would be a rating in terms of how the customer perceives the professionalism and quality of the work undertaken by the installer? A measure beyond the actual performance of the system in terms of SCOPs , running cost etc?
Performance versus manufacturers’ claims, there’s an opportunity to create make/model summary pages on heatpumpmonitor.org with some automated generation of in-use real world datasheet values. With a bit of work this could be compared with manufacturer data, It’s not an easy one to do well but it would be great if we could pull this off.
Economics: do you mean here running costs or capital costs or both?
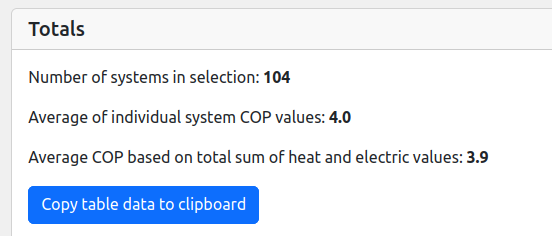
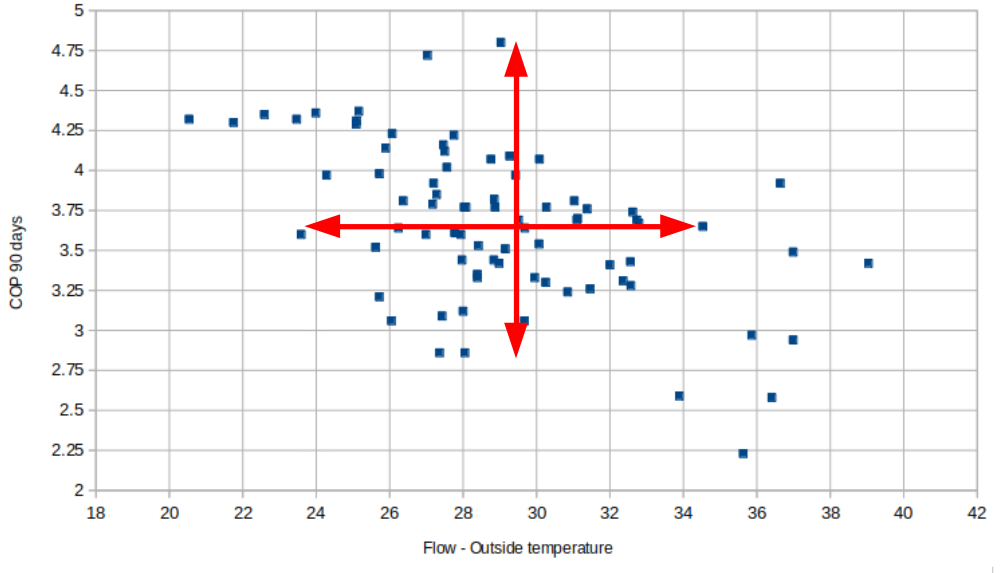
while there is a general trend of higher performance from lower flow - outside temperatures, it’s interesting how much of a spread there is for some of the systems. E.g on the vertical arrow at a DT28 there’s a system getting 2.8 and another getting 4.8! Or on the horizontal a COP of 3.6 with DT24 through to DT34…
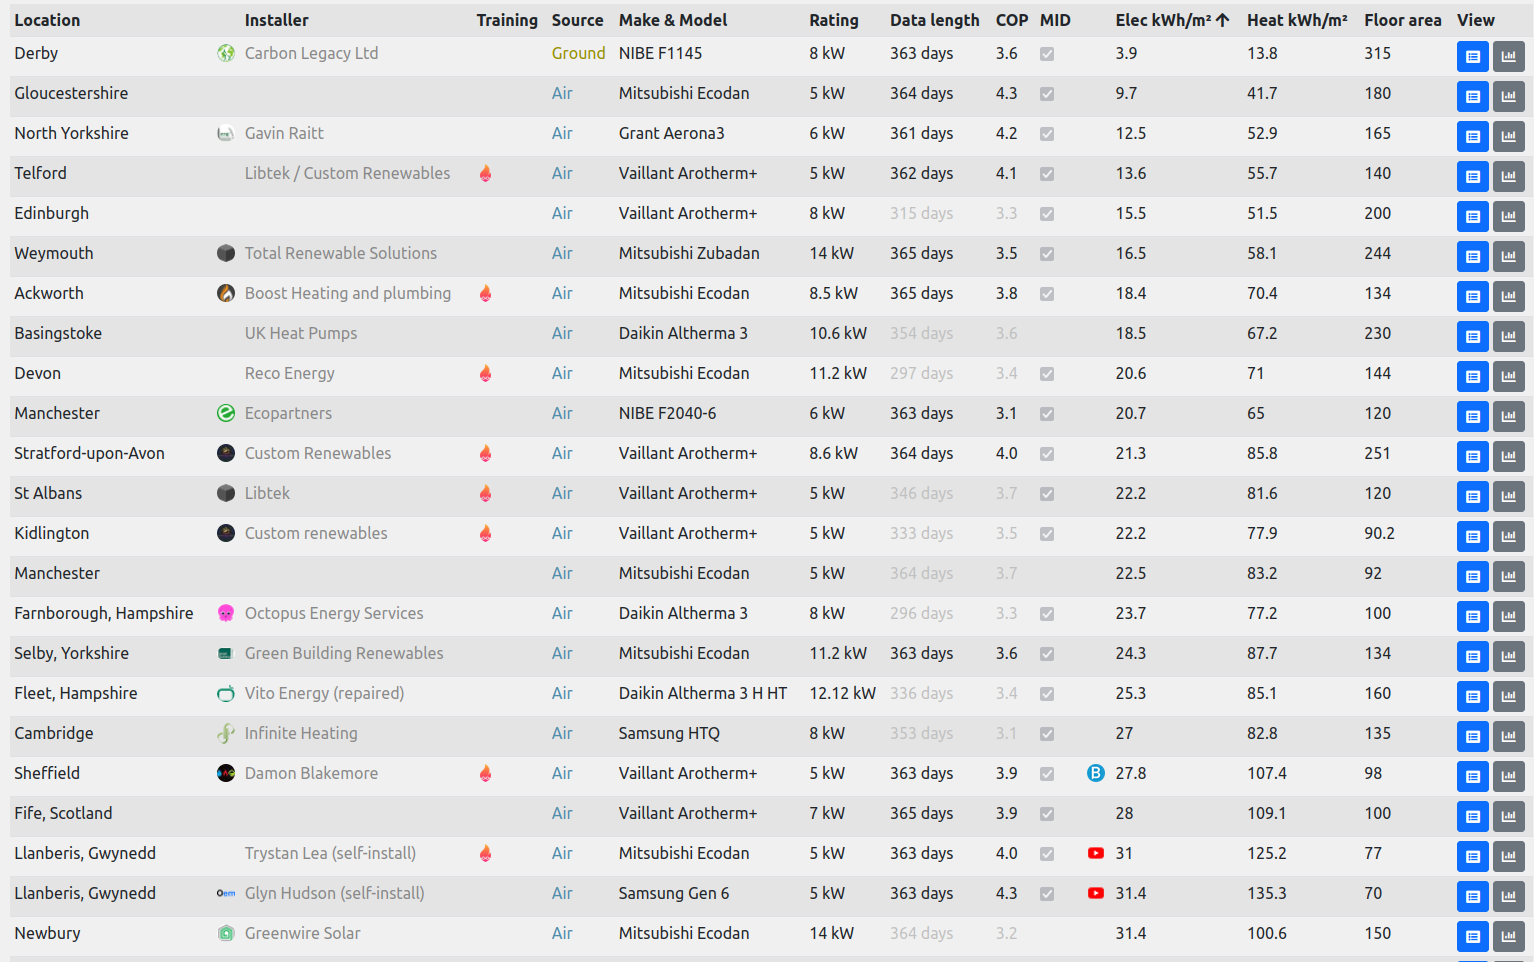
Can you share how exactly are those two measurements calculated? Is that just the total electric / heat energy over the last year divided by floor area?
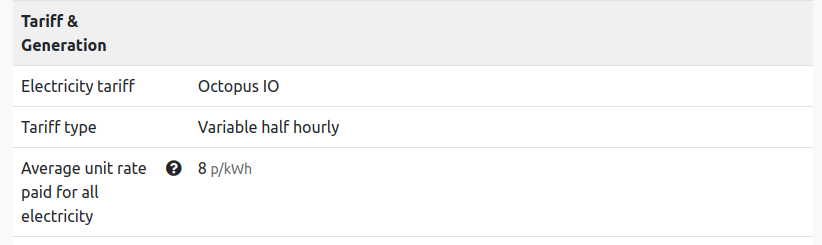
These are currently calculated based on the value entered in the average unit rate paid for all electricity field. I appreciate there are quite a few issues with this input, e.g it will quickly become out of date, it will likely not include cost of enabling technologies e.g battery storage. With that caveat in mind, it’s at least an initial implementation of what this could look like.
I’m not convinced the last 365 days have been properly representative of the design conditions (i.e. it’s been a warm winter) but it’s pleasing result - especially since my house runs at 21C rather than the 20C assumed for Passivhaus certification.
Completely agree we ought to be consistent about that.
I note that my EPC quotes “Total Floor Area” (as opposed to the Passivhaus “Treated Floor Area” - which isn’t confusing at all ! ) and an EPC follows the SAP methodology, where SAP says things like:
Dimensions refer to the inner surfaces of the elements bounding the dwelling. Thus floor dimensions are obtained by measuring between the inner surfaces of the external or party walls, disregarding the presence of any internal walls.
and
Floor area should be measured as the actual floor area, i.e. if the height of a room extends to two storeys or more only the actual accessible floor area should be used for the calculations. However, as an exception to this rule in the case of stairs, the floor area should be measured as if there were no stairs but a floor in their place at each level.