Heat pump experiment review after two years

I thought it might be about time to review my heat pump experiments now the heat pump has been installed for a couple of years and we’ve had some warm weather and a fairly cold February (for the UK anyway!)

To pre-answer a few questions but not to advertise, I have:

  • an Ecodan 14kW
  • 300L hot water tank
  • bad insulation
  • new radiators with computerised TRVs
  • the radiators don’t call for heat
  • we have no room stats
  • we don’t even record the room temps
  • the cloud interface
  • a rather complicated Python script driving the cloud
  • 1822 semi-detached house with 4 bedrooms
  • 2 adults and 2 teenagers (adults working from home)
  • for renewable heat incentive (RHI), an MCS install by a local supplier
  • installed 2019-09-30
  • EmonCMS extended with the MMSP heat pump app
  • yet more scripts to review the 5.5million files covering the state for every minute

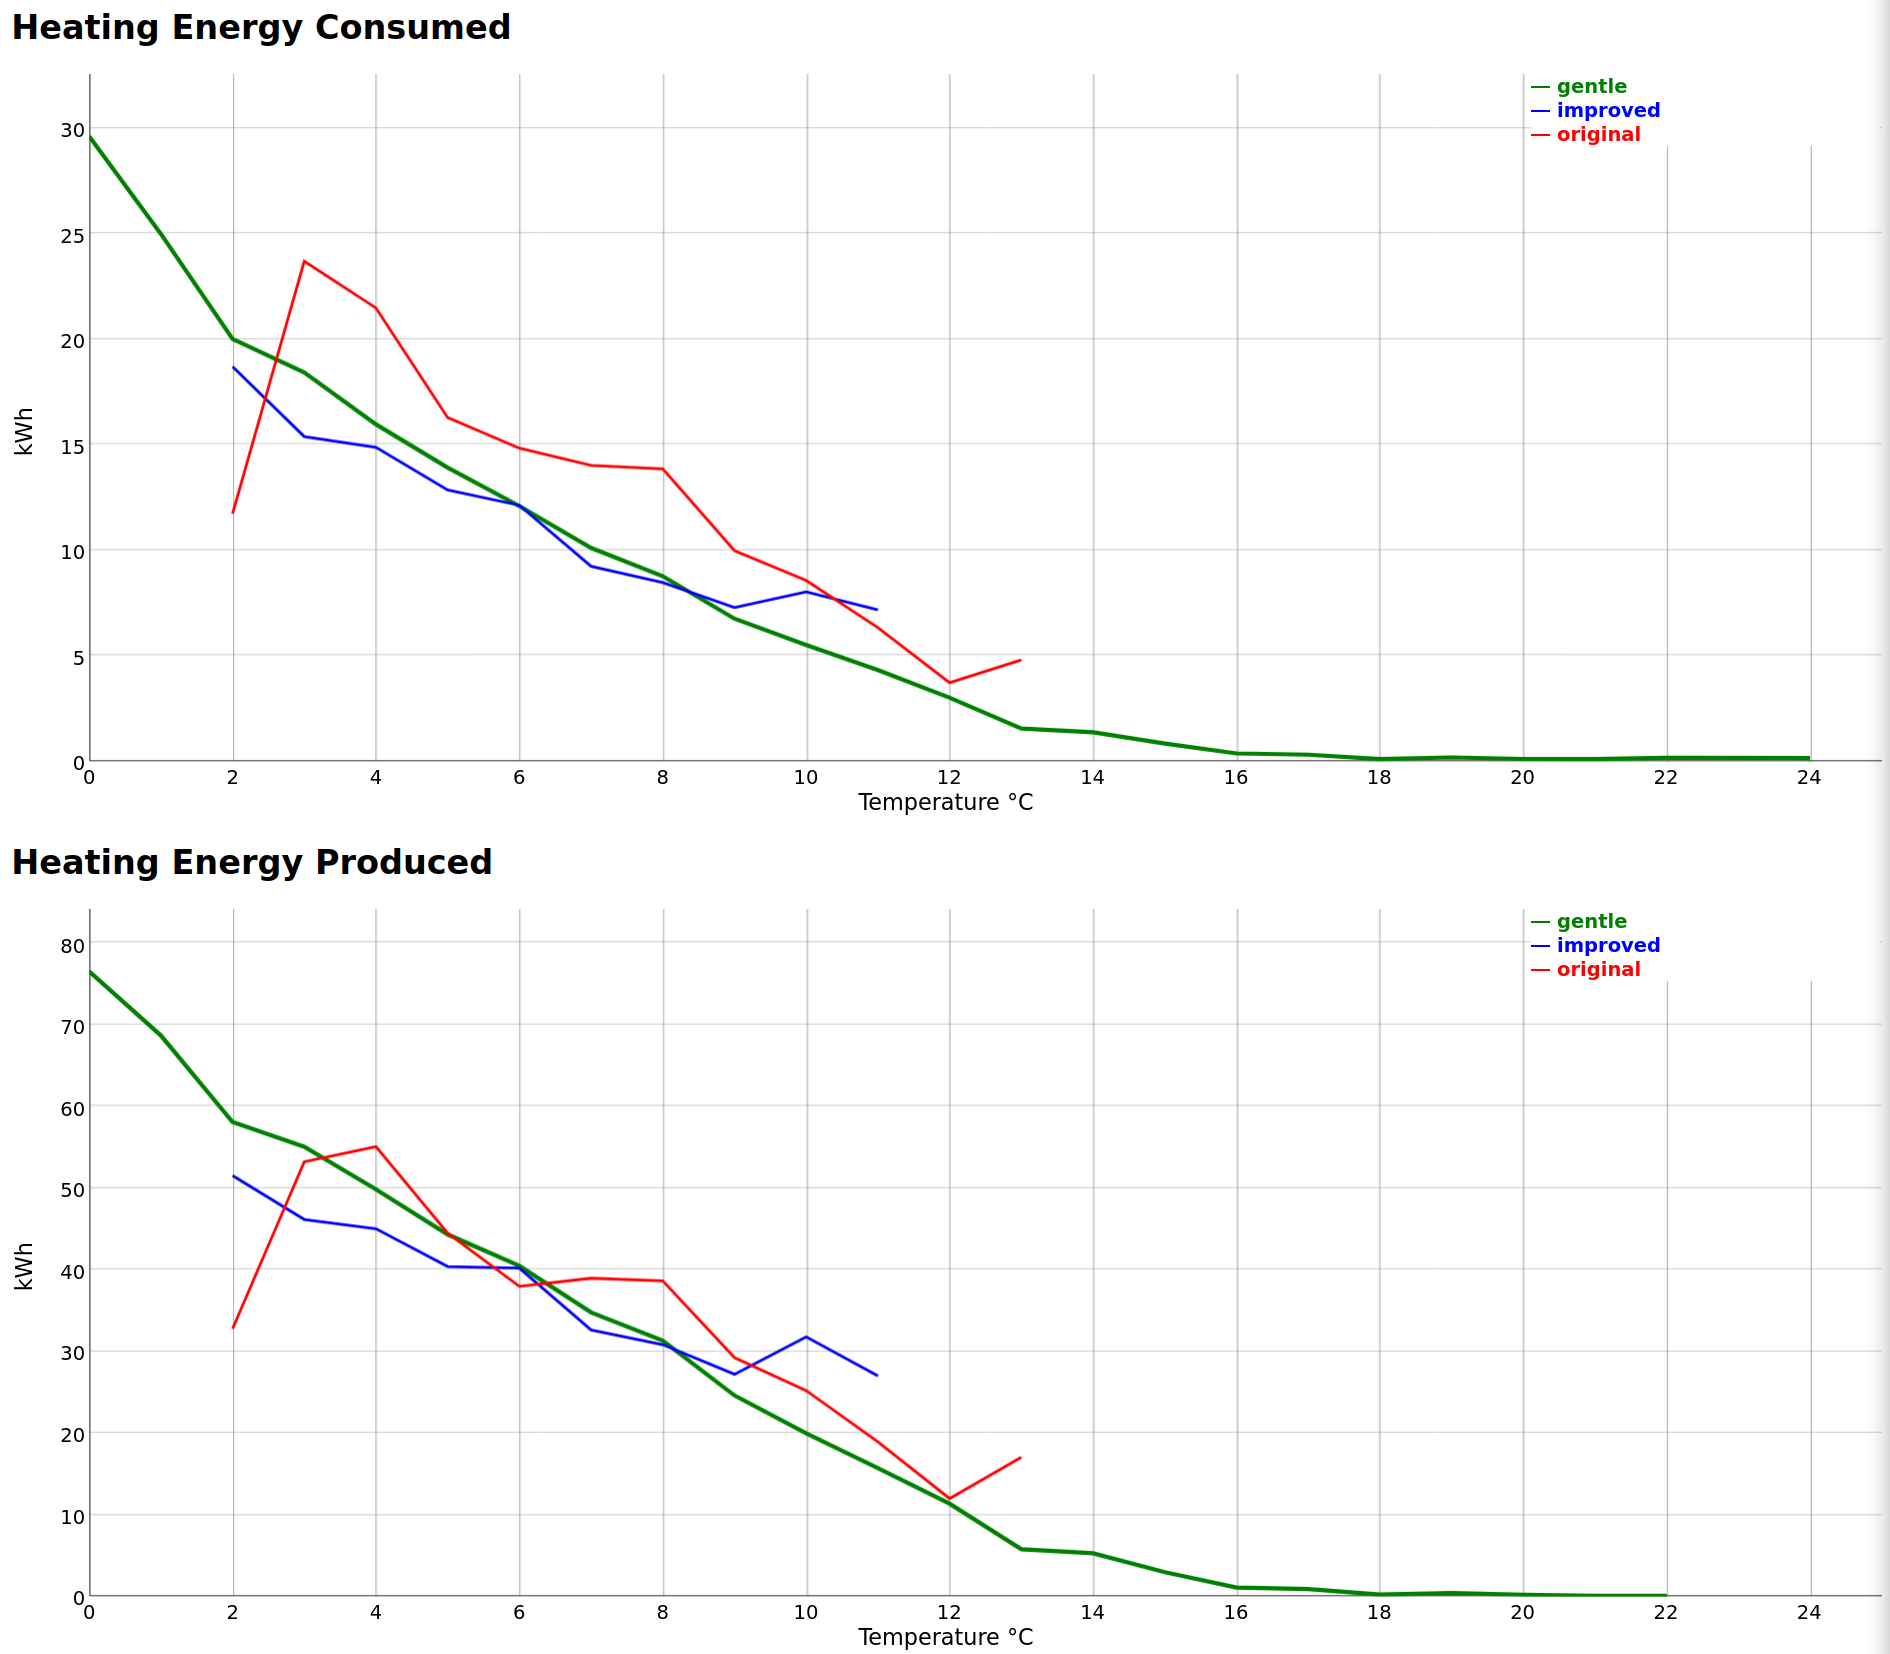
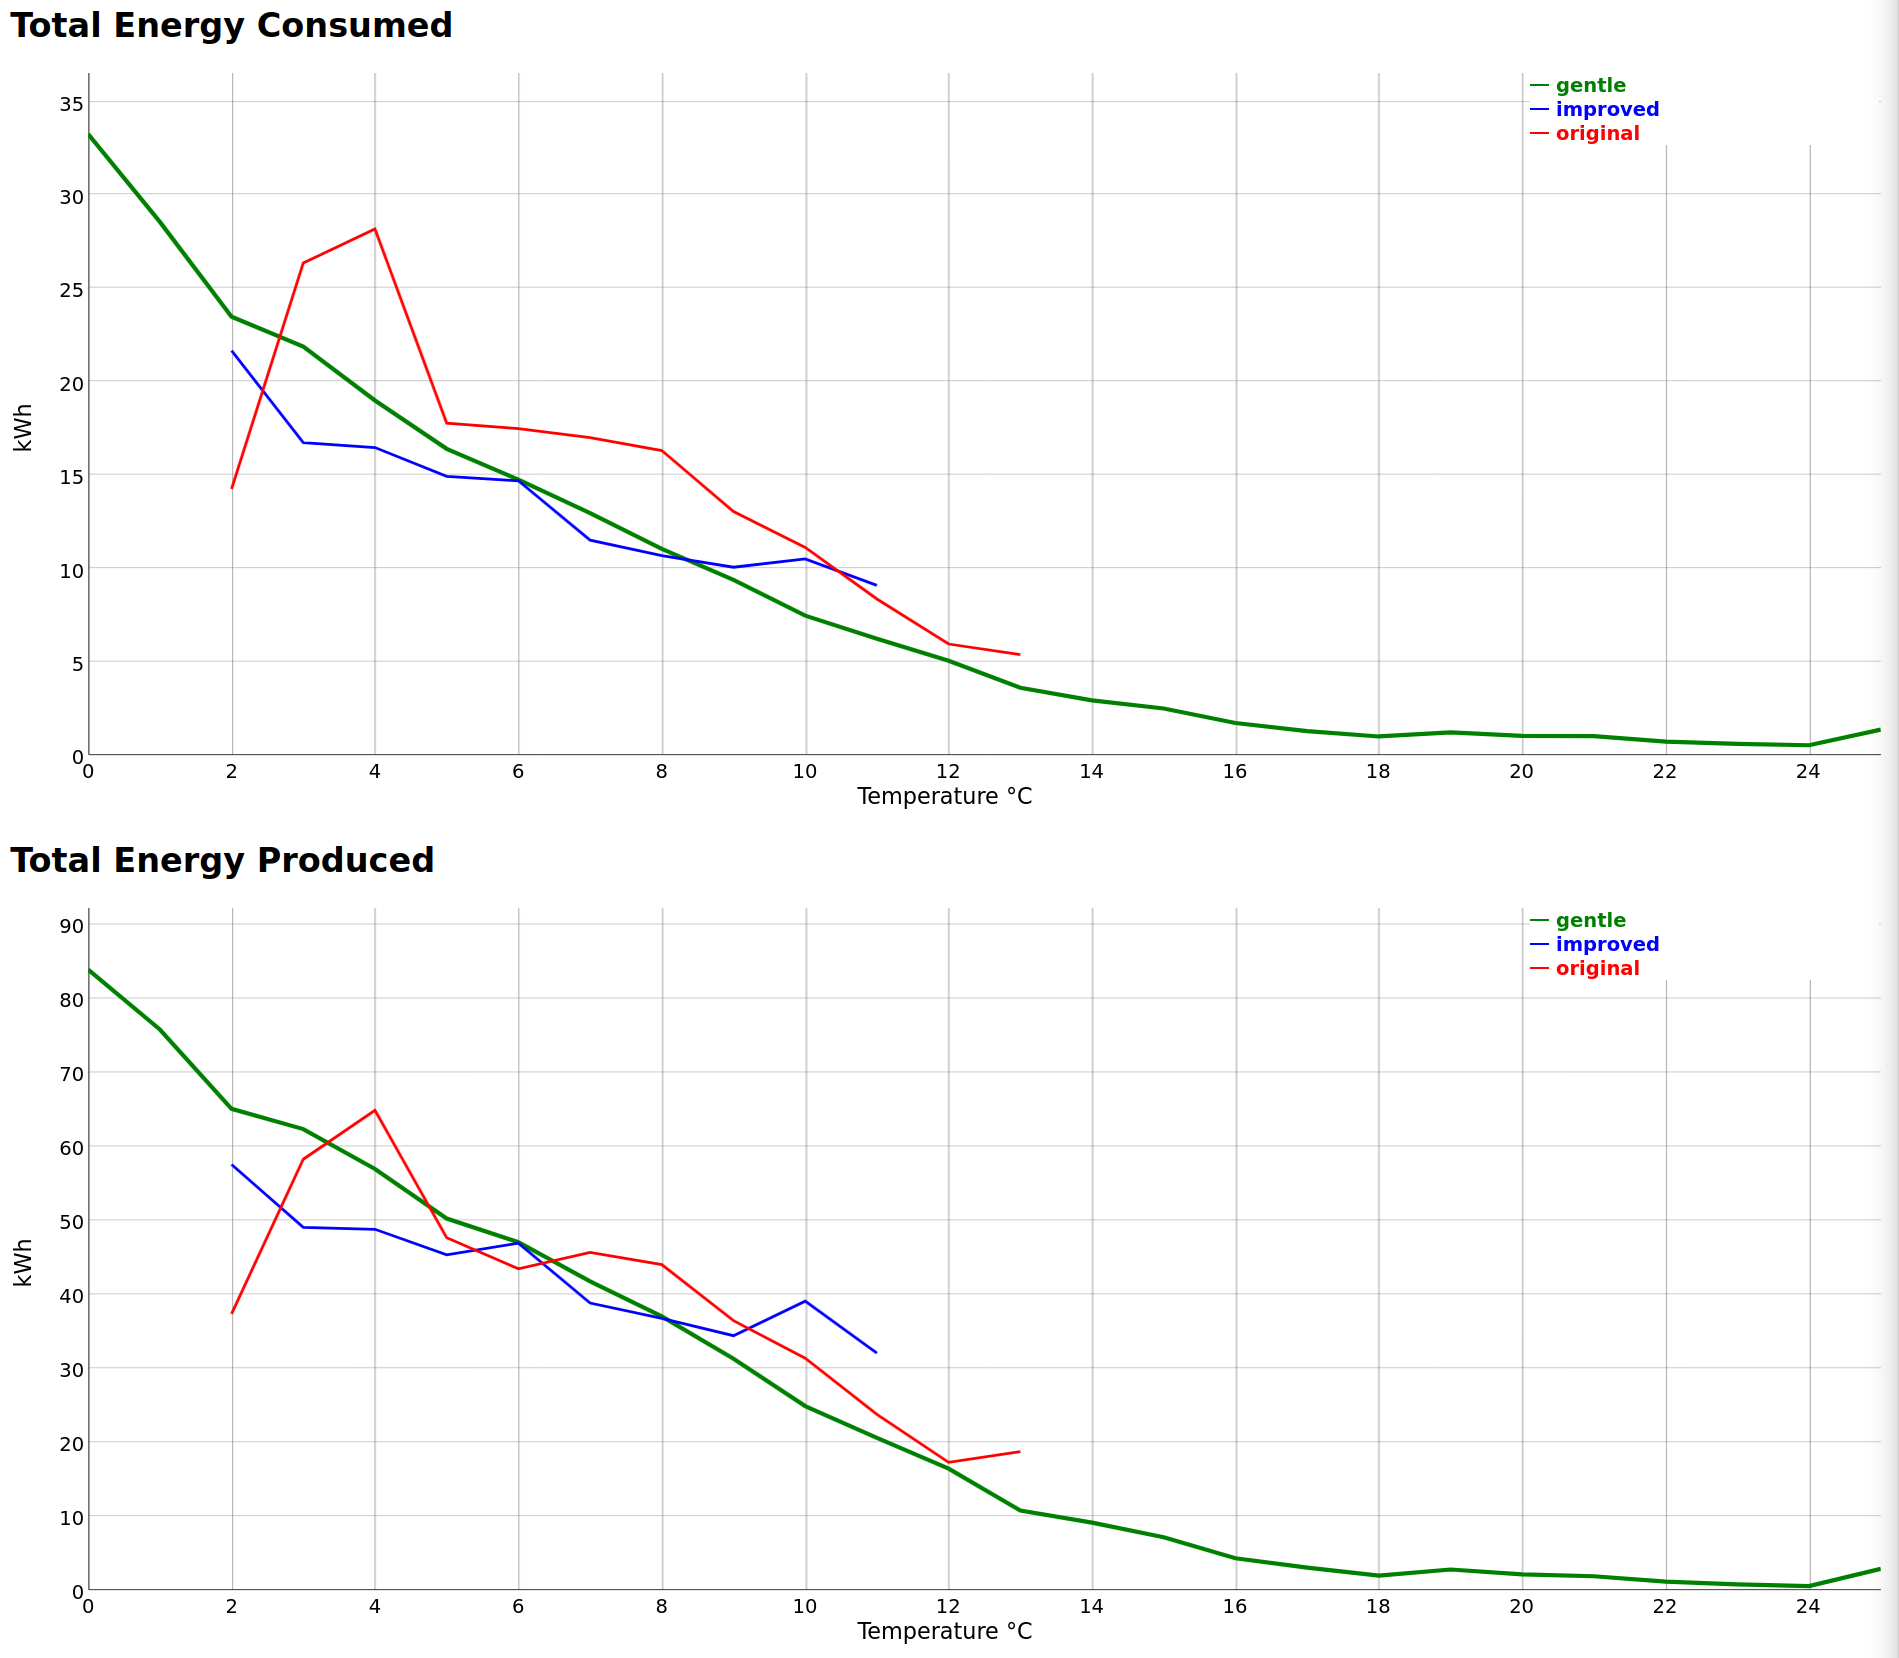
One thing I need to mention about the graphs is the “algorithms” in use. The red “original” lines are the default behaviour of the installed system. It represents what most users would experience. The blue “improved” line is my first attempt at a better algorithm which was OK but it was a bit uncomfortable for the occupants. The green “gentle” algorithm reacts better to surprises and is more comfortable but, as you’ll see, it’s not quite so efficient. We’ve been using the “gentle” algorithm continuously for the last 18 months.

The dashed “dev_xyz” lines are what the manufacturer’s data sheet says we might get.

I review the behaviour according to the average outside temperature that day. So where the x-axis says “12” that means the average temperature on that day was 12 °C but of course it could have gone from 2 °C to 22 °C over the 24 hours.

So, onto the main show, and the headline graph you are all clamouring to see:

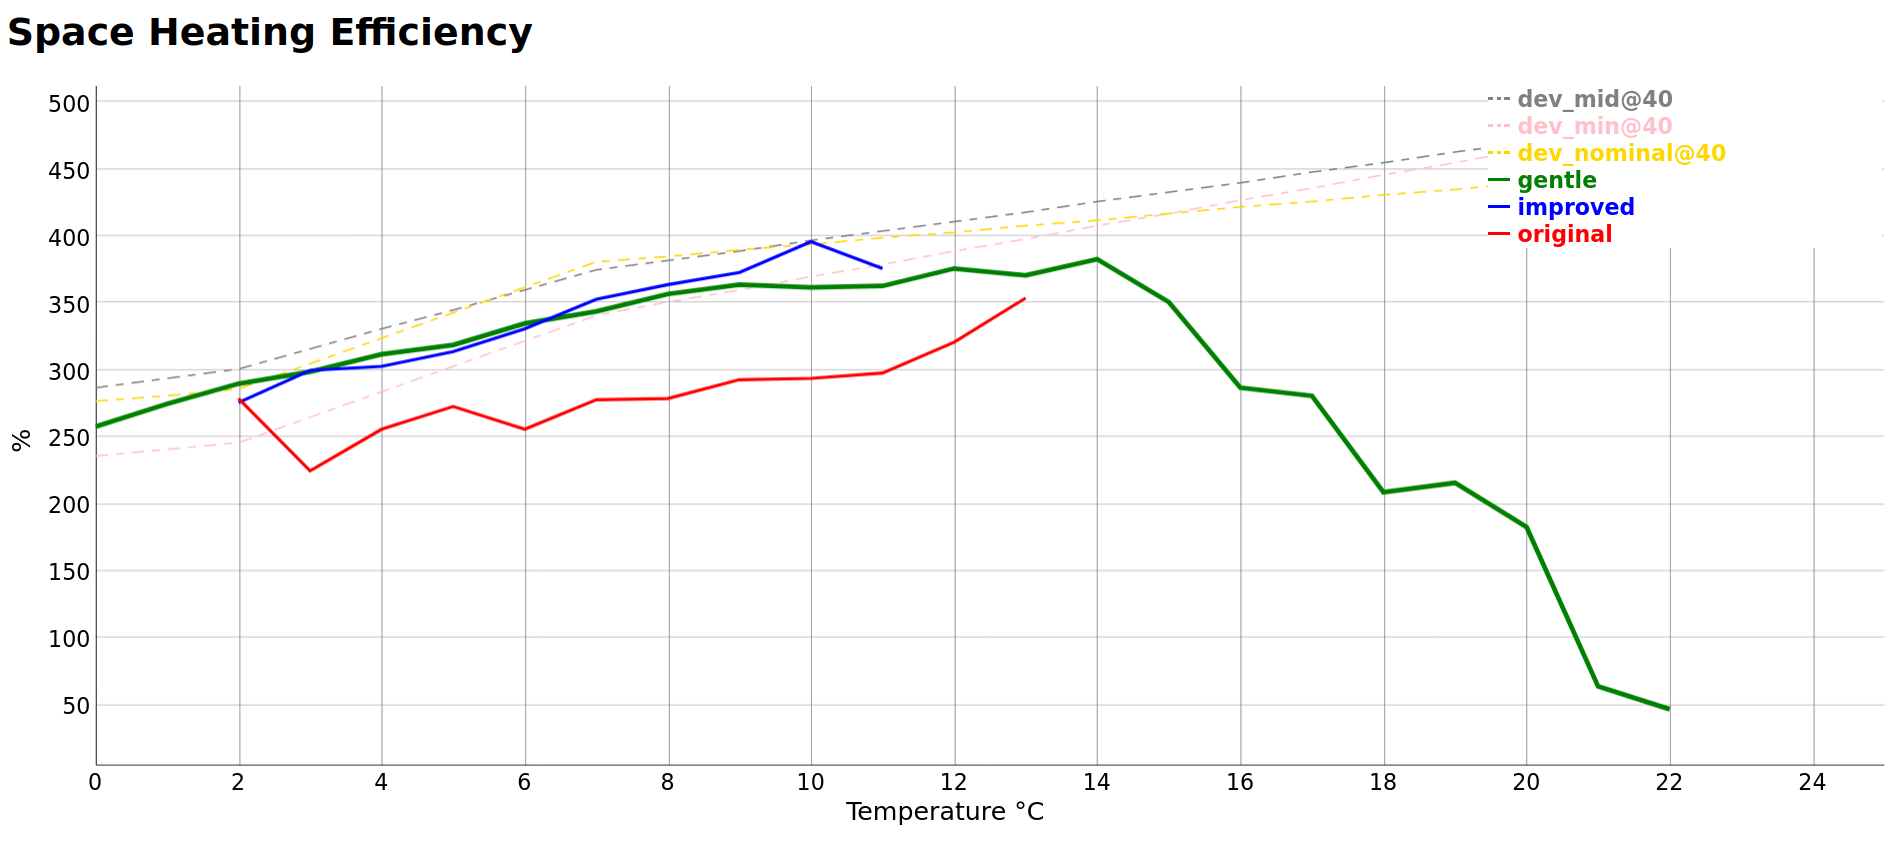
At this point you are all aghast at the drop in efficiency from 14 °C. That’s due to the heat pump running a lot less when it’s warm so all the tricks that make it efficient don’t really kick in. Also, all the monitoring equipment energy is included so that becomes a much bigger proportion when the heat pump hardware isn’t actually doing much. We could subtract that monitoring energy but that would be hiding the overhead and I want to include it to keep me honest.

So you can see the computer controller is always better than the default controller, sometimes increasing the CoP by 0.8. Specifically we need to mention that it’s using the exact same hardware, it’s just altering the control algorithm. It’s also bringing the system more in to line with the manufacturer’s expectations which is a bit ironic.

The main pattern is that it’s more efficient when the air is warmer (noting the caveat about pretty much ignoring over 14 °C). We’d expect that.

Considering we were expecting a CoP of about 2.5 things seem pretty much OK. During the July 2021 service my installer said they expected we would have used 12 MWh of electricity by then, but we’d only used 8 MWh, so that’s nice.

We’re clearly using a pretty big heat pump, erring on over-sized. That’s bad for most of the time, but during the cold February 2021 it was very happy and trundled along nicely which pleased the occupants.

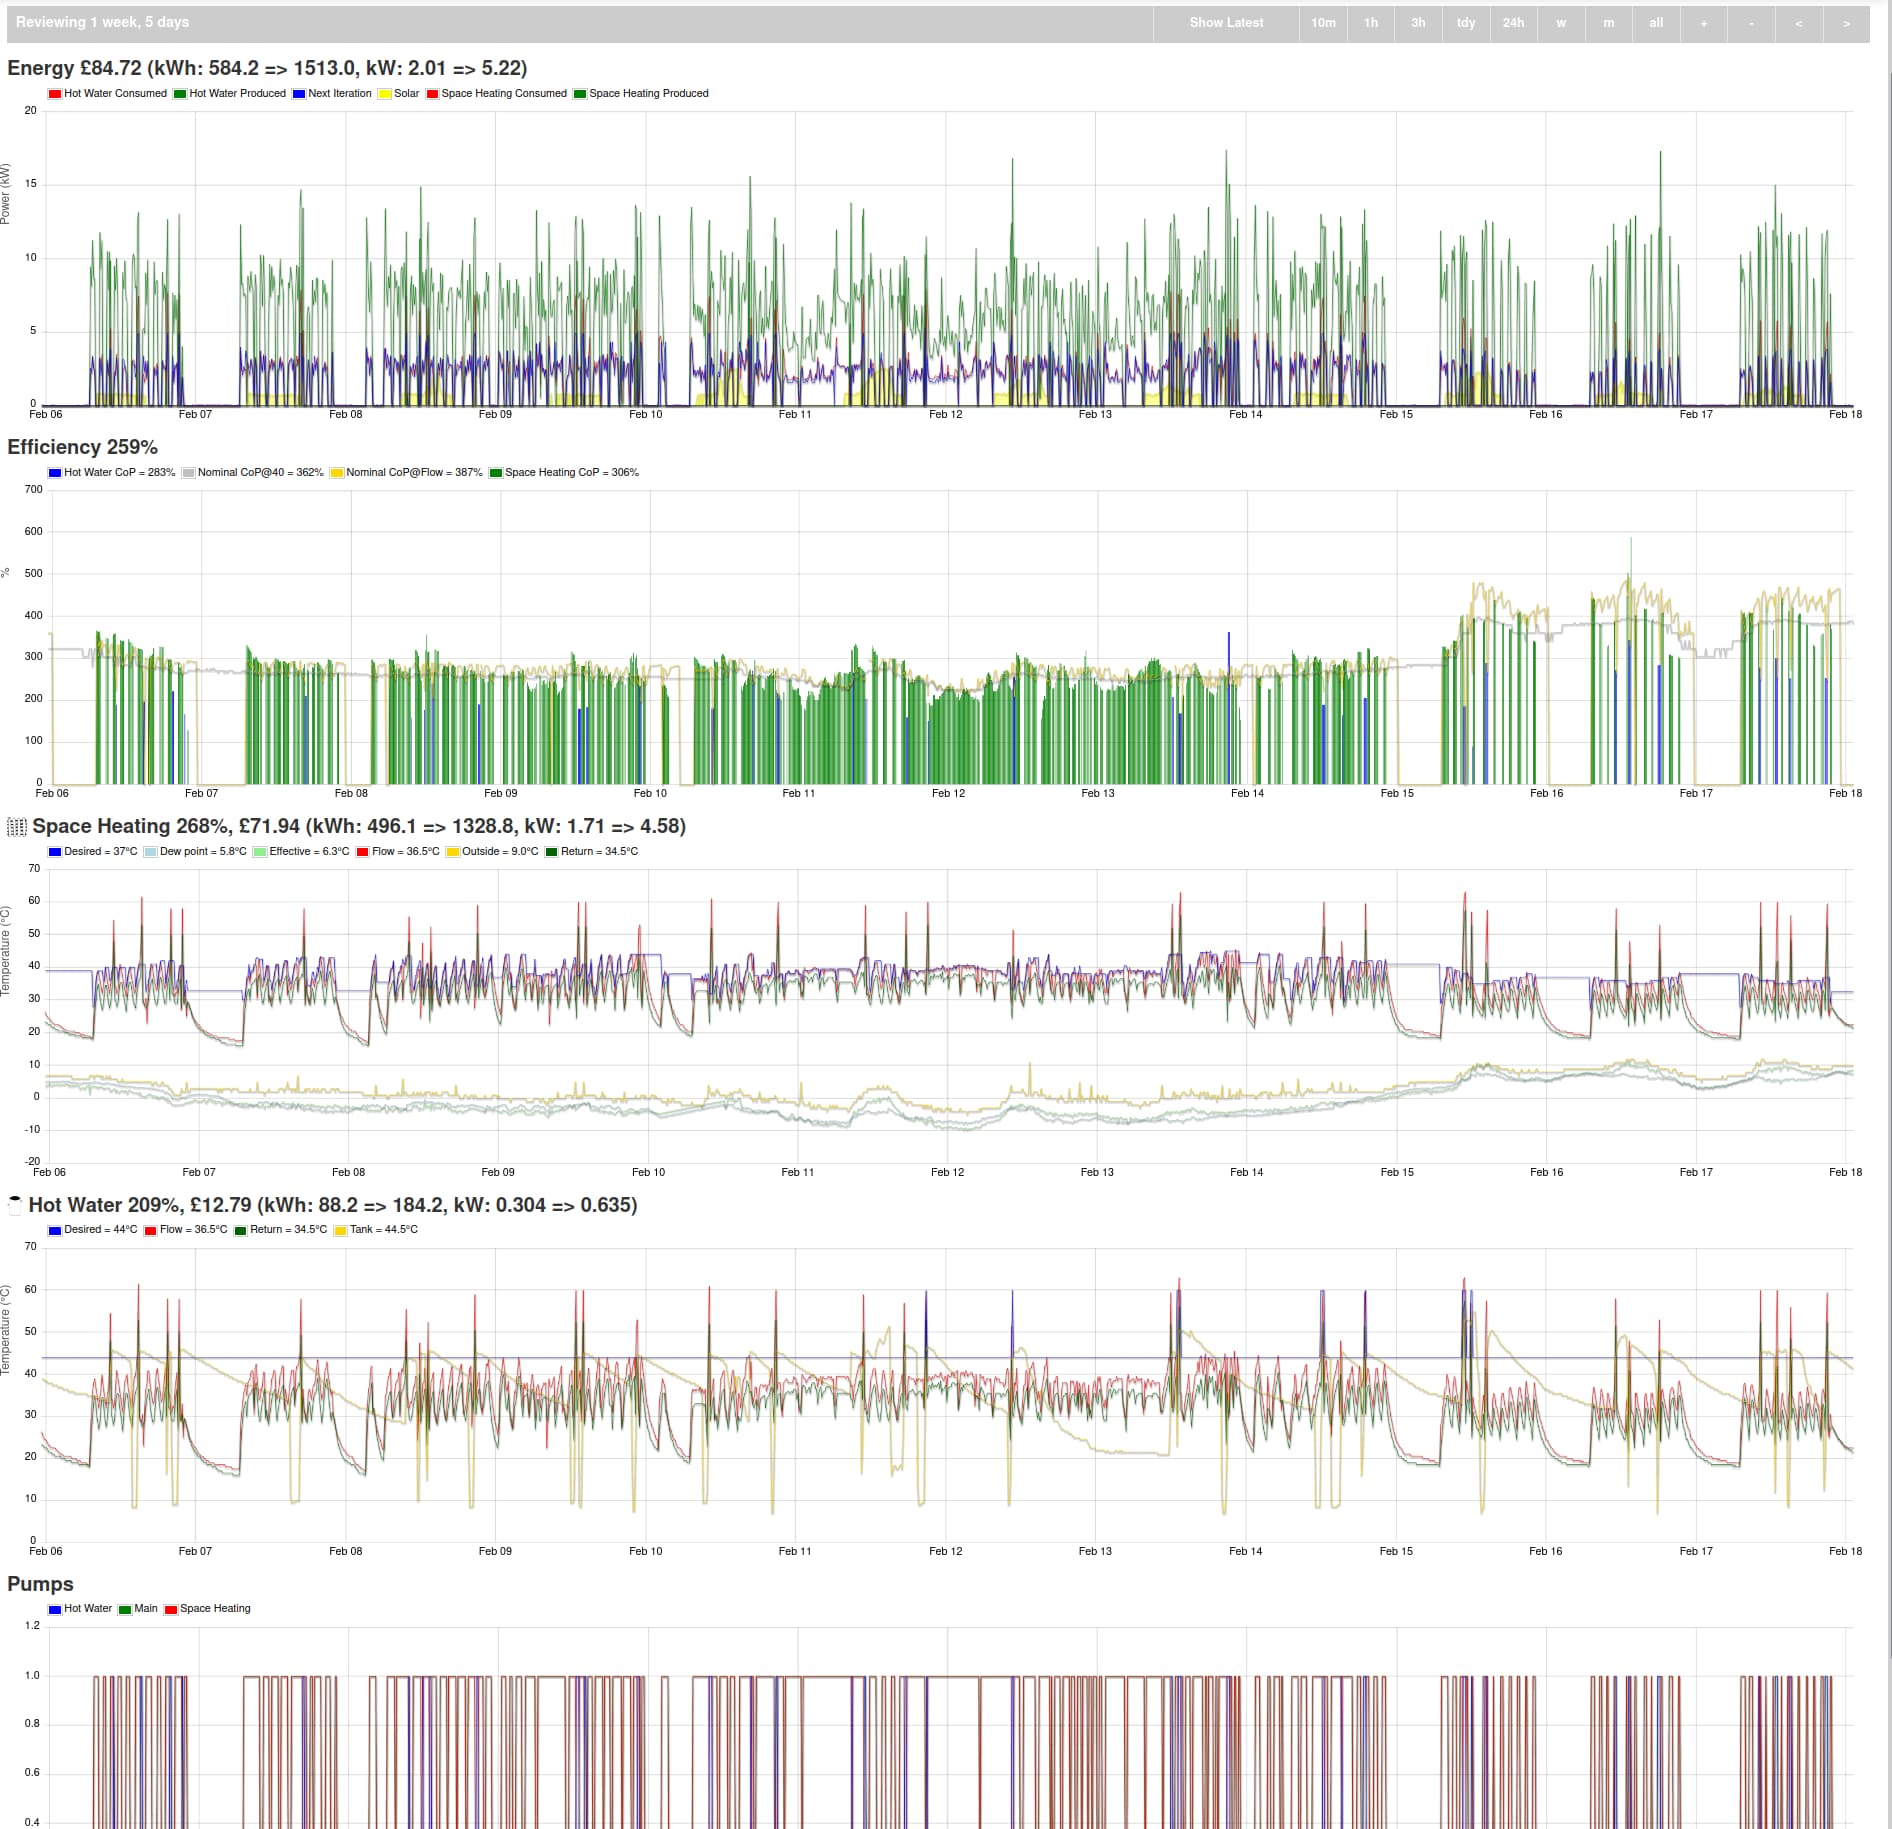
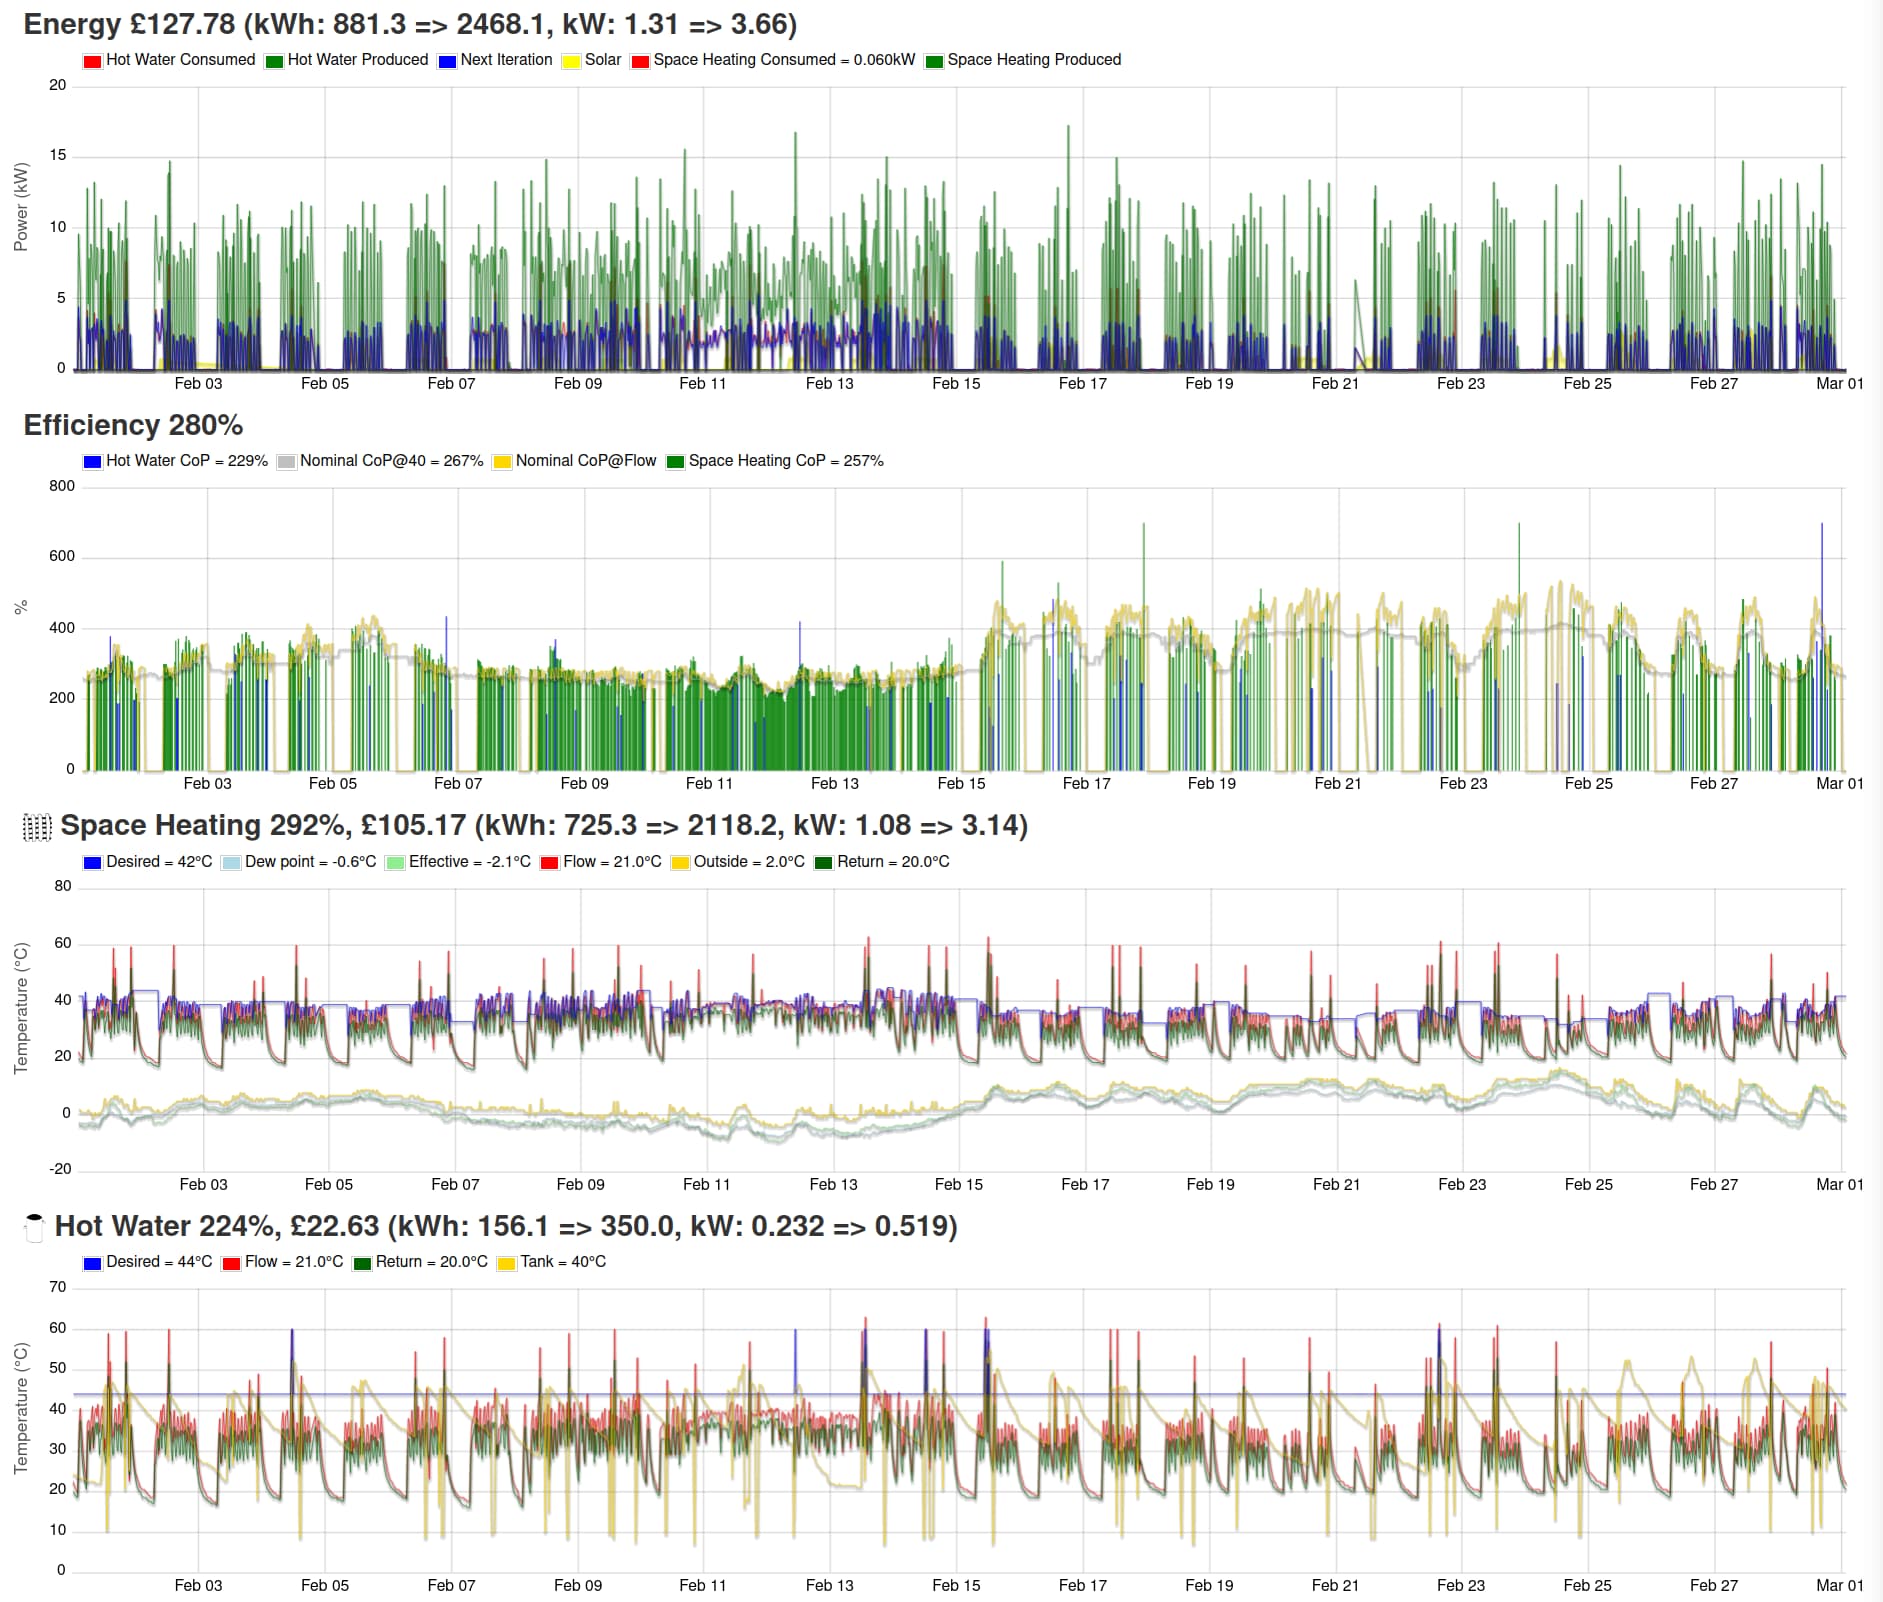
Using 85GBP in 12 days is pretty bad, that’s 7GBP a day which is similar to our oil costs.

Zooming in on one day you can see how it stopped running for some of the day because the sun was shining. In fact there were times when the heat pump was fully solar powered which feels very weird considering the systems typically operate at opposing times of the year.

By now you might have spotted the “Effective” temp bit. There’s a change I made to use a temperature based on wind speed and humidity for something more like what a human might feel. I added that during the storms of February 2020 and it did a great job of balancing for the heat loss from the increased wind. Nowadays everything hinges on “Effective” temp, not the temp from the heat pump’s external temp sensor.

Your next question might be about the heating during the night. It seems odd because we’re asleep and don’t usually have the heating on at all when we’re asleep. There’s a part of the script that says that if the effective temperature is less than -4 °C then the system comes to life to protect the rest of the things in the house and to stop the house sinking down so far that it’ll struggle to be warm when we wake up. Unlike some commercial controllers, I don’t have an algorithm to work out how much heating is needed to bring the house up to temp by wake-up time.

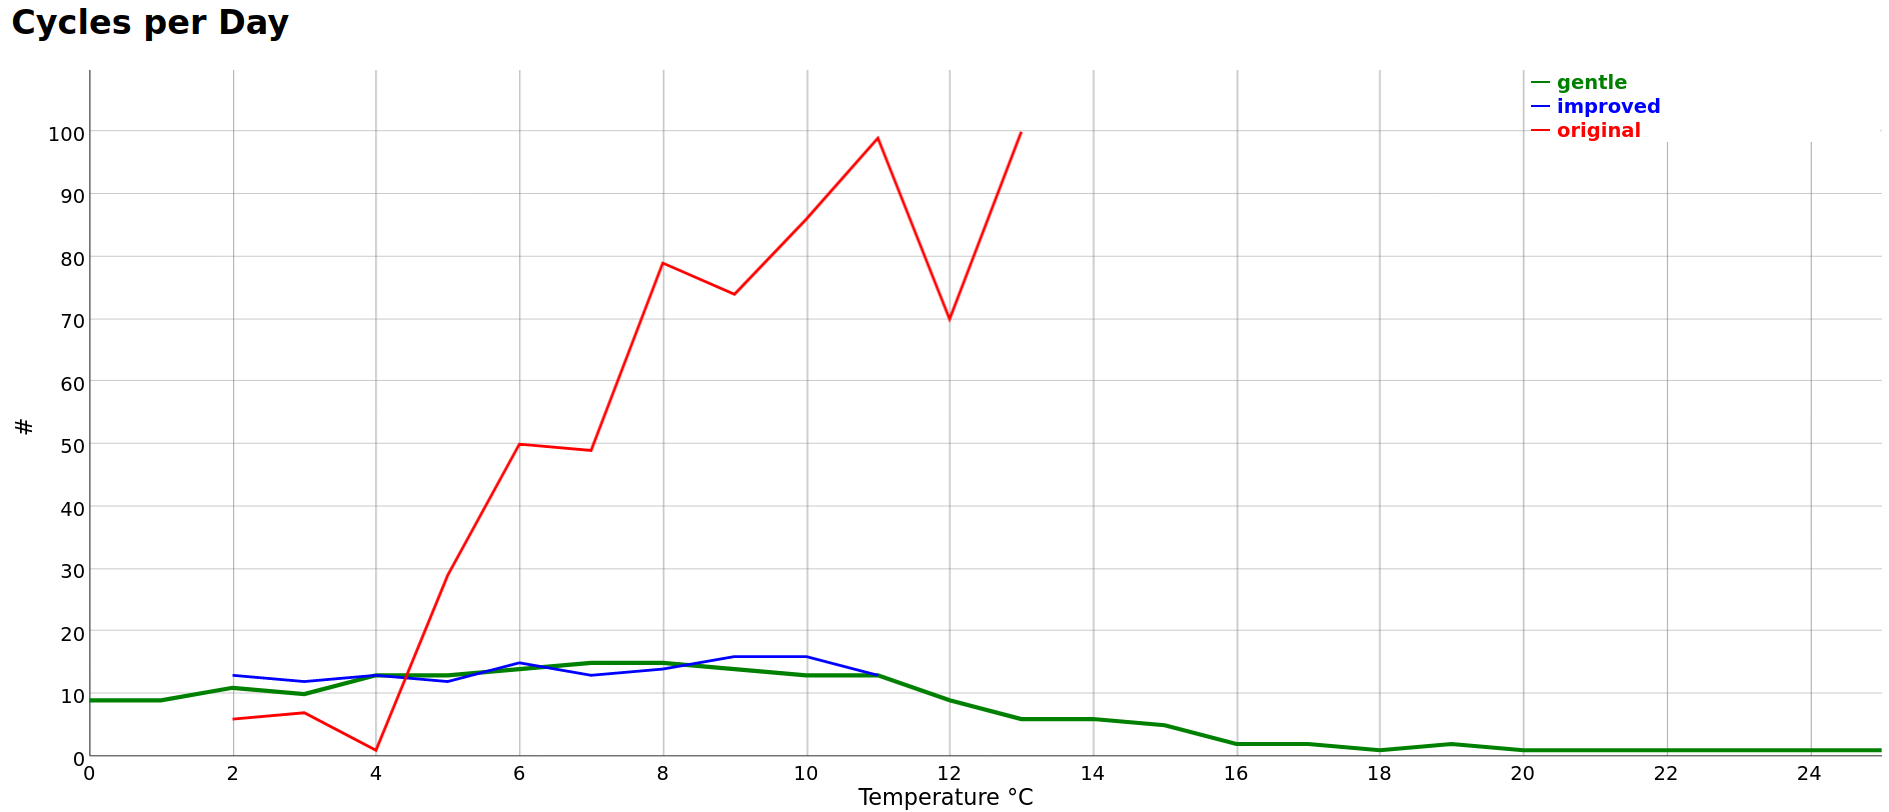
Let’s move on to how much time the system is doing space heating. It’s not got a buffer tank so the radiator pump time matches when it’s doing space heating.

Yes, the rads even come on in the Summer for 15 minutes if the outside temperature plunges before it’s bed-time. The occupants like that. It’s only 12 pence and it makes people comfortable. I should mention the occupants habitually grab a blanket whilst sitting in the lounge, but they even do that when it’s 20 °C outside. They can’t explain why.

In contrast to the “original” controller, we don’t run the pumps so much. That’s because we don’t want to listen to the system running if it’s not doing anything useful so the computer shuts it down. Although the parts of the system inside the house are very quiet, where we live is even quieter and I want to hear the distant cuckoo, not a pump humming along.

I wanted was the heat pump to not run during the Summer because we’d be enjoying the garden and didn’t want the fan noise. I don’t want to sneakily do the hot water at night because my neighbour sleeps with the windows open and I don’t want to risk waking them. Of course it’s very unlikely too, but I want to be a nice neighbour. The solar diverter means we can get hot water in the Summer without the heat pump a lot of the time so that worked out nicely. Someone told me they put the heat pump on in the Summer sometimes so their kids can run around in a cold blast of air.

Another headline you’re after is the daily cost:

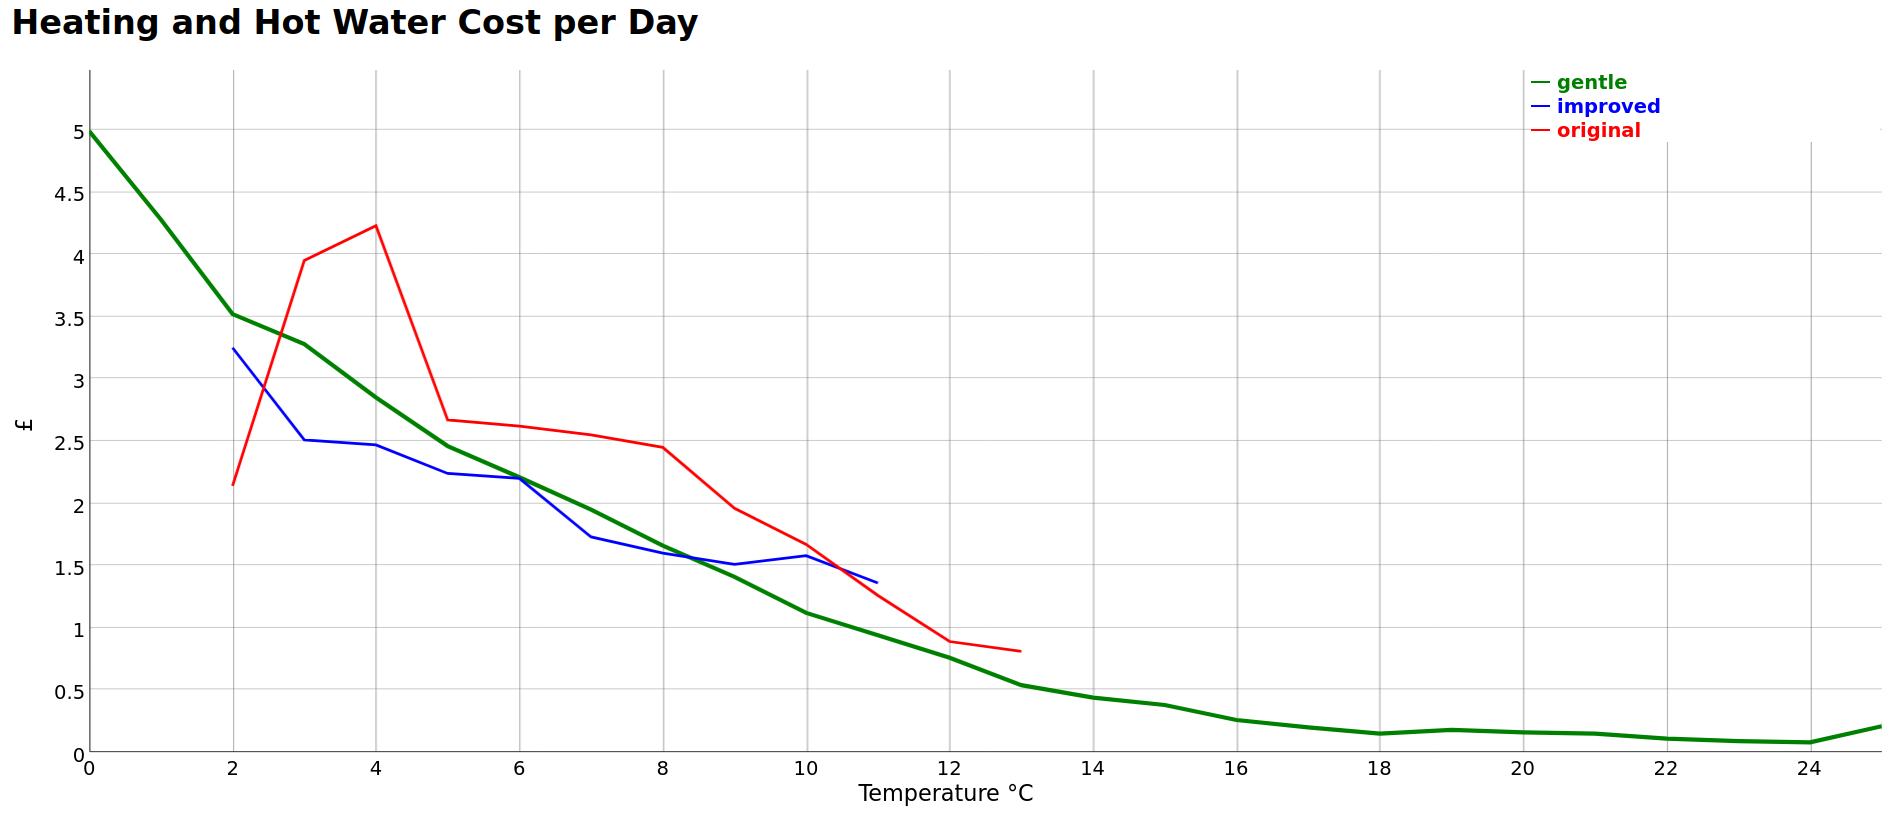
Note the amusing uptick at 25 °C which comes from there being lots more showers when people get out of the swimming pool so we have to nudge the house heat pump on sometimes.

Breaking that up we see a very sensible curve:

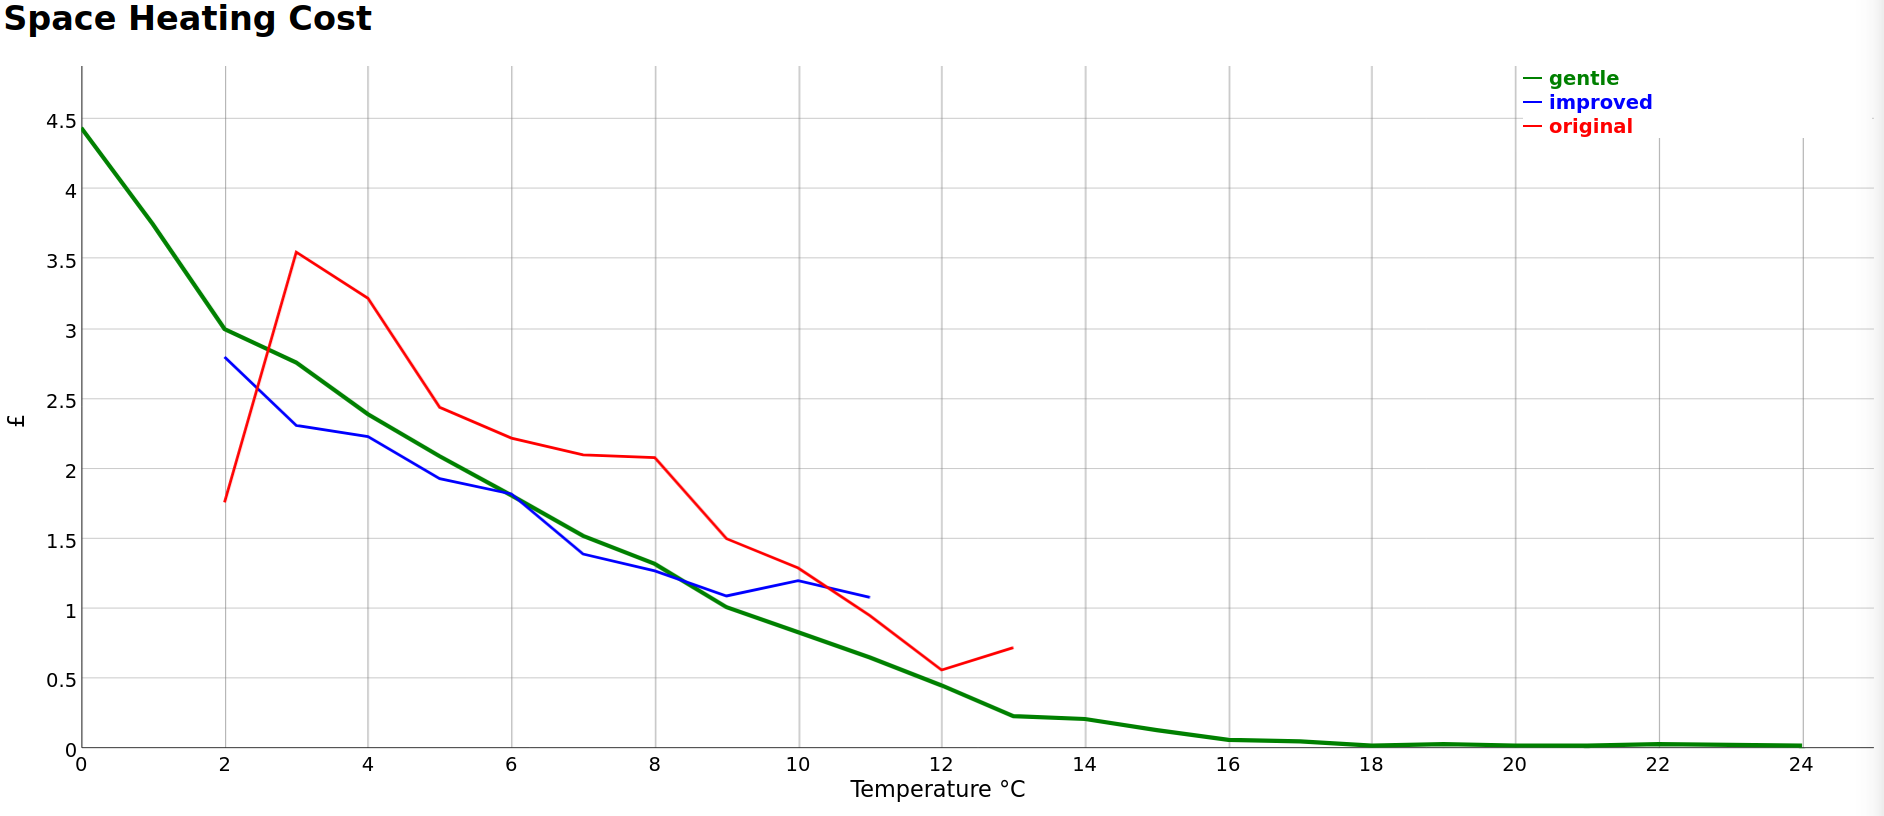
We’re pulling a fair amount from the grid each day when it’s cold. This could get more interesting after the EV arrives this week and we start charging that too. One of us will soon be travelling to work each day.

I’m going to stop here otherwise the post will ridiculously long. You can tell I have more to say, but I’ll try to answer questions rather than just blathering about even more of the bits of the control algorithm or telling you the heat pump hardware has worked brilliantly the whole time.

Thanks.

3 Likes

This is great, thanks again for sharing @MyForest! and good to see the algorithm that you have developed working well! The effective temperature idea is interesting and taking into account wind speeds.

Do you have space heating kWh daily totals for those coldest days? What was the average heat output & flow temperature?

Is the algorithm still doing what you described before in terms of creating long duration cycles rather than the default controllers over-cycling?

1 Like

Do you have space heating kWh daily totals for those coldest days? What was the average heat output & flow temperature?

Yep, here you go @TrystanLea:

Is the algorithm still doing what you described before in terms of creating long duration cycles rather than the default controllers over-cycling?

Yep, absolutely. You can see it runs for longer cycles when it’s cold so there are less of them and when it’s sorta warm it toggles on and off more, then eventually when it’s rather warm it barely needs to come on.

Compared to the red line I’m pretty happy with the current behaviour!

1 Like

I’m sure you picked up on this before, but you can see I’d like to graph in EmonCMS by something other than time.

I’m obviously quite comfortable doing this in my own tooling, but I thought I’d mention it here because it’s a good use-case for the x-axis being something other than time.

I’m ashamed to say I don’t have spare time to help for the next or year or more, so I shall go put my suggestion in a box and hush.

1 Like

New member here, exploring, and stumbled across your post. Lots for me to digest, but I’m very much looking forward to that - not least with the memory of February, here on the east coast, still not so much “fresh” as “raw” …
In the meantime, thanks very much for such a detailed report!

1 Like

Hi @SimonD

Nice to meet you. We’re about 40 miles in-land from the East coast near York.

I thought I’d share February 2021 with you so you have a fair assessment.

In this picture the more solid green in February 8th to the 15th is when it was cold (in UK terms) and only peeped above freezing rarely.

I tend to run my heat pump intermittently (the large radiators keep us warm in between). As a result you can see that on February 12th it was very unusual and the heat pump was running most of the time, but at other times it wasn’t needed so much.

The house stayed warm the whole time which is why we bought the heat pump :slight_smile:

Best of luck with your heat pump.

1 Like

Ha - at this stage, the heat pump is no more than a twinkle in the eye but, by way of preparation, I’ve been trying to size up the demand it would have to meet.
For the last couple of years we’ve enjoyed the privilege of a sea view, facing directly into that wind. At one point I reckon it was just about doubling our daily consumption of gas, compared to what I’d expect in still air ~ 0 degC. (It’s a mid-19th century terrace, as leaky as you might guess, and the answer to the heat pump question hinges on whether it’s feasible/allowed to do enough to improve matters.)
Cheers

1 Like

Aha @SimonD that does sound tricky.

Our 1822 house got a lot better when we plugged all the gaps and had an air-tightness test. It’s stopped the mice too!

I did have to update my control algorithm to incorporate wind-speed when we had the storms in February 2020. It’s been great at nudging a bit more heat into the house when needed.

We opted for big radiators. In fact we just got new ones because the old ones were already 2.5m long where it mattered. That saved us the headache of pulling up all the floors and although the radiators aren’t perfect, they’ve been pretty good. We get them up to say 38 Celsius and then let them gently cool down to 26 Celsius over 20 minutes then we warm them back up. The occupants seem very happy with this arrangement.

It will be tricky with all the wind, but the heat pump will modulate nicely to keep a sensible flow of heat into the house.

Ultimately, for us, we couldn’t countenance burning yet more oil to keep the house warm when there are wind turbines all around us giving green electric. That wind blowing on to your house is also powering all those turbines at Hornsea.

Best of luck.

1 Like

Thanks @MyForest that’s a great graph showing how your algorithm reduces overall number of cycles substantially by forcing longer on/off times!

I was just searching for melcloud & emoncms and noticed you post from Feb 2020 , are you still doing all of your control through melcloud and are you collecting your monitoring data that way as well?

If you are what are you able to read from melcloud? And would you be able to share any scripts?

1 Like

Hi @TrystanLea

Yep, I’m sill using MELCloud. I’m using it to read and write.

I’m in a bit of a bind about my scripts. At the moment they grab data from MELCloud and store it. Then other scripts use that stored data. Then they call the “API” to make changes.

I don’t think I can reasonably release those scripts because other people running them could damage their heat pumps and then Mitsubishi will be understandably unhappy. The “API” isn’t enforcing many boundaries, I think that the Mitsubishi app + website are doing client-side limitations. For example, some of the parts are essentially bit-masks and you can easily get those wrong.

There’s a Python library which does read in very much the way I do:

I’ve been trying to work out a way round this for a couple of years now and without going to Mitsubishi I can’t see how else to do this. If I approach them I may get told to stop doing even the bit I’m doing now so I’m choosing not to ask.

I have tried some other channels to gently begin the conversation but none of those worked.

Do you have any ideas how we might get Mitsubishi’s help without jeopardising what we currently have?

1 Like

Thanks @MyForest I will try that library now, Im tying to help a friend of @glyn.hudson’s to troubleshoot some issues on their heat pump and they have Melcloud, hoping I can get at some more real time data from the heat meter than the daily summaries.

1 Like

Looks like this is now the latest library GitHub - vilppuvuorinen/pymelcloud: A MELCloud Client Library works a treat pulling in a lot of data from the heat pump, the object is 775 lines long!

However I still cant see power consumption or heat produced in watts or kW as a real-time value? there is a daily figure…

Yep, you’ll have no trouble doing that @TrystanLea

The “API” gives you a big data structure as JSON which gets updated every minute. That library is reading those.

You’ll find it easy to POST those to EmonCMS and then you’re back in the land you know.

You could even use my heatpump app, but you might not even need to do that to answer your questions.

1 Like

Here’s the bit where I transform from the JSON to POST to EMonCMS:

        interestingMetrics = [
            "EcoHotWater",
            "FlowTemperature",
            "HeatingEnergyConsumedRate1",
            "HeatingEnergyProducedRate1",
            "HeatPumpFrequency",
            "HotWaterEnergyConsumedRate1",
            "HotWaterEnergyProducedRate1",
            "OperationMode",
            "OutdoorTemperature",
            "ReturnTemperature",
            "RoomTemperatureZone1",
            "SetTankWaterTemperature",
            "TankWaterTemperature",
            "TargetHCTemperatureZone1",
            "WaterPump1Status",
            "WaterPump2Status",
            "WaterPump3Status",
            "WaterPump4Status",
        ]

        toPost = {}
        for i in interestingMetrics:
            try:
                v = float(interesting[i])
                toPost[i] = v
            except:
                try:
                    b = bool(interesting[i])
                    v = 0
                    if b:
                        v = 1
                    toPost[i] = v
                except:
                    self.__logger.error(i + " does not have numeric or boolean values")

        encoded_data = (
            "time=" + str(int(readingDateTimeUTC.timestamp())) + "&node=ecodan&apikey=REDACTED&data=" + json.dumps(toPost, separators=(",", ":"))
        )

        self.doPost(encoded_data)
1 Like
            "HeatingEnergyConsumedRate1",
            "HeatingEnergyProducedRate1",

These are something like “kWh” per 60 seconds.

So then you can do something like this:

Which is what I’m doing here:

1 Like

Give me a nudge in this thread if you are still struggling.

1 Like

Ooh, they made their library read/write doing the same thing I do.

These “EFFECTIVE_FLAGS” are part of the exciting bit that is troublesome.

Yeah, here’s their map of the flags where they are trying to do a good job, but it’s fraught.

1 Like

Yep, they are also showing that the energy consumed is something like Wh.

I’ve actually calibrated it against what the attached meters say and it seems close enough to me that it’s representative. It’s inevitably hard when you have a sampling window of 60 seconds and you’re returning a single reading.

1 Like

Drat, they are leaving you a bit high and dry because they are limiting what they are making available as methods on the Python class, such as this:

Aha, they are going about it in a slightly awkward way because they are polling more bits of the API than I think they need:

If you just request this you’ll get the jelly flood:

User/ListDevices?id=SOME_ID&buildingID=A_DIFFERENT_ID

You can see those ids trivially by watching a GET request in the website when you are looking at the device temps and controls on the website.

1 Like