I am pushing data from a Samsung smart plug into EmonCMS. The plug operates over Zigbee so its very frugal with its data use as many devices on the network are battery powered.
This means that it only sends power level updates when the level actually changes. I push this into a PHPTimeSeries feed.
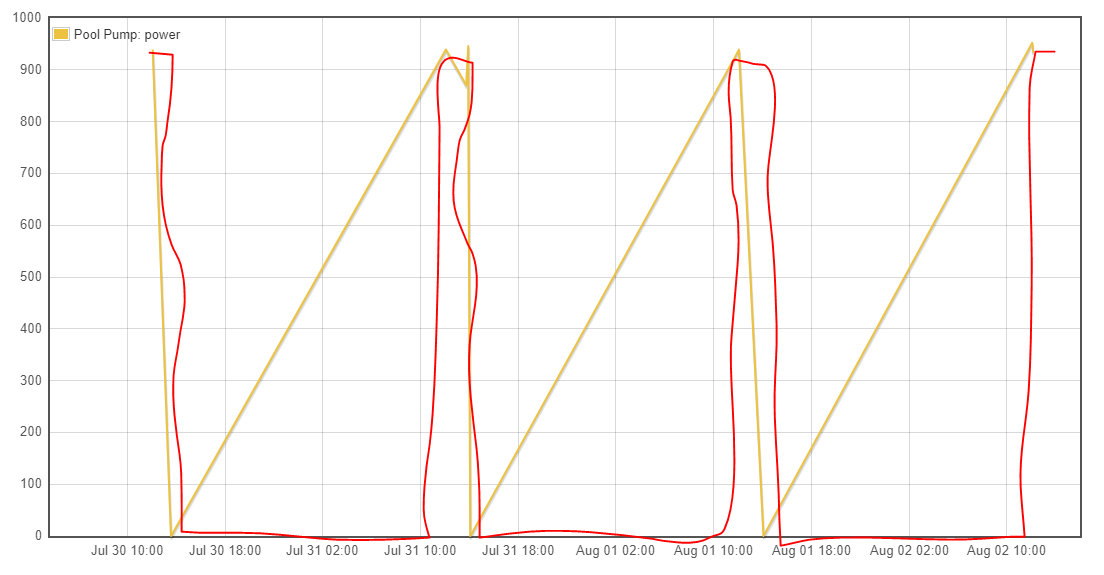
Unfortunately the graphs are terrible though. EmonCMS is drawing a straight line from the last sample at 0 the day before to the next sample at 1100W when the pump turns back on.
Is there any way to have the graph render properly, with a horizontal line to the next sample is taken, like my hand drawn graph, which is what is actually going on?
The graph isn’t ‘terrible’ it is doing what you ask of it based on the data you are storing.
Timeseries feeds expect a value for every slot, if nothing is received, by default, it records NULL. This can be what is required.
You could play with the input processes available to record Zero if the input is NULL. It isn’t a built in process - @TrystanLea, perhaps it could be added?
The way SmartThings reports power is exceptionally efficient - I would have to do something ugly like write the previous value to the emoncms database every 5 minutes to get a graph that renders accurately, and that seems like a waste.
@Bill.Thomson - exactly - I’d broadly expect TIMESERIES to render per my hand-drawn graph given the descriptions you linked to.
How would it be a waste? You’d just get a graph with 5 minute resolution. If you can live with that, it should be OK. The problem comes when the data arrives at intervals greater than emonCMS expects.
If the interval is fixed at, or very close to, 5 minutes, you should be able to set the interval to 5 minutes and get the graph you’re looking for. (The PHPFINA drop-down-menu interval choices are 5, 10, 15, 20 and 30 minutes, as well as 1 hour, and 1 day) Otherwise, use PHPTIMESERIES.
I am using PHPTimeSeries and this is how it renders. I only get samples on the input when it changes power level.
resampling every 5 minutes won’t be efficient because it would be storing a lot more data that doesn’t actually say store any meaningful information beyond the time series I have now. But it will render better, I’d hope.
I understand I’ve found a corner case in how OEM renders time series data. I think that until a developer sees and understands the issue I’m outa luck.
I’m not sure I understand that. As I see your problem, there’s an assumption on the part of “SmartThings” (I think that’s your data source) that the value will remain the same until it is changed.
I was taught - or somewhere along the way I picked up the assumption - that the values between known points on a graph vary smoothly between those points.
In respect of how the graph is drawn, PHPFINA and PHPTimeSeries work in exactly the same way - which is the same as every graph I’ve ever come across, even hand drawn ones. It joins the known points. What I’m trying to get across is you want it to include a point that’s unknown as far as the data available to the graph is concerned, that you know about because you know the source of the data and that it has this specific property.
There’s no mechanism at present for you to tell it to do that.
If your data source is to work successfully with emonCMS as we have it, then I think there are three options:
1 - SmartThings or your handler needs to send both the “from” and the “to” values when there’s a change, and then PHPTimeSeries will draw the graph according to your wishes, or
2 - you (or you ask someone to) write an interfacer for emonHub that remembers the last value, then emits it with the present time at the instant a new value is received, then emits the new value with a fractionally later time (so that PHPTimeSeries has two records for each change), or
3 - you need to add a custom graph module to your emonCMS that draws a horizontal line from the last to the next value, then a vertical step.