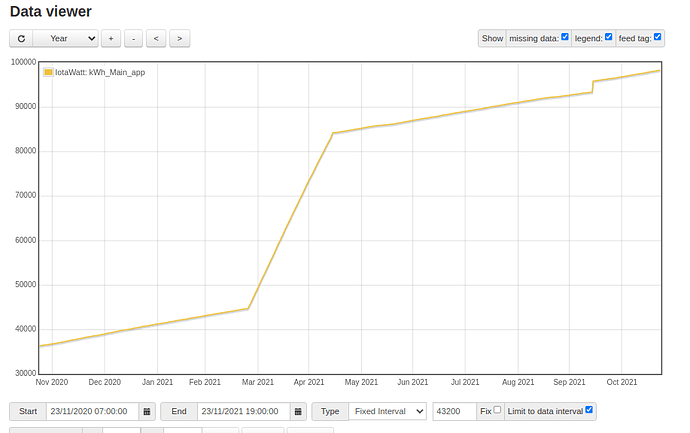
Ok, Im running latest master branch of emoncms, so the difference may be that, will double check.
Ok, Just to check, can you screenshot what your settings were for your graph to display? Just want to ensure we’re apples to apples in comparison for settings.
That said, I’ve checked but have not had any recent updates to my EmonCMS (says branch is up to date), so I’m guessing no updates have been released.
There are two main branches: stable and master, the stable branch is the standard branch that most people are on, the master branch is usually ahead of stable with new features in testing. Will take a look in a bit to see if that’s the difference.
Ok, it doesnt seem to be a difference between the branches, stable is working fine for me as well.
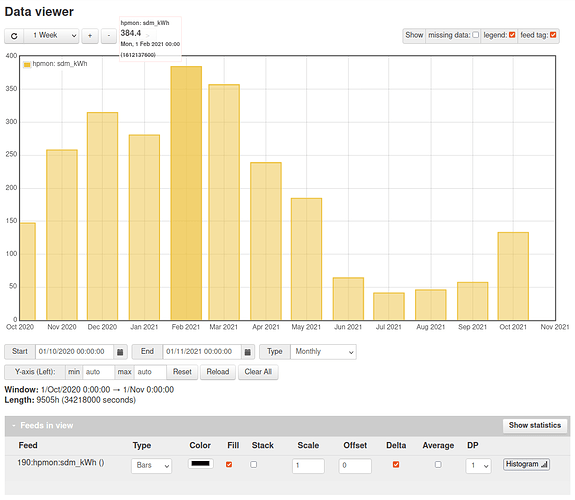
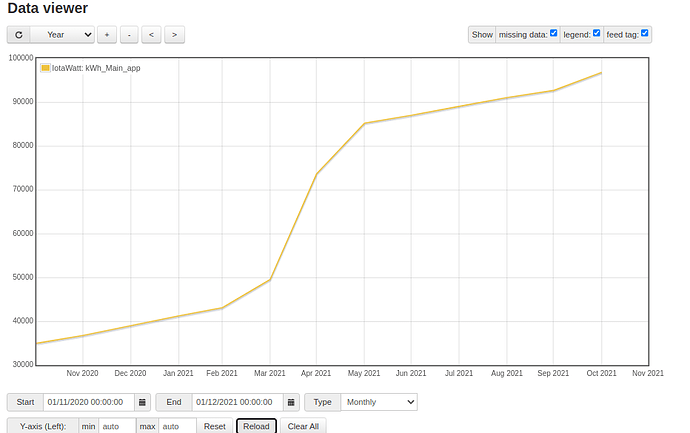
Here’s a screenshot:
The current month November is missing and that is expected within the graph view (as it requires a different calculation). But you should see October.
What feed engine is your kWh data stored as? is it PHPFina?
Hi Tristan I can say that the current month was visible on v9, some change along the time made it not display the current month.
Why would you not display it if you have the data available anyway?
Thanks @Ryan_S you can check the engine on the feeds page, just right of the padlock icon (public/private indicator).
Great, thanks, ok the feed engine is fine and the input process (accumulator) does fill in data gaps that could cause the issue you are seeing, I will have to dig a bit deeper here to see if I can find a way to replicate this.
If you open kWh_main_app in the graph view do you see something like this, are there any visible gaps around the start of November?
If you then select monthly does it show the value at the start of each month, including November by any chance?
@nchaveiro this behaviour is specific for data generated using cumulative kWh input processes and should not be affecting your feeds if you are still using the power_to_kWhd input process. Apps such as My heat pump or my electric have the code required to show the current day using the cumulative kWh data.
I’m working on a potential alternative implementation that integrates the delta mode calculation and addition of the last day into the feed model itself. Which may well be a cleaner approach than having the code to do this in all visualisations and apps.
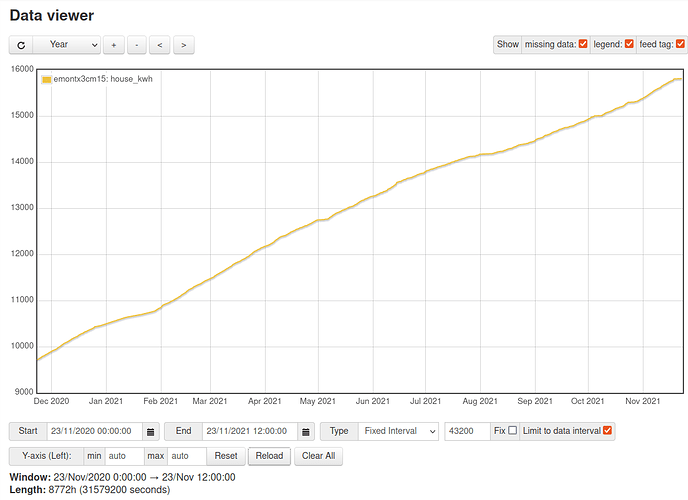
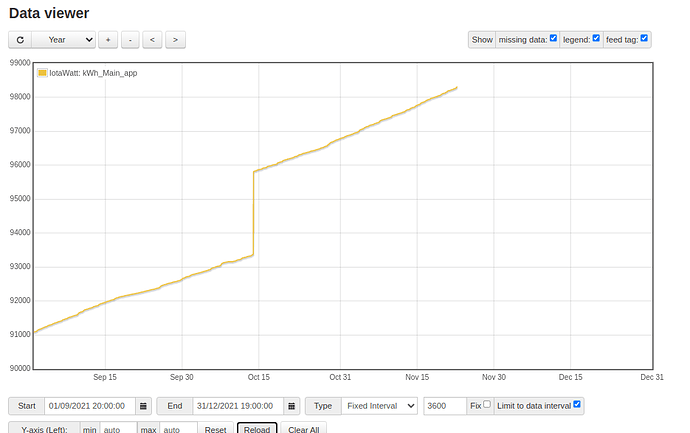
So it looks like there is data shown under fixed interval through November.
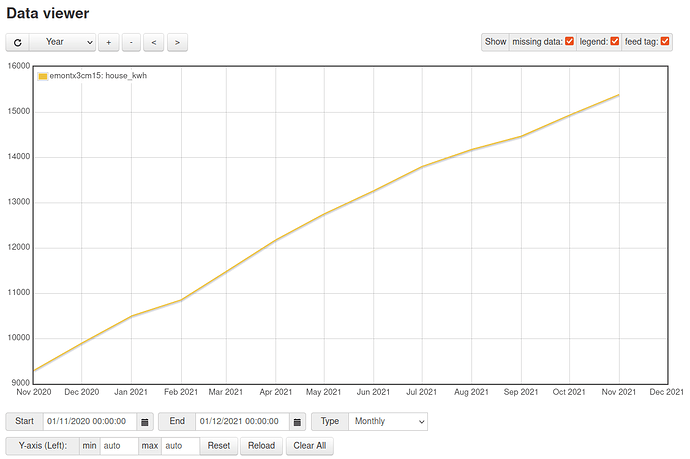
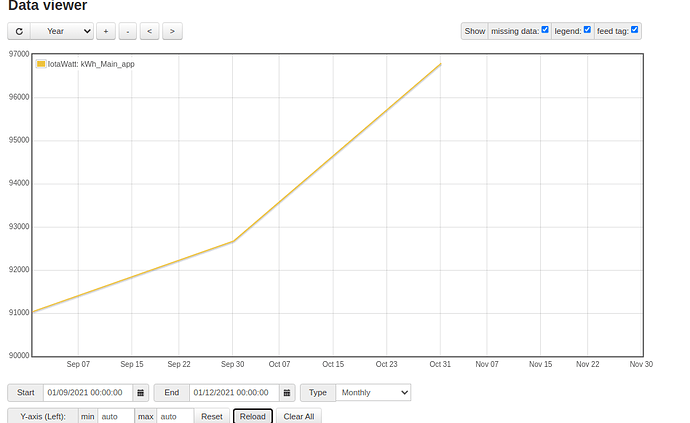
When I change it to monthly it seems to not show November data.
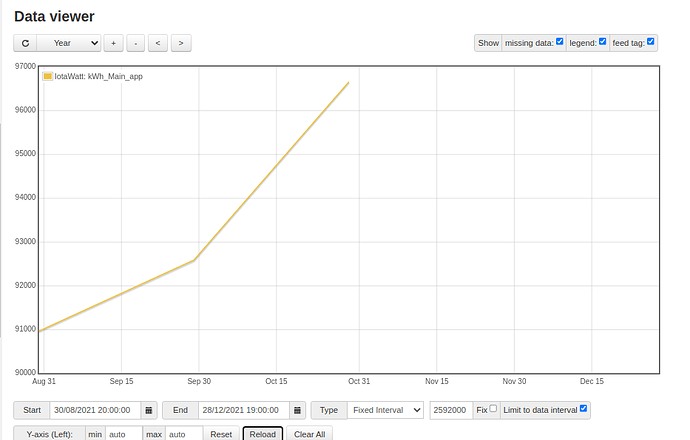
can you move that window so that it shows September through to December?
the interval on that first one is a bit large maybe try 3600, it should automatically work out a suitable interval if you zoom in/out … it would be useful to see the detailed data over that period to see if there is anything strange about it…
First one with 3600.
I should point out that this feed is generated by the WH generation from the IotaWatt. At least the data is sent over in WH and I convert it to kWh. Starting to wonder if how that data is sent over might cause some odd behavior.
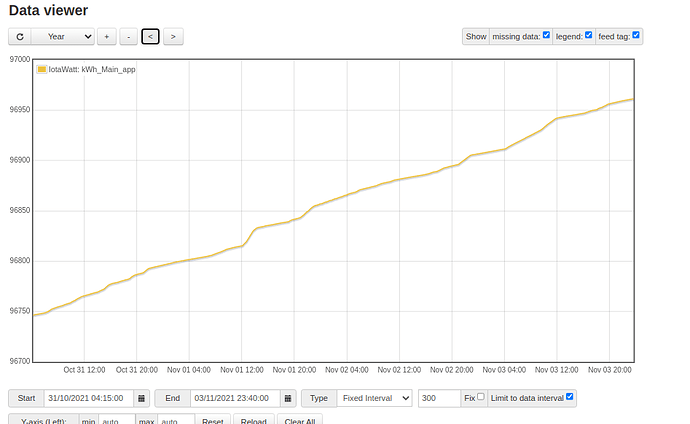
ok looks fine, maybe try zooming in at Nov 1 to see if there is any missing data?
Doesn’t appear to be.
I’m kind of tempted to use the feed that gathers the total house W amount and use Power to kWh function to do this. Just to see if this happens from that. Only problem is I don’t think there is any way to put that in and have the feed calculate from the beginning is there?
Looks fine, yes you can use the post processor module to do this.
Setup > Post process
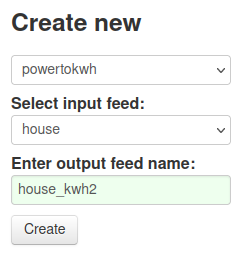
Then towards the bottom, something like this:
