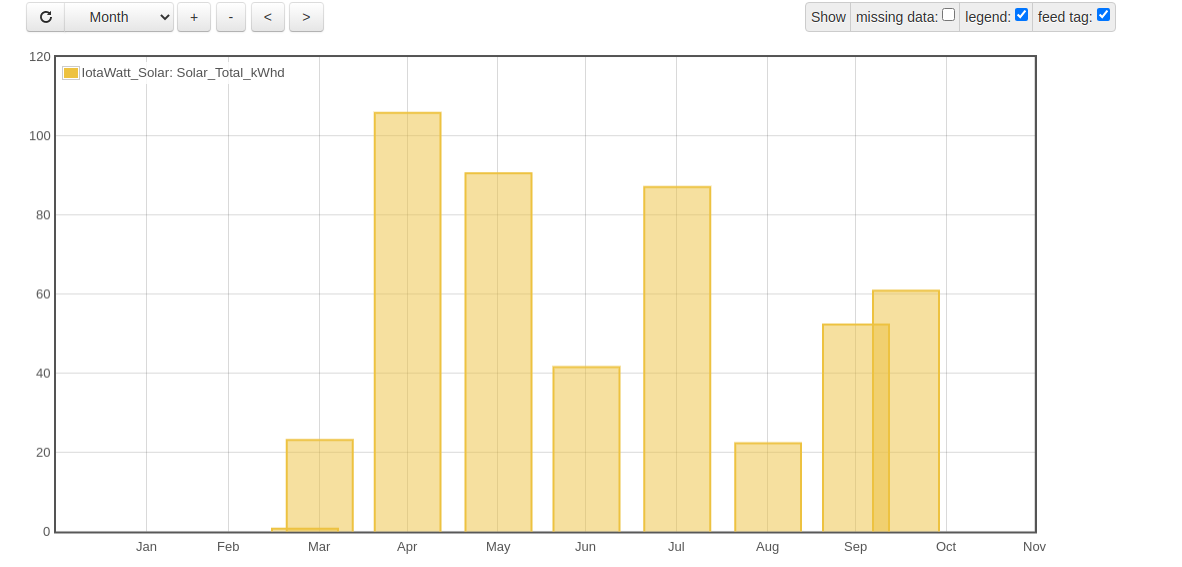
Have a question about graphs creation for use on Dashboards. I’m attempting to produce a graph to show my monthly and maybe even yearly solar production, import, export, and direct use. My issue is with how it displays, for some reason I have the current month overlapping the previous and I can’t figure out how to keep that from occurring. I also have the x (horizontal) axis tends to have the bar graph not aligning with it at times.
@TrystanLea looks like a bug.
FYI, I’ve never seen it do this and I tend to push the graphing pretty hard so you do have something interesting here.
Also FYI Trystan, in case you start by thinking it’s because October hasn’t finished yet, you may not notice that February is also being naughty (because it’s so small).
@Ryan_S Just to help debugging…I’m assuming your dataset starts in February. What date in February was it? (it might help determine the x-axis positioning fun)
Looking at mine, on a hand-built dashboard it looks like the x-axis is OK even though October isn’t finished, so maybe there’s something special about where Ryan is graphing this?
I’m afraid I don’t know how to ask Ryan for more details of the inside of what he’s graphing.

Hello @Ryan_S, what setting do you have for the interval type in the graph view? is it set to monthly?
Your feed name also suggests that it’s kWh per day data? If that is the case, the graph view does not have the ability to convert that to monthly data, it needs to have a cumulative kWh feed that keeps increasing in a similar way to a meter reading to do this…
1 Like
I’ll take a look a little later this morning at it. Just acknowledging I saw the replies.
1 Like
TrystanLea,
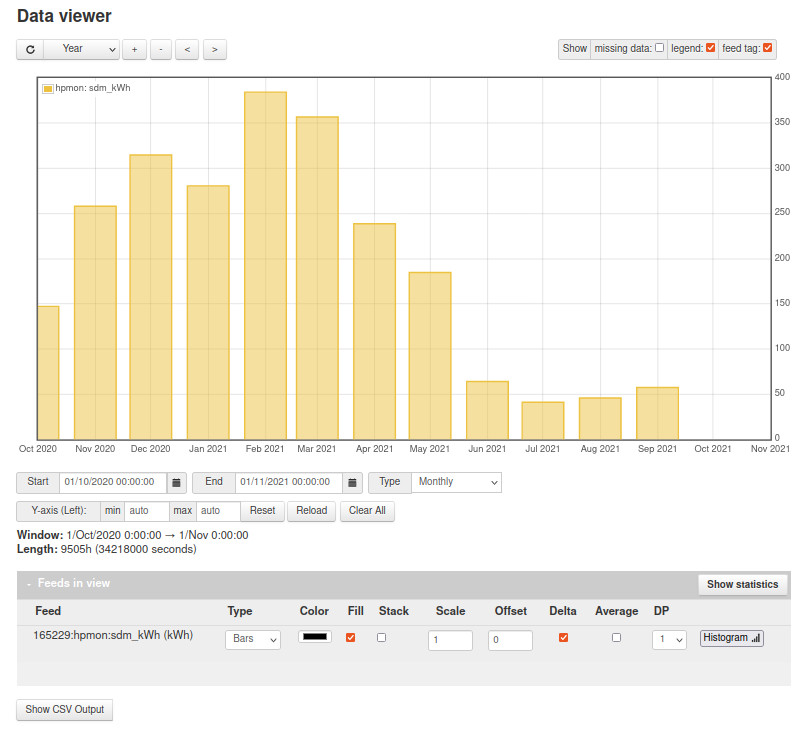
So if I’m understanding you correctly to get this graph to show correctly I should create a Feed to cummitalivly collect the data and use that for the graph display. I’m attached what I currently have and you can see that I have the Power to kWh/d feed for that one.

Yes @Ryan_S , you’ve got it right.
In fact you’ve already got what you need on step 5 - that’s your cumulative total. I have that too.
Note in @TrystanLea 's screenshot that he’s ticked the “Delta” checkbox so it shows the change in the total during that month.
Hope that helps.
Yep, I think Trystan is saying that your daily data won’t graph well on the Monthly type.
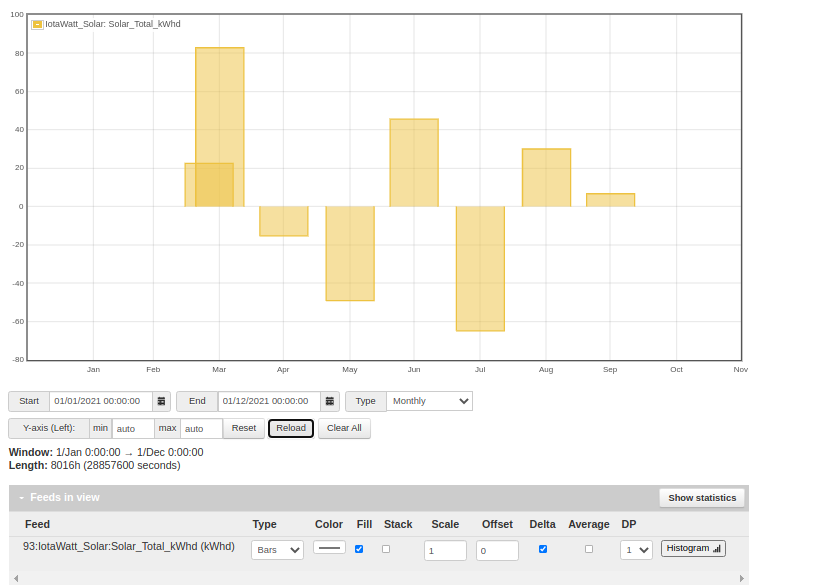
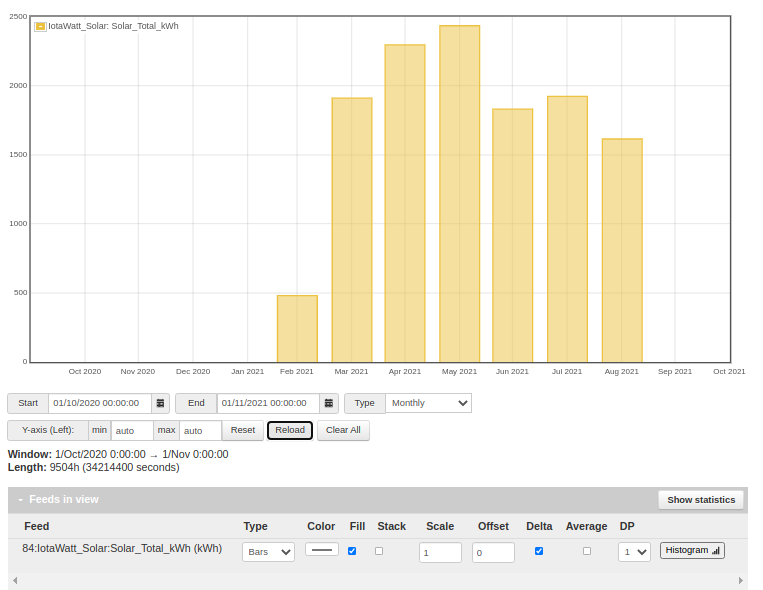
You should use Solar_Total_kWh (not the one ending in “d”).
Let us know how you get along with that.
That seems to work as expected. Interesting, I would have though the kWh/day would be how the graph would want it, but I guess not based on what the underlying workings are. Now, just gotta figure out why Sept is empty.
1 Like
So, a follow on. Managed to figure out what happened to the underlying data and got that fixed.
So, still have an odd issue. For some reason Oct is displaying under Sept.

Have you searched the forum for this? I’m sure I’ve seen this problem before.
Not yet, I thought I saw it as well, but wasn’t completely sure.
Did some searching for this issue to see if anyone else had it and I haven’t been able to find anything.
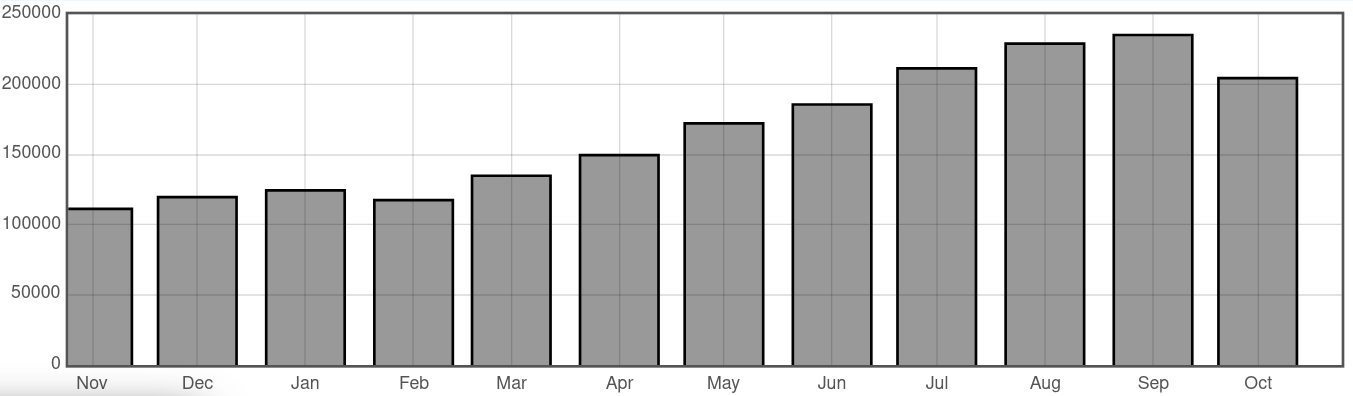
Still hoping someone has the solution for this graph issue. I have my kWh feed for the house listed here. My issue is that the months kWh bars are all one month behind as shown in the picture below. I have tried searching the forum, but can not find anyone who seems to have had this issue or why it is occurring.


This has to be one for @TrystanLea if no-one else has any input.
I’m certain I’ve seen something similar - maybe it’s a problem we thought was solved that has resurfaced.
Hello @Ryan_S do you have your timezone configured correctly on the My Account page? Just checked a monthly graph here and the alignment is correct.
Also have this current month missing. Seems the last month data is not returned on the api call. Maybe something on the engine side.
Timezone does show correct. The data is sent from IotaWatt and I checked it’s time data as well which is correct.