Thanks, that’s useful information.
I hate to be a party-pooper but things may be not that simple @toadhall.
I see the following on the UK Gov website on Heat Meter Accuracy Testing (https://assets.publishing.service.gov.uk/media/5a8050cd40f0b62302692c81/Heat_Meter_Accuracy_Testing_Final_Report_16_Jun_incAnxG_for_publication.pdf) under Vortex Meters (p15):
(Quote:)
- The frequency of vortex shedding is definite and is related to the Reynolds number (flow velocity, viscosity of fluid, and the diameter of the cylinder).
- The frequency of vortex shedding is the same as the vibrating frequency of the cylinder induced by the flow.
If the density and viscosity of the fluid are known and the diameter of the cylinder is given, the frequency measured at the cylinder can be used to represent the flow velocity.
(:Unquote)
I would have inferred from this that both density and viscosity affect the vortex frequency (and thus the apparent flow rate), hence the need for calibration to account for variations in these.
Can you help me understand where I am going wrong in my understanding?
1 Like
There you go …
Maybe the relevant statement is below Equation 6 …
Once the K-Factor is known, the flow rate can be
obtained by measuring the shedding frequency. The
equations also show that volumetric flow rate can be
obtained independently of the fluid properties such
as pressure, temperature, density and viscosity. The
K-factor is only dependent on meter body geometry
I’m not entirely sure what the second bullet point in your quote means. I think it means the bluff body that induces the flow vibrates in some way, but as far as I know the bluff body is just a static cylinder that sheds vortices.
1 Like
I’ve observed a 5kW system maxing out at 100 Hz during a hot-water cycle, and it looks like 8.5 kW systems also peak at 100 Hz.
Edit: My 11.2 kW on Quiet Mode I is limited to 50% and has a maximum frequency of 56 Hz, suggesting a true maximum of 112 Hz.
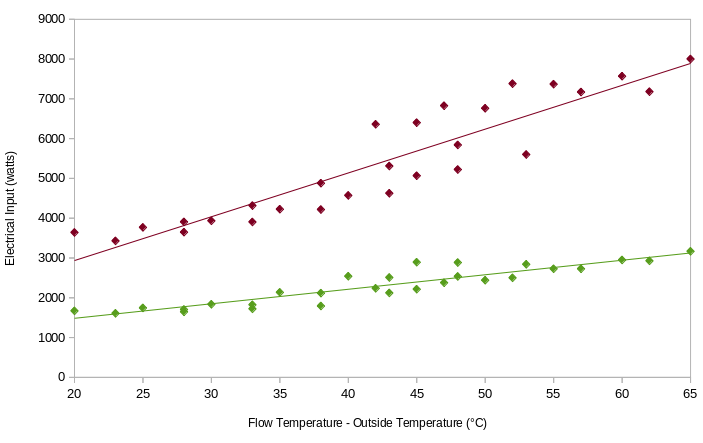
I’ve expanded my analysis to include 6 kW and 14 kW models:
| Model | x Multiplier | + Offset |
|---|---|---|
| PUZ-WM50VHA | 26 | 530 |
| PUZ-WM60VAA | 36.5 | 755 |
| PUZ-WM85VAA | 54.7 | 1062 |
| PUZ-WM112VAA | 68.2 | 975 |
| PUZ-HWM140VHA | 110 | 734 |
The points from the 14 kW (purple) don’t fit quite as well, but probably close enough.
There was a detailed discussion about glycol vs. metering here:
@SarahH
It takes a careful reading of the Rosemount tech. note. As in all things engineering, it’s an approximation and a compromise. On page 3, they say:
Strouhal Number
The Strouhal Number is a dimensionless number
which is a function of the size and shape of the
shedder. By selecting the appropriate shedder
design, the Strouhal number remains constant over a
wide range of Reynolds Numbers.
So it’s a variable constant – but minimally variable. ![]()
Nope. Again looking at the Rosemount tech. note, on P.6, there’s an illustration and the shedder is on a flexible mount embodying a strain gauge. “When a vortex is generated it creates an area of low pressure on one side of the shedder. The low pressure zone causes the flexure in the shedder to move. The flexing motion is transferred to the sensor post…”
Yes, but for the range of Reynolds numbers likely to be encountered in fluids found in central heating pipes, from an engineering perspective (how do I measure this flow) the Strouhal number is effectively constant. So my original point stands, vortex flow meters do not require re-calibration to measure the volumetric flow rate, unlike Ultrasonic meters, which do.
It depends. For instance here is an Endress+Hauser vortex meter video that works in the way as I expected. The bluff body is fixed and a sensor further downstream detects the vortices.
I’ve implemented the following in a Home Assistant template sensor based on my interpretation of the above. Please let me know if you spot any errors in the implementation.
> {% set characterisation = 26 * states('sensor.hp_temperature_rise') | float(0) + 530 %}
> {% set unit = characterisation / 100 * states('sensor.ecodan_ashp_compressor_frequency') | float %}
> {% if states('sensor.ecodan_ashp_compressor_frequency') | float(0) > 0 %}
>   {% set bop = 250 %}
> {% else %}
>   {% set bop = 0 %}
> {% endif %}
> {% if is_state('sensor.ecodan_ashp_primary_water_pump', 'On') %}
>   {% set pump1 = 36 %}
> {% else %}
>   {% set pump1 = 0 %}
> {% endif %}
> {% if is_state('sensor.ecodan_ashp_water_pump_2', 'On') %}
>   {% set pump2 = 36 %}
> {% else %}
>   {% set pump2 = 0 %}
> {% endif %}
> {% set total = unit + bop + pump1 + pump2 + 20 %}
> {{total | round(0)}}
For space heating, power estimates are higher below ~30Hz, but drop significantly above that point.
The power estimate at high load (DHW) looks a lot better (FT=51C - higher than normal to force a cycle - amb=7C) - I watched it complete the cycle and drop to standby and the Octopus Mini showed a near identical power drop. At the time, the original implementation was estimating 2.3kWe. Actual was 1.3kWe.
2 Likes