Error: Could not save Dashboard. undefined

I have a install of EmonCMS on my PI. Everything is working good so far. I’m having trouble with Dashboards. When I create more than a few widgets or containers I’m getting the following error when I try to save my dashboard.

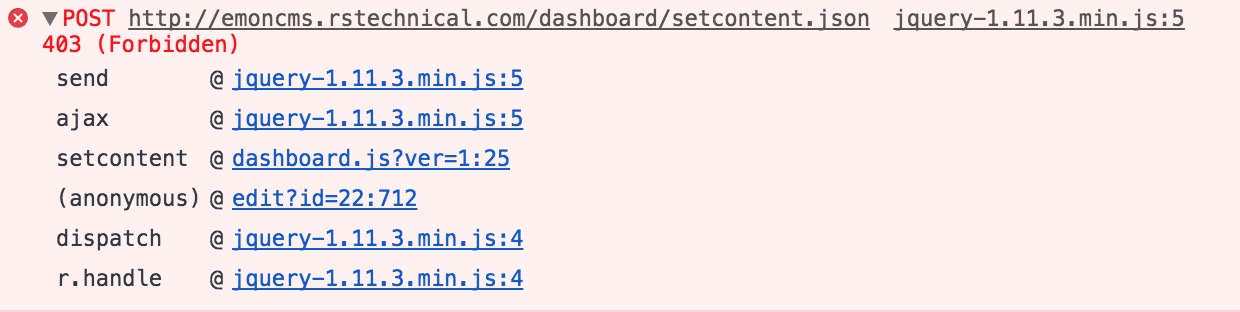
“Error: Could not save Dashboard. undefined.”

I tried removing objects and adding back in and I randomly get the same error. On occasion it will save. I tried reloading my chrome browser and it will work sometimes. Most times it does not work.

At this point I just have about 9 dials and 1 or 2 containers.

I remember getting this but I haven’t seen it in a while.

  1. Check to make sure your PI isn’t out of drive space.
  2. Clear your web browser cache
  3. Use a different web brower
  4. Replace the old “Vis” component with “Graph” component and don’t use “Vis” component on your dashboards.

Can’t remember which one of the above fixed it, or maybe it was a combination of all of them.

I remember I would get that error constantly on my dashboards, it would start filling up /var/log and if I just walked away for 24 hours and came back, the dashboards would display fine without errors and without making changes to them. So I think it might be client-side caching related.

So I did some more testing. It seems like when I create more then a certain number or combination of objects on a dashboard I get this error when saving my creations :wink:

During my testing this limit was reached at:
5 dial
2 container-Blue-Line
6 text heading-center

When I delete an object it let’s me save. This is in chrome. I will try ie, and Firefox and see it it persist.

Tested out on IE, and did not have trouble with creating Dashboard objects. I’ll test on my Chrome book to see if I see issues with that too. It maybe a browser issue with the version I have installed.

Updated: found that I could not update from work. At home I am able to do so with out any errors.

Hello - I am having the same issue but only when I attempt to use a visualization on one of my pages. I can add widgets all day long, but ANY of the visualizations gives me the “Could not save Dashboard: undefined” error.

This is not running on a pi but rather an ubuntu box. Something must have changed since I have many dashboards with a lot of visualizations and this just seemed to crop up after I added some new feeds with some new sensors.

I have plenty of drive space, so that is not an issue either. Tried Chrome and Firefox, same issue with both of them. Tried IE on my daughter’s WIN10 box, same thing.

The issue exists both for existing dashboards and if I make a new dashboard.

I am running 9.7 on Ubuntu 16.04LTS

@richard have you tried emoncms.org ?

A word of caution: emoncms.org is not the same as the download, so some things you can do with the downloaded version aren’t available at the OEM hosted version. That might be a restriction you can live with, or not.

@GeorgeB I did initially but as @Robert.Wall has pointed out, there are a lot of differences and I have made a lot of changes to some of the code to reach out and do other things so I need to stay hosted on my own server.

The thing is that this has run fine for several years and I have not had to make any changes but I added some additional sensors and water flow meters to our pol system and wanted to make a new dashboard and now it will not let me!!

humm…Still not having any luck with updating or creating new graphs. I can still use dial, etc…

Hoping someone had a thought…

Do you see any errors reported in your browser? (press F12 and reload Ctrl+F5)

Paul

Due to a problem with the inability to update any dashboards (see here) I decided to upgrade to the latest version of EmonCMS.

I am on a self-hosted platform running Ubuntu 16.04LTS.

The upgrade went well, everything seems to be working which was nice. So I decided to go into one of my dashboards and try to make changes. Unfortunately when I click the gear icon button in the upper right corner I get a little toolbox menu but no way to add, remove, change, etc any items on my dashboards.

So I decided to try and create a new dashboard. Same results. I get the little toolbox but I cannot do anything else. Going back to github and reading the docs does no good as the example screenshots do not look anything like the new screens.

Rolling back to the 9.7 version fixes part of my issues in that I can create new dashboards but not with a graph as outline in the post I linked to above.

Any help would be greatly appreciated.

Thanks

@Paul - Both before and after the upgrade I am seeing the same error:

This only happens when attempting to add/modify a graph of some sort. I can add/remove/modify anything else but a graph so long as it is not on a dashboard with an existing graph, then I cannot modify the page at all. I get the error above.

If I create a new dashboard, I can do anything I like so long as it does not have a graph on it.

I have checked the ownership of the file structure (www-data:www-data in my case) so I would not see any reason why it would run some java and then throw a fit on others.

WHen editing a new dashboard, I add a bunch of stuff, save it and view - it all works. I go back in and add a graph, it fails to save.

Thanks

Do you still get the error if you access via Localhost, instead of via your subdomain.

Not sure, my server is about 1,000 miles away from me :slight_smile: so accessing via localhost is not really an option for me in my situation.

I have always had emoncms on my server in the datacenter and just recently started having this issue although truth-be-told I am not exactly sure when I started having the issue since I had all of my dashboards like I wanted them and had not really modified them until I decided to add some new sensors and change the layout of a few of the dashboards.

I find it odd that it only effects graphs. If I run down a rabbit hole of a permissions issue with java/js/etc then you would assume that it would affect the entire dashboard (gauges, etc) instead of just graphs or pages with graphs on them.

FWIW I did run through the apache configs for the website and didn’t see anything that would lead me to believe the problem was specific to an apache directive. I also checked ownership of the files, permissions, etc.

Of course, in the end I did an upgrade to the latest version, all with the same results.

I also just tried publishing the page and making it public to see if it that would help…no dice…

any chance PHP version changed or nginx was installed over Apache ?

Hi Eric

It is possible that PHP has changed versions but not trains. I am still running in the 5 train as opposed to 7. I also keep Apache up to date. This is a production server with a lot of different sites so I keep it up to date as much as possible.

Nginx is not installed on the server.

Richard, do you have access to the MYSQL database? if so, take a look at the dashboard table and see how that looks.
The reason I asked about localhost access, is that the difference between graphs & the other widgets in dashboards is that ‘graphs’ are drawn from src, such as src="/emoncms/vis/multigraph and just wondered how that url looks in your MYSQL.

For example, I’ve pasted below the MYSQL contents from my ‘test’ dashboard which contains a graph, which may make my point clearer;

<div id="1" class="dial" style="position: absolute; margin: 0px; top: 60px; left: 60px; width: 300px; height: 160px;" feedid="2" max="5000" scale="1" units="W" decimals="-1" offset="0" type="12" graduations="1" unitend="0" displayminmax="0" minvaluefeed="2" maxvaluefeed="2"><canvas id="can-1" width="300" height="160"></canvas><div id="can-1-tooltip-1"></div><div id="can-1-tooltip-2"></div></div><div id="2" class="multigraph" style="position:absolute; margin: 0; top:140px; left:400px; width:400px; height:300px;" mid="1"><iframe frameborder="0" scrolling="no" marginheight="0" marginwidth="0" src="/emoncms/vis/multigraph?embed=1&amp;mid=1" style="width: 400px; height: 300px;"></iframe></div><div id="3" class="battery" style="position: absolute; margin: 0px; top: 40px; left: 840px; width: 160px; height: 240px;" feedid="5" battery_title="battery" max="3" min="0" scale="1" units="V" unitend="0" decimals="-1" offset="0" colour="000000" font="8" fstyle="2" fweight="0" battery_style="1"><canvas id="can-3" width="160" height="240"></canvas></div><div id="4" class="feedvalue" style="position:absolute; margin: 0; top:300px; left:860px; width:120px; height:60px;" feedid="13" colour="000000" font="9" fstyle="2" fweight="1" units="V" decimals="-1" size="14" unitend="0"><canvas id="can-4" width="120" height="60"></canvas></div>

Hi Paul -

Yes I do have access to the MySQL database. Sorry this is so long, but this one of my smallest dashboards and Here is what one of my graphs looks like:

<div id="15" class="rawdata" style="position: absolute; margin: 0px; top: 0px; left: 0px; width: 660px; height: 
260px;" feedid="131" colour="0433ff" units="F" dp="2" scale="" fill="1"><iframe frameborder="0" scrolling="no" 
marginheight="0" marginwidth="0" src="/vis/rawdata?
embed=1&amp;feedid=131&amp;colour=0433ff&amp;units=F&amp;dp=2&amp;scale=&amp;fill=1" style="width: 
660px; height: 260px;"></iframe></div><div id="16" class="jgauge" style="position: absolute; margin: 0px; top: 
100px; left: 40px; width: 120px; height: 120px;" feedid="131" scale="" max="100" min="50" units="F"><canvas 
id="can-16" width="120" height="120"></canvas></div><div id="17" class="heading-center" style="position: 
absolute; margin: 0px; top: 180px; left: 460px; width: 200px; height: 40px;">Living Room</div><div id="18" 
class="rawdata" style="position: absolute; margin: 0px; top: 260px; left: 0px; width: 660px; height: 260px;" 
feedid="116" colour="0433ff" units="F" dp="2" scale="" fill="1"><iframe frameborder="0" scrolling="no" 
marginheight="0" marginwidth="0" src="/vis/rawdata?
embed=1&amp;feedid=116&amp;colour=0433ff&amp;units=F&amp;dp=2&amp;scale=&amp;fill=1" style="width: 
660px; height: 260px;"></iframe></div><div id="19" class="heading-center" style="position: absolute; margin: 0px; 
top: 440px; left: 540px; width: 120px; height: 60px;">Attic</div><div id="20" class="jgauge" style="position: 
absolute; margin: 0px; top: 360px; left: 40px; width: 120px; height: 120px;" feedid="116" scale="" max="160" 
min="40" units="F"><canvas id="can-20" width="120" height="120"></canvas></div><div id="21" 
class="multigraph" style="position: absolute; margin: 0px; top: 520px; left: 0px; width: 660px; height: 260px;"  
mid="3"><iframe frameborder="0" scrolling="no" marginheight="0" marginwidth="0" src="/vis/multigraph?
embed=1&amp;mid=3" style="width: 660px; height: 260px;"></iframe></div><div id="22" class="heading-center" 
style="position: absolute; margin: 0px; top: 700px; left: 520px; width: 120px; height: 60px;">AC Ducts</div><div 
id="26" class="jgauge2" style="position: absolute; margin: 0px; top: 620px; left: 40px; width: 120px; height: 120px;" 
feedid="101" feedid2="100" scale="" max="115" min="50" units="F"><canvas id="can-26" width="120" 
height="120"></canvas></div><div id="27" class="rawdata" style="position: absolute; margin: 0px; top: 780px; left: 
0px; width: 660px; height: 260px;" feedid="117" colour="0433ff" units="F" dp="2" scale="" fill="1"><iframe 
frameborder="0" scrolling="no" marginheight="0" marginwidth="0" src="/vis/rawdata?
embed=1&amp;feedid=117&amp;colour=0433ff&amp;units=F&amp;dp=2&amp;scale=&amp;fill=1" style="width: 
660px; height: 260px;"></iframe></div><div id="28" class="heading-center" style="position: absolute; margin: 0px; 
top: 960px; left: 540px; width: 100px; height: 60px;">Kitchen</div><div id="29" class="jgauge" style="position: 
absolute; margin: 0px; top: 880px; left: 40px; width: 120px; height: 120px;" feedid="117" scale="" max="100" 
min="60" units="F"><canvas id="can-29" width="120" height="120"></canvas></div><div id="30" class="rawdata" 
style="position: absolute; margin: 0px; top: 0px; left: 660px; width: 680px; height: 260px;" feedid="104" 
colour="0433ff" units="F" dp="2" scale="" fill="1"><iframe frameborder="0" scrolling="no" marginheight="0" 
marginwidth="0" src="/vis/rawdata?
embed=1&amp;feedid=104&amp;colour=0433ff&amp;units=F&amp;dp=2&amp;scale=&amp;fill=1" style="width: 
680px; height: 260px;"></iframe></div><div id="31" class="heading-center" style="position: absolute; margin: 0px; 
top: 180px; left: 1220px; width: 80px; height: 60px;">Outdoor</div><div id="32" class="jgauge" style="position: 
absolute; margin: 0px; top: 100px; left: 700px; width: 120px; height: 120px;" feedid="104" scale="" max="120" 
min="30" units="F"><canvas id="can-32" width="120" height="120"></canvas></div><div id="33" class="rawdata" 
style="position: absolute; margin: 0px; top: 260px; left: 660px; width: 680px; height: 260px;" feedid="119" 
colour="ff2600" units="F" dp="2" scale="" fill="1"><iframe frameborder="0" scrolling="no" marginheight="0" 
marginwidth="0" src="/vis/rawdata?
embed=1&amp;feedid=119&amp;colour=ff2600&amp;units=F&amp;dp=2&amp;scale=&amp;fill=1" style="width: 
680px; height: 260px;"></iframe></div><div id="34" class="jgauge" style="position: absolute; margin: 0px; top: 
360px; left: 700px; width: 120px; height: 120px;" feedid="118" scale="" max="130" min="30" units="F"><canvas 
id="can-34" width="120" height="120"></canvas></div><div id="35" class="jgauge" style="position: absolute; 
margin: 0px; top: 360px; left: 700px; width: 120px; height: 120px;" feedid="119" scale="" max="130" min="30" 
units="F"><canvas id="can-35" width="120" height="120"></canvas></div><div id="36" class="heading-center" 
style="position: absolute; margin: 0px; top: 440px; left: 1120px; width: 200px; height: 60px;">Electrical Panel</div>
<div id="38" class="rawdata" style="position: absolute; margin: 0px; top: 520px; left: 660px; width: 680px; height: 
260px;" feedid="147" colour="0433ff" units="F" dp="2" scale="" fill="1"><iframe frameborder="0" scrolling="no" 
marginheight="0" marginwidth="0" src="/vis/rawdata?
embed=1&amp;feedid=147&amp;colour=0433ff&amp;units=F&amp;dp=2&amp;scale=&amp;fill=1" style="width: 
680px; height: 260px;"></iframe></div><div id="39" class="jgauge" style="position: absolute; margin: 0px; top: 
620px; left: 700px; width: 120px; height: 120px;" feedid="147" scale="" max="130" min="30" units="F"><canvas 
id="can-39" width="120" height="120"></canvas></div><div id="40" class="heading-center" style="position: 
absolute; margin: 0px; top: 700px; left: 1220px; width: 100px; height: 60px;">Garage</div><div id="41" 
class="rawdata" style="position: absolute; margin: 0px; top: 780px; left: 660px; width: 680px; height: 260px;" 
feedid="149" colour="0433ff" units="F" dp="2" scale="" fill="1"><iframe frameborder="0" scrolling="no" 
marginheight="0" marginwidth="0" src="/vis/rawdata?
embed=1&amp;feedid=149&amp;colour=0433ff&amp;units=F&amp;dp=2&amp;scale=&amp;fill=1" style="width: 
680px; height: 260px;"></iframe></div><div id="42" class="jgauge" style="position: absolute; margin: 0px; top: 
880px; left: 720px; width: 120px; height: 120px;" feedid="149" scale="" max="100" min="40" units="F"><canvas 
id="can-42" width="120" height="120"></canvas></div><div id="43" class="heading-center" style="position: 
absolute; margin: 0px; top: 960px; left: 1180px; width: 140px; height: 60px;">Pool Water</div><div id="45" 
class="jgauge" style="position: absolute; margin: 0px; top: 20px; left: 1380px; width: 160px; height: 160px;" 
feedid="263" scale="" max="100" min="0" units="%"><canvas id="can-45" width="160" height="160"></canvas>
</div><div id="47" class="heading-center" style="position: absolute; margin: 0px; top: 180px; left: 1380px; width: 
160px; height: 60px;">Outdoor
Humidity</div><div id="48" class="jgauge" style="position: absolute; margin: 0px; top: 300px; left: 1380px; width: 
160px; height: 160px;" feedid="264" scale="" max="100" min="0" units="%"><canvas id="can-48" width="160" 
height="160"></canvas></div><div id="49" class="heading-center" style="position: absolute; margin: 0px; top: 
460px; left: 1380px; width: 160px; height: 60px;">Indoor
Humidity</div>

And here is the dashboard itself:

Do you see anything unusual? When I ran the upgrade I made sure to update the database as well form the admin panel.

Thanks!

Well the only thing that I can see different, is the src of the rawdata graph url.

Your url is;
src="/vis/rawdata
whilst mine is;
src="/emoncms/vis/rawdata

Don’t know if that’s significant?

I imagine that is has to do with the fact that I have my emoncms installed as a stand-alone website as opposed to a sub-url:

http://emoncms.rstechnical.com vs somedomain.com