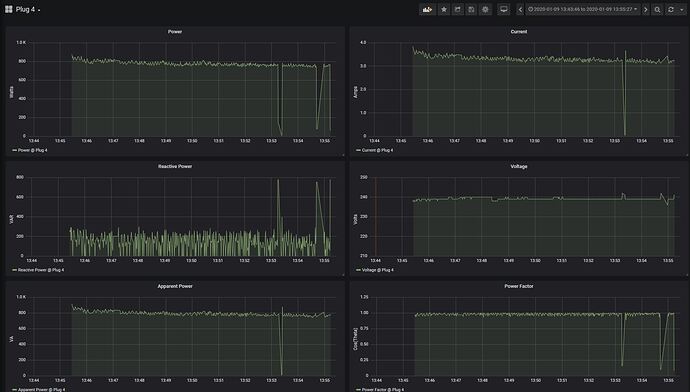
There doesn’t appear to have been a lot of discussion of disaggregation on this community, I managed to find a couple of threads that touched on it, in the live and archived discussions, so I thought I would start one. I noticed @jack-list is out there somewhere, he would probably be the most expert on the subject, are there any others out there with an interest @Niklas @bidouilleur @Martin_Harizanov @Paul_Cardelli for example? Has anybody experimented with putting current clamps on each of the consumer unit circuits, and 1 second frequency for monitoring. This perhaps makes the specific problem of understanding what is happening in an individual house a bit easier to solve. I have tried a 1 clamp solution, but there is too much going on so I am planning to try one per circuit with some bespoke hardware, but integrated into Emoncms. Any thoughts?
Yeh there are a few of us that have done that…
You don’t need 1 sec resolution thou as problems happen but 5 secs has been ok for me.
Regards
Dave
@Dave nice panel, did you learn anything useful, did you get any analysis below the circuit level i.e. do you have appliance usage patterns etc?
Here’s a couple more threads about it:
I’ve started to take an interest in this, as a possible capability of IotaWatt to some degree. The device currently takes about 38 high resolution samples (650 sample pairs) per second. (That’s about 30 channels per second with about 780 sample pairs per cycle at 50Hz). At present they are evenly distributed over however many active channels are being monitored - up to 14.
I’ve been giving some thought to the notion of preferential treatment for specific channels, and with respect to this capability - more frequent sampling of the mains. So in particular where there is a single main, the main could be sampled say every 4th time so it would be sampled up to 8 times per second, while the others would sample close to twice per second. There is enough time between samples to process and organize the mains data.
But I don’t really know what’s required. I have high resolution data of individual cycles, and could put together a profile of the main with 8 samples per second. There is about 6-7ms available between sampling that is mostly unused. The ESP8266 is an 80Mhz 32 bit machine with pretty fast floating point, so are these algorithms in that class or do they need something like a graphics processor?
The ESP32 is also a potential migration path. The processor is about the same speed but it has two cores, so there is the potential to do a lot of processing in parallel to the sampling.
I have an experimental device which sits as a small daughter board on the RPi which currently uses an STM8Lxx processor with 10 ADC channels (1 used for voltage) the other 9 for current clamps. Currently it will spit out the 10 readings every 100ms or so (having taken many more to get the averages), I then average this down to 1 set per second to feed to via MQTT to emoncms (not tested yet). If this works OK it is going to be relatively simple to produce a stand alone board with a better processor (STM32Lxx probably) and a radio chip, that would run stand alone on a battery, USB or leached power.
In many respects collecting the data is an easy bit the hard bit is analysing the appliance activity from the data. I have tried to do this in the past using 1 second data from the house supply rather than individual circuits. I have spent a long time staring at the graphs, and there is too much going on, hence the new circuit based approach.
Hi Dave,
A very nice panel.
In the panel screenshot you seem to measure things like the Cooker, Shower, Down Lights, Sockets, Lights.
What is the unit you are measuring ?
How do you measure this ? Are you doing some disaggregation ?
kr Jan.
Hi Jan
I have several EmonTx’s over my house, 3x in the house on the main DB, 1x EmonPI in the loft and 2x EmonTx’s in the workshop.
I have several CTs measuring the power on nearly all of the final circuits, from that i mesure the following…
Individual circuits…
- Cost per Hour
- Cost per Day
- KWh per Day
- Current Usage in Watts
Overall System Figures
- Individual Solar Array Generation (Current generation, KWh Day, FIT Earned & System Performance)
- Above but Generation in total
- Generation Utilisation, KWh of consumed energy, Percentage of energy consumed and money saved by not buying the electric.
- Carbon Score - This takes the demand vs amount generated. IE in the summer months I’m carbon neutral.
- Demand - Total demand of electricity consumed in KWh and current Amps
- Supply Data - Import KWh and Cost
- Supply Data - Export KWh and Percentage of energy that was generated but exported (Wasted)
- Gas - Cubic Value, KWh and Cost
- Water - Cubic Value, Litres and Cost
- Costs - FIT Revenue, FIT Revenue plus Energy Savings, Total of FIT Revenue Plus Savings Minus Import Cost.
- Traffic Lights - This is the available spare generation capacity plus any diverted to immersion energy, this is to tell the Mrs when to switch on the white things in the kitchen as when diverting energy to the immersion heater you shouldn’t have any exported energy.
I have a very complex setup with 3x solar arrays getting FIT and plans to install a fourth one without getting any FIT, that will be connected to my submain going out to my workshop so there’s a lot of calculations to work out demand in the house and workshop, once the additional array is installed my submain will be feeding back to the house.
Regards
Dave
@overeasy my son and I have been testiing and fixing the experimental 9 clamp power monitor for the last couple of days, so I now have a view what it can do timings wise. ADC read is an average of 16 h/w counts we then sample for 8 crossings to get a reading, all 9 current clamps and the voltage are measured in the same period, and we can get the set of readings at about 11.8 Hz.so approx 10 readings per second. For the purposes of interfacing with OEM these readings will be turned into 1 second (and possibly 10 Second) averages.
Differences in traces between 1 second an 10 second granularity
For device identification averaging over ten seconds makes device identification difficult, particularly when more than one device is changing state at the same time.
Here is an example of a trace from an oil filled radiator being switched between levels:
First at 10 second granularity:
Note the slopes, making it quite difficult to get the timings and actual power levels.
Then at 1 second granularity
On the second trace you get relatively clear power levels
- Off
- Level1
- Level 1 & 2
- Level 2
- Off
- Level 1 & 2
It is reasonably easy to deal with the transitional spikes
Are they not part of the information you need to differentiate between loads that are otherwise too close to call?
@Robert.Wall Yes that is true, but probably worth deferring until identification of dissimilar devices is working well, as it is a more advanced topic.
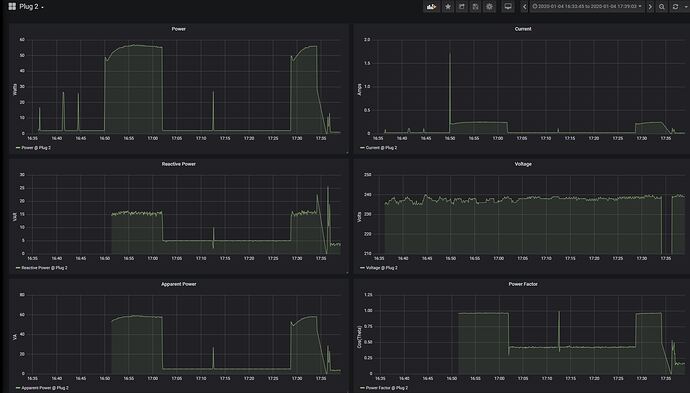
Hi Robert, further to my last reply a couple of years ago, I now have energy monitoring plugs in place, and have signatures for the major household appliances, in order of increasing complexity (fridge, tumble drier, dishwasher and washing machine). Here is the simplest one as an example…
The short spikes are the door being opened so the light comes on, the wider blocks are the compressor running.
That level of detail certainly looks promising.
And now, I suspect the really complicated part starts: characterising that data so that each device can be recognised with an acceptable level of certainty, even in the face of external influences, like system voltage fluctuations, and then doing the same thing when you have the signatures of several devices overlapping. That appears to be the Holy Grail that everyone involved in this work is seeking.
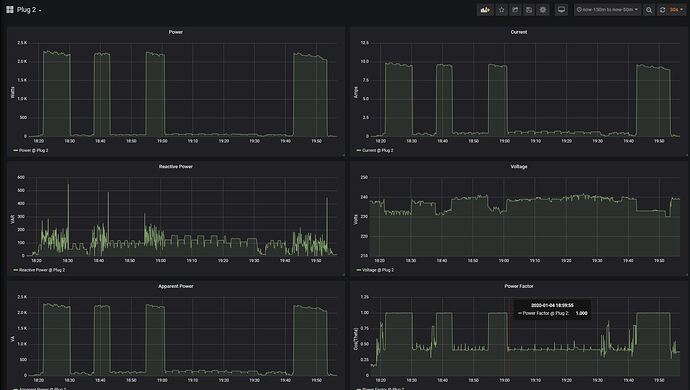
Robert, that was a simple one, the washing machine is a corker
The big spikes are heating the water, the ramped ones are spin at different speeds, and the bit in the middle is drum rotation at slower speeds (and if you look you could probably find valves etc.) I think the spiky hair on the top of the heating towers is the drum rotating. Not a square waveform to be found.
I looked at a kettle and discovered that the consumption changed with temperature as the water heated (Ohms law!) so event that is more complex than expected. I guess this is why the academics are all using deep learning systems to do it.
I noticed earlier that your fridge behaves quite differently to mine - mine show a big inrush spike, then the power/current falls slowly - as the copper in the motor heats up. But my washing machine looks much more like yours, with the motor power all over the place as it stops and starts, forward & reverse. The only time it’s relatively constant is the spin cycle at the end.
I’d put that down to the thermal coefficient of resistance (of the nichrome element) that causes the change in the current, via Ohm’s Law.
What you’ve got to be aware of is there are roughly two types of load you’ll generally encounter: the “mostly resistive” type, heaters usually, their current is roughly proportional to voltage (with second-order temperature effects as you’ve noted), and “constant power” types, mostly electronic appliances, where the current is roughly inversely proportional to voltage - because they use regulated power supplies and require (roughly) the same power that’s not related to the supply voltage.
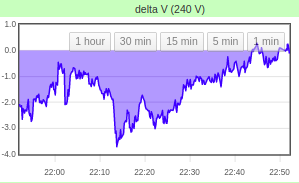
If you have a mains supply like mine, you’ll understand the significance of that. Here’s the change from the nominal 240 V for the last hour:
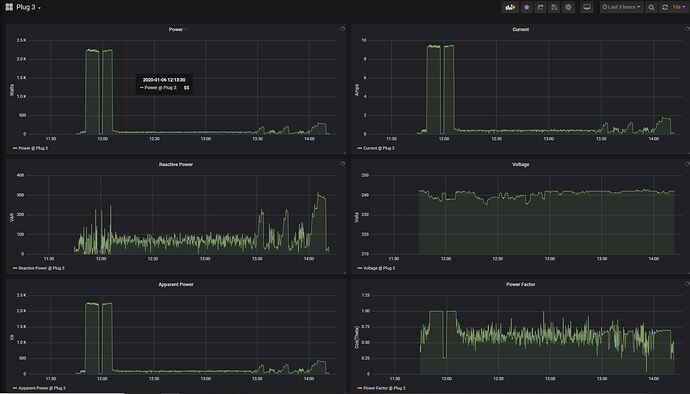
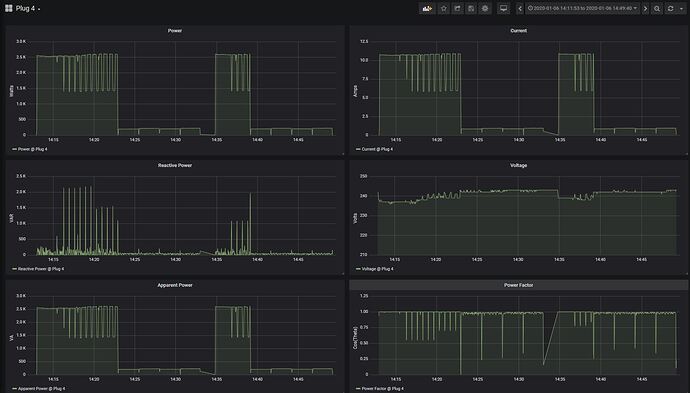
Yes, I capture the reactive power as well on the graphs (first column second row) more examples, Dishwasher
Tumble dryer
Vax carpet cleaner
I had a discussion with my son yesterday about the voltage fluctuation, in my case it is an artefact of where the plug measures the voltage (after the shunt) which means it will be affected by the power being drawn. If the voltage is measured independently at the house meter, it will only fluctuate when the supply voltage changes. Where was your measurement taken?
Motors tend to have a reactive element, heaters don’t.
On the in-rush current spike, I guess they have done something to prevent that on modern (probably brushless) motors. My washing machine is one of those.
It’s effectively on the C.U. busbar, only a very short distance way and there’s no other load on that MCB.
My fridge has a fairly standard induction motor, so a large inrush is expected.
My fridge does something very similar:
But I think that’s the much slower thermodynamic “inrush”: the compressor has a lot more work to do early in the cycle.
By way of comparison, the pool pump always has a nice clean right angle on startup:
and yet its inrush current is enough to dip the lights - or at least was in the days of incandescent lights. When you drill down on that you can see it draws roughly 7x normal current for about 9 cycles:
But 9 cycles out of 500 cycles means it’s pretty heavily dampened in the 10 second energy reporting.
On the rare occasions I do see that signature on the pool pump I know it’s time to replace the starter cap. This is from 2016:
When the starter cap starts to lose its mojo the pump can sit there drawing full locked-rotor current for quite a few seconds and that does show up in the 10 second data. In fact I use it to generate an email event whenever I see more than 1600W on that breaker.
