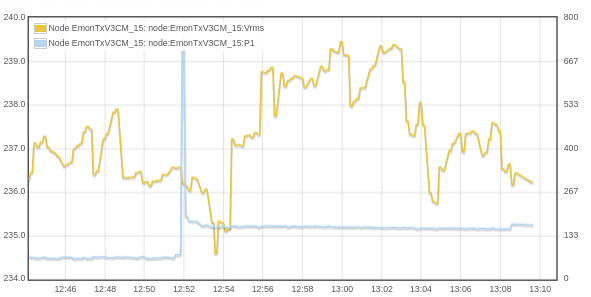
Normally, I see just the resistance change as the windings warm up. but when I’ve been logging at 1 s intervals, I can actually see three effects - the inrush spike followed by the much slower decay as the motor warms, and an even slower ramp as the load comes off over the duration of the ‘on’ cycle. At present, I’m testing emonLibCM and reporting every 1 s but recording only every 5 s, so the laws of natural perversity say I’ll rarely catch the inductive inrush. But I do have a decent example - voltage (brown) is on the left scale and power (blue) on the right scale. The motor warms up over a couple of minutes or so, and one reading shows a peak 5½ times running current. The quiescent value is about 67 W. It hits (733 - 67) W, then the running value is about (165 - 67) W. Then there’s a very slow tilt that’s masked by the rising voltage then helped by the falling voltage (until my emonPi decided to stop receiving.)
![]()
I am also getting into energy disaggregation, however I’ve notice that when am testing my resistive load only am not getting my Irms and Vrms? Eg. Geyser or Kettle I only get Real Power and Apparent power.
However when I test inductive load I do get Irms Vrms PF and Phase Angle.
Can someone help me with that regard.
My experiment setup—my CT is connected to live my DB, and I am also using AC-AC—(both my CT and Ac -Ac adapted are connected to Arduino and I send the results to thingspeak using Esp2866 wifi module.
@chuma_jozi @Robert.Wall
I think that is what’s expected, pure resistive loads shouldn’t have a reactive component. Put something like a fridge on it and you will see a reactive component. Robert is the expert on this.
I don’t understand that at all. Whatever the load, you should always see a voltage - provided of course the a.c. adapter is connected. And when you have a load, you should see all of the values irrespective of the type of load (though the numbers will be different, you will still see numbers).
I don’t think we can help any more given the information you’ve provided so far. Take a look at the FAQ page - there it tells you how to ask a question in a way that will enable us to help you.
Hello everybody,
We are a startup from Austria and over the past two years we have developed software for NILM Non-Intrusive Load Monitoring or NIALM Non-Intrusive Appliance Load Monitoring, a.k.a. Disaggregation. We would be happy if someone of you is interested in developing a module with the functionality for a seamless integration with OpenEnergyMonitor and Watt Analytics.
We have also working solution for SmartPi users.
With free software shown at Watt Analytics anyone who already owns SmartPi could perform device-specific analysis and optimisation of the power consumption.
If you have any questions, please do not hesitate to contact us.
We would love to hear your feedback.
Be advised that we do not like cross-posting, i.e. several posts with exactly the same content on different threads.
I have deleted 2 copies of the above message, please do not post any more.
Sorry, did not noticed so far, Thanks a lot.
You are welcome to have a discussion here, but it is counter-productive to have comments and contributions in three different places. That is why we do not like multiple copies.
I completely understand that, thanks a lot for your advices and support.
I’m just getting into the energy disaggregation. I have a question —— I need to cluster fridge’s data (power) with EM algorithm(GMM), but the data have some point which be called ‘inrush’. I need to cluster the data to some classes, If I necessarily delete the ‘inrush’ point or do some else? My data comes from REDD.
PLEASE HELP ME!@gjwo
Hi Jemma,
I am not sure what you mean by “cluster”, are you trying to separate the fridge’s component of the power from an aggregate measurement of power for the house? It is possible to remove short duration spikes, but for some methods this might be useful information in working out what you are looking at. I removed spikes in SmartPowerLite/SmartPower.java at master · gjwo/SmartPowerLite · GitHub see case PROCESS_EDGES:
I now have plug power monitors on my major appliances like the fridge and would look to subtract the waveform from the whole house measurement if necessary (which I admit is cheating).
Thanks for your answer!
“cluster” for my project ——
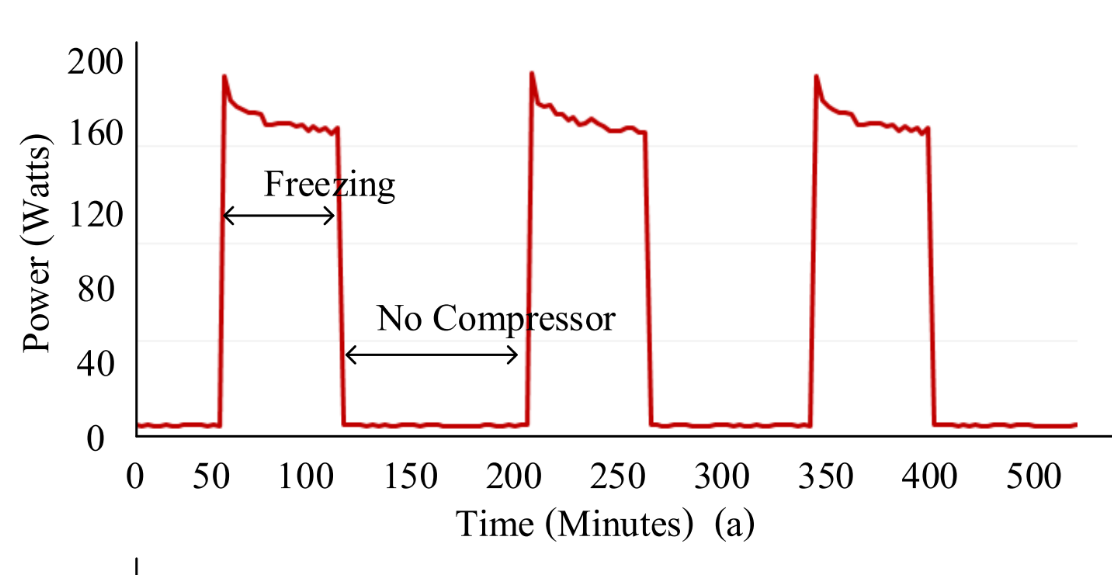
as we all know, fridge is the kind of multi-states appliance. I get the REDD data, and get the fridge data, I want to classify the data of fridge to two kind states like the figure:
However, the data in REDD at the point of ‘inrush’ is very high like this:
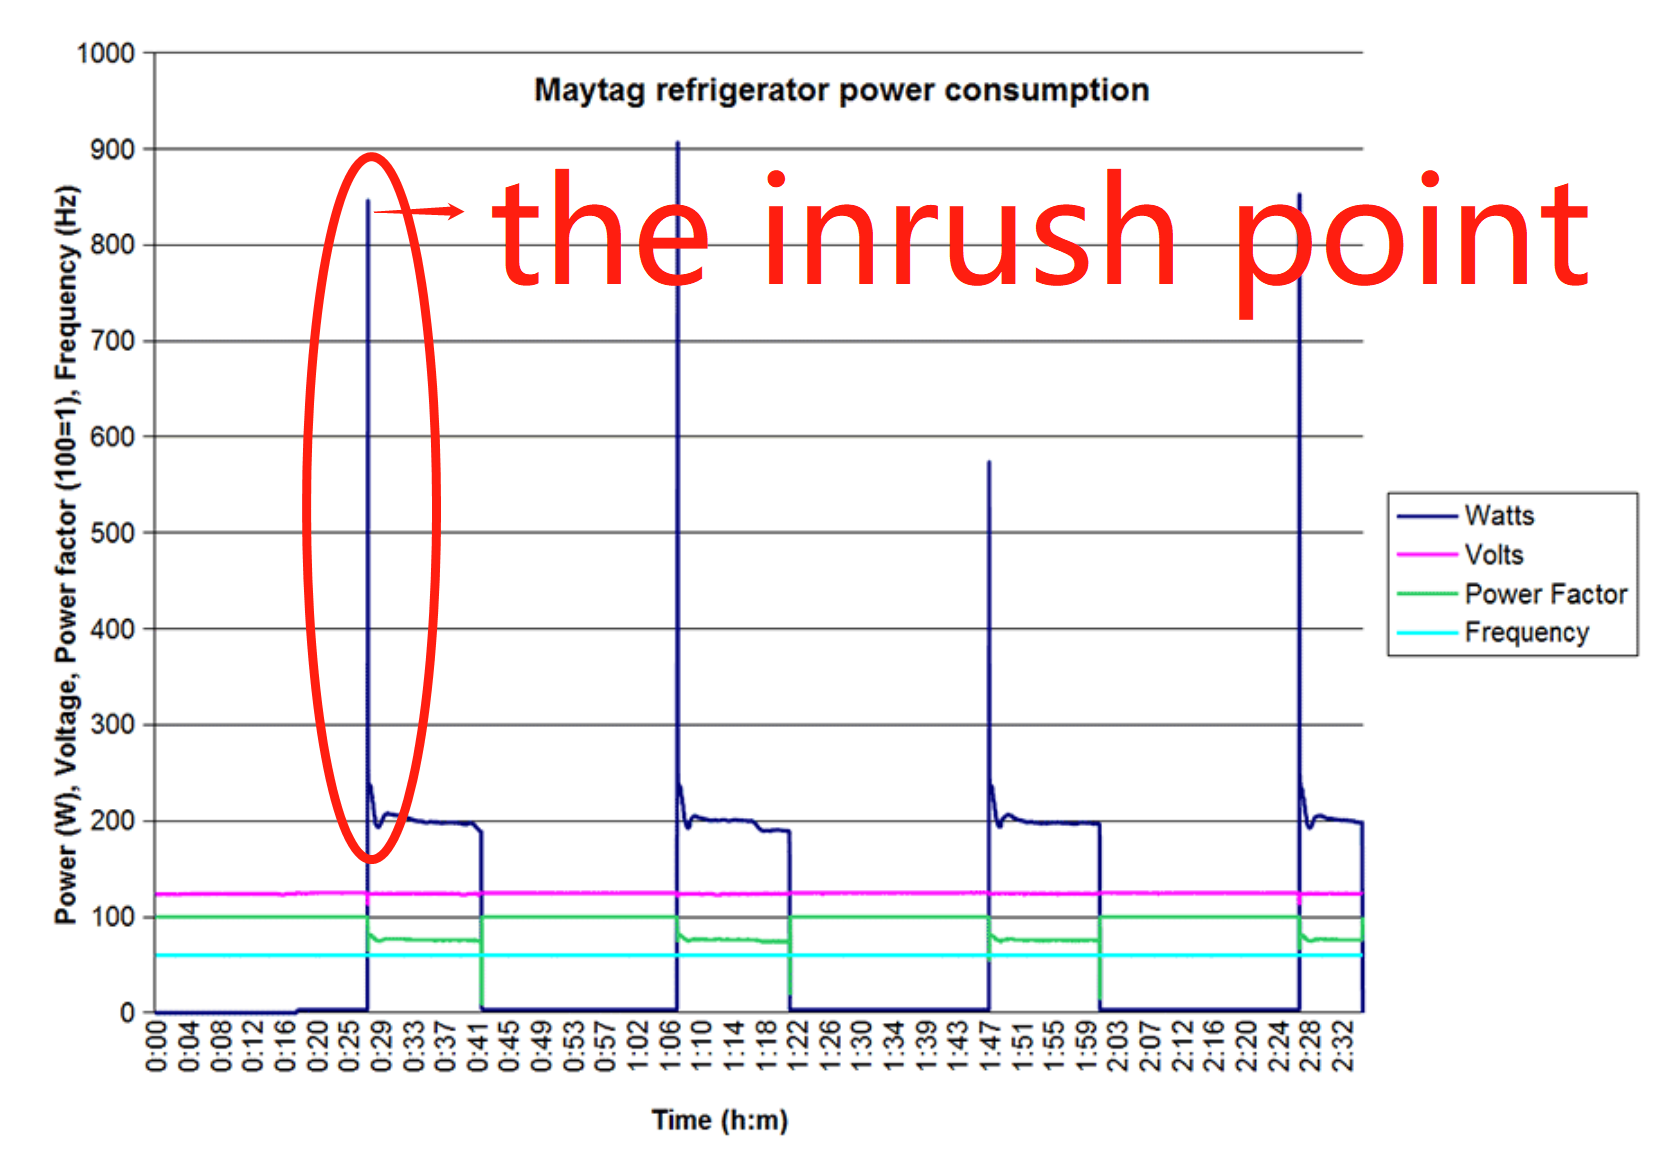
SO, the solution is to remove the spikes(‘inrush’ points)??
@jemma The edge processing will do that for you, assuming your data granularity is short (like 1 second or similar, which seems likely given the height of the spike. I am sure there are better algorithms for doing smoothing or ignoring of spikes, but that one seemed to work for me.
Thank you very much!
There’s an interesting interview with the Sense CEO here. Mike Phillips is well respected in the speech recognition field, and in one of the sweeps across their labs you can see a pretty decent spectrum analyser. I suspect that like the speech guys, the recognition is done in the frequency domain.
Hello everyone,
I am a student working on load disaggregation using a data acquisition device sampling Active Power at 1Hz. I have successfully implemented a few deep learning models for this purpose but none of these seem to give any good results with appliances multiple states especially Fans, Mixer Grinders.
Could anyone provide guidance or point me in the right direction on how to tackle this issue?
Thank you in advance for any help you can provide!