emonPi running very slow - help?!?

Continuing the discussion from Disable OpenHab & Lightwave RF?:

Something odd is going on with my emonPi but I am not sure how to debug it. I thought it may be related to Openhab, Lightwave RF and Java but now I am not sure.

Overall things seem very slow. Slow to login, slow for web pages to load, etc. I’ve rebooted via sudo reboot and via the side switch (5…4…3…2…1… shutdown).

When I login via SSH, the emonPi is very, very slow. It takes ~30 to 45 seconds to respond with a pi@emonpi:~ $ prompt. The emonPi is connected via Ethernet with the USB EdiMax WiFi unplugged.

The df -h seems to return good numbers:

pi@emonpi:~ $ df -h
Filesystem      Size  Used Avail Use% Mounted on
/dev/root       3.4G  1.8G  1.5G  56% /
devtmpfs        483M     0  483M   0% /dev
tmpfs           487M     0  487M   0% /dev/shm
tmpfs           487M  6.6M  480M   2% /run
tmpfs           5.0M  4.0K  5.0M   1% /run/lock
tmpfs           487M     0  487M   0% /sys/fs/cgroup
tmpfs            40M     0   40M   0% /var/lib/openhab
/dev/mmcblk0p1   60M   21M   40M  35% /boot
tmpfs           1.0M     0  1.0M   0% /var/lib/dhcp
tmpfs           1.0M  4.0K 1020K   1% /var/lib/dhcpcd5
tmpfs            50M  3.8M   47M   8% /var/log
tmpfs            30M   12K   30M   1% /tmp
/dev/mmcblk0p3  3.8G  716M  2.9G  20% /home/pi/data
/dev/sda1        59G   52M   56G   1% /mnt/usb
pi@emonpi:~ $ 

 
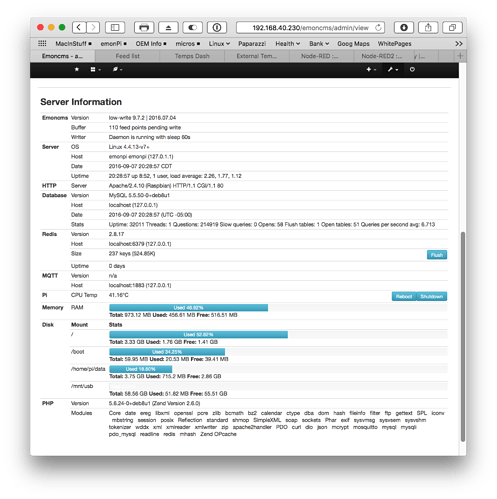
Here is the Server Info web page:

I found this error in the syslog file but the redis-server log file was created and it does have info. So I am not sure if I should worry about the error.

Sep  7 11:35:24 emonpi redis-server[778]: *** FATAL CONFIG FILE ERROR ***
Sep  7 11:35:24 emonpi redis-server[778]: Reading the configuration file, at line 103
Sep  7 11:35:24 emonpi redis-server[778]: >>> 'logfile /var/log/redis/redis-server.log'
Sep  7 11:35:24 emonpi redis-server[778]: Can't open the log file: Permission denied
Sep  7 11:35:24 emonpi systemd[1]: redis-server.service: control process exited, code=exited status=1
Sep  7 11:35:24 emonpi systemd[1]: Failed to start Advanced key-value store.
Sep  7 11:35:24 emonpi systemd[1]: Unit redis-server.service entered failed state.
...
Sep  7 11:35:24 emonpi systemd[1]: redis-server.service holdoff time over, scheduling restart.
Sep  7 11:35:24 emonpi systemd[1]: Stopping Advanced key-value store...

 
here is the redis-server file:

[1296] 07 Sep 21:29:23.140 # User requested shutdown...
[1296] 07 Sep 21:29:23.140 * Removing the pid file.
[1296] 07 Sep 21:29:23.141 # Redis is now ready to exit, bye bye...
[17402] 07 Sep 21:29:23.209 # You requested maxclients of 10000 requiring at least 10032 max file descriptors.
[17402] 07 Sep 21:29:23.210 # Redis can't set maximum open files to 10032 because of OS error: Operation not permitted.
[17402] 07 Sep 21:29:23.210 # Current maximum open files is 1024. maxclients has been reduced to 4064 to compensate for low ulimit. If you need higher maxclients increase 'ulimit -n'.
[17402] 07 Sep 21:29:23.211 # Warning: 32 bit instance detected but no memory limit set. Setting 3 GB maxmemory limit with 'noeviction' policy now.
      _.-``    `.  `_.  ''-._           Redis 2.8.17 (00000000/0) 32 bit
 
 (    '      ,       .-`  | `,    )     Running in stand alone mode
 |`-._`-...-` __...-.``-._|'` _.-'|     Port: 6379
 |    `-._   `._    /     _.-'    |     PID: 17402

[17402] 07 Sep 21:29:23.213 # Server started, Redis version 2.8.17
[17402] 07 Sep 21:29:23.214 # WARNING overcommit_memory is set to 0! Background save may fail under low memory condition. To fix this issue add 'vm.overcommit_memory = 1' to /etc/sysctl.conf and then reboot or run the command 'sysctl vm.overcommit_memory=1' for this to take effect.
[17402] 07 Sep 21:29:23.215 * The server is now ready to accept connections on port 6379

I dont know what redis does as part of the emon system so I decided not to make the changes suggested in the redis-server file.

Your thoughts and ideas would be appeciated!
Not experienced this issue. Are you running a Pi 2 or 3? What is the cpu utilisation?

$ uptime

And the current running processes?

$ sudo top

Pi 2

pi@emonpi:~ $ uptime
 00:34:31 up  9:35,  1 user,  load average: 0.21, 1.13, 1.09
pi@emonpi:~ $ 

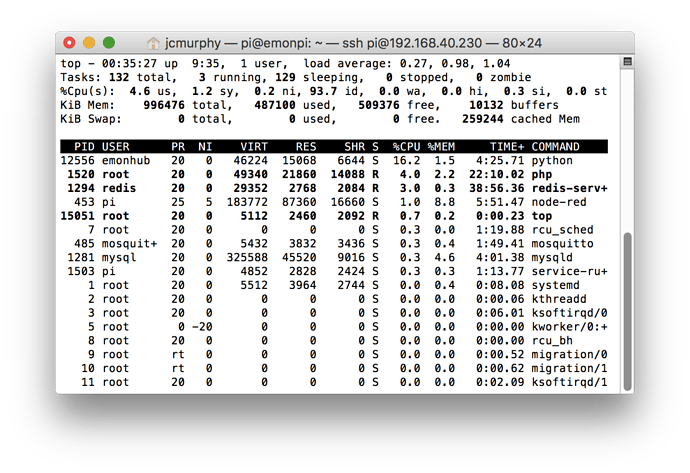
and here is sudo top:

to me nothing looks odd.

Is there a way to do a ongoing “top” type command and to record the top 10 processes every 5 seconds??

Your uptime stats are showing a higher CPU load than my emonPi

$ uptime
 07:41:40 up 11 days,  3:24,  1 user,  load average: 0.18, 0.58, 0.50

Can you think of any changes that might have happened before you noticed the slow down? Upgrading any packages etc?

Here is my emonpi top output:

top - 07:42:29 up 11 days,  3:25,  1 user,  load average: 0.20, 0.52, 0.48
Tasks: 109 total,   1 running, 108 sleeping,   0 stopped,   0 zombie
%Cpu(s):  5.8 us,  1.3 sy,  0.1 ni, 92.1 id,  0.0 wa,  0.0 hi,  0.7 si,  0.0 st
KiB Mem:    996732 total,   674852 used,   321880 free,     4064 buffers
KiB Swap:        0 total,        0 used,        0 free.   276840 cached Mem

  PID USER      PR  NI    VIRT    RES    SHR S  %CPU %MEM     TIME+ COMMAND                                    
23252 emonhub   20   0   47628  14948   6404 S  16.2  1.5   2124:09 python                                     
23544 root      20   0  150012 120596  13836 S   5.6 12.1 569:37.26 php                                        
 1484 redis     20   0   31052   2736   2076 S   4.6  0.3 535:52.87 redis-server                               
23687 root      20   0   36368  13436   6504 S   1.0  1.3 166:24.15 python                                     
  470 pi        25   5  150164  91572   8492 S   0.7  9.2 103:38.67 node-red                                   
29256 root      20   0    6812   2476   2092 R   0.7  0.2   0:00.08 top                                        
  203 root      -2   0       0      0      0 S   0.3  0.0   7:00.50 ksdioirqd/mmc1                             
  491 mosquit+  20   0    5432   3760   3364 S   0.3  0.4  54:26.59 mosquitto                                  
  536 root     -11   0   20348   1732   1524 S   0.3  0.2   2:00.29 lwrfmqtt                                   
 2309 pi        20   0    6564   2908   2492 S   0.3  0.3  40:07.38 service-runner                             
 6498 root      20   0       0      0      0 S   0.3  0.0   0:19.45 kworker/u8:0                               
23511 openhab   20   0  413772  93124  11084 S   0.3  9.3  70:12.13 java                                       
28822 pi        20   0   11480   4120   3516 S   0.3  0.4   0:00.02 sshd                                       
31594 root      20   0       0      0      0 S   0.3  0.0   0:01.70 kworker/u8:1                               
    1 root      20   0    5536   4052   2788 S   0.0  0.4   1:06.18 systemd                                    
    2 root      20   0       0      0      0 S   0.0  0.0   0:00.57 kthreadd                                   
    3 root      20   0       0      0      0 S   0.0  0.0   1:00.44 ksoftirqd/0                                
    5 root       0 -20       0      0      0 S   0.0  0.0   0:00.00 kworker/0:0H                               
    7 root      20   0       0      0      0 S   0.0  0.0  24:27.59 rcu_sched              

Yes - lots of changes all related to trying to fix the oddness & slowness…

near Aug 23 - things were running slow and I noticed my root drive was almost full. I ran df -h and saw /dev/root was above 90% used. So I ran sudo apt-get clean which gave me a message to run autoclean (or remove or auto remove). I’m looking for the Terminal log files to get the exact commands I ran.

near Aug 30 - I installed node-red-contrib-nest v0.1.9 which is an updated version. After that I could not Deploy anything new on any Node-Red flow. I ended up uninstalling that Nest node AND uninstalling Node-RED, nodejs and npm. Reinstalled node-red, nodes and npm. Still had same Deploy issue. Turned out it may be a node-red bug related to Dashboards. See Redirecting to Google Groups

near Sep 4 - I noticed BIG slowdowns related to SSH login and commands I type into the terminal. Could take about 30 seconds to get a response from many commands - i.e., ssh login, top, man, etc. It seemed to be related to OpenHab and Java were using LOTS of CPU (near 100%). I don’t use OpenHab and wanted to disable it.

Sep 8 - suspected a possible SD card corruption (too much above oddness) and unplugged the emonPi SD card and ran fsck on a separate RasPi and all seems OK. Not sure if this is a good check for an SD Card integrity.

pi@raspberrypi:~ $ sudo fsck /dev/sda1
fsck from util-linux 2.25.2
fsck.fat 3.0.27 (2014-11-12)
/dev/sda1: 109 files, 2628/7673 clusters
pi@raspberrypi:~ $ sudo fsck /dev/sda2
fsck from util-linux 2.25.2
e2fsck 1.42.12 (29-Aug-2014)
/dev/sda2: clean, 88877/216384 files, 482830/894720 blocks
pi@raspberrypi:~ $ sudo fsck /dev/sda3
fsck from util-linux 2.25.2
e2fsck 1.42.12 (29-Aug-2014)
/dev/sda3: clean, 12520/1021832 files, 863292/4066304 blocks
pi@raspberrypi:~ $ 

I think this is everything. Ugh!

EDIT: and there were three emonPi updates. I’ve been following the graph.js changes.

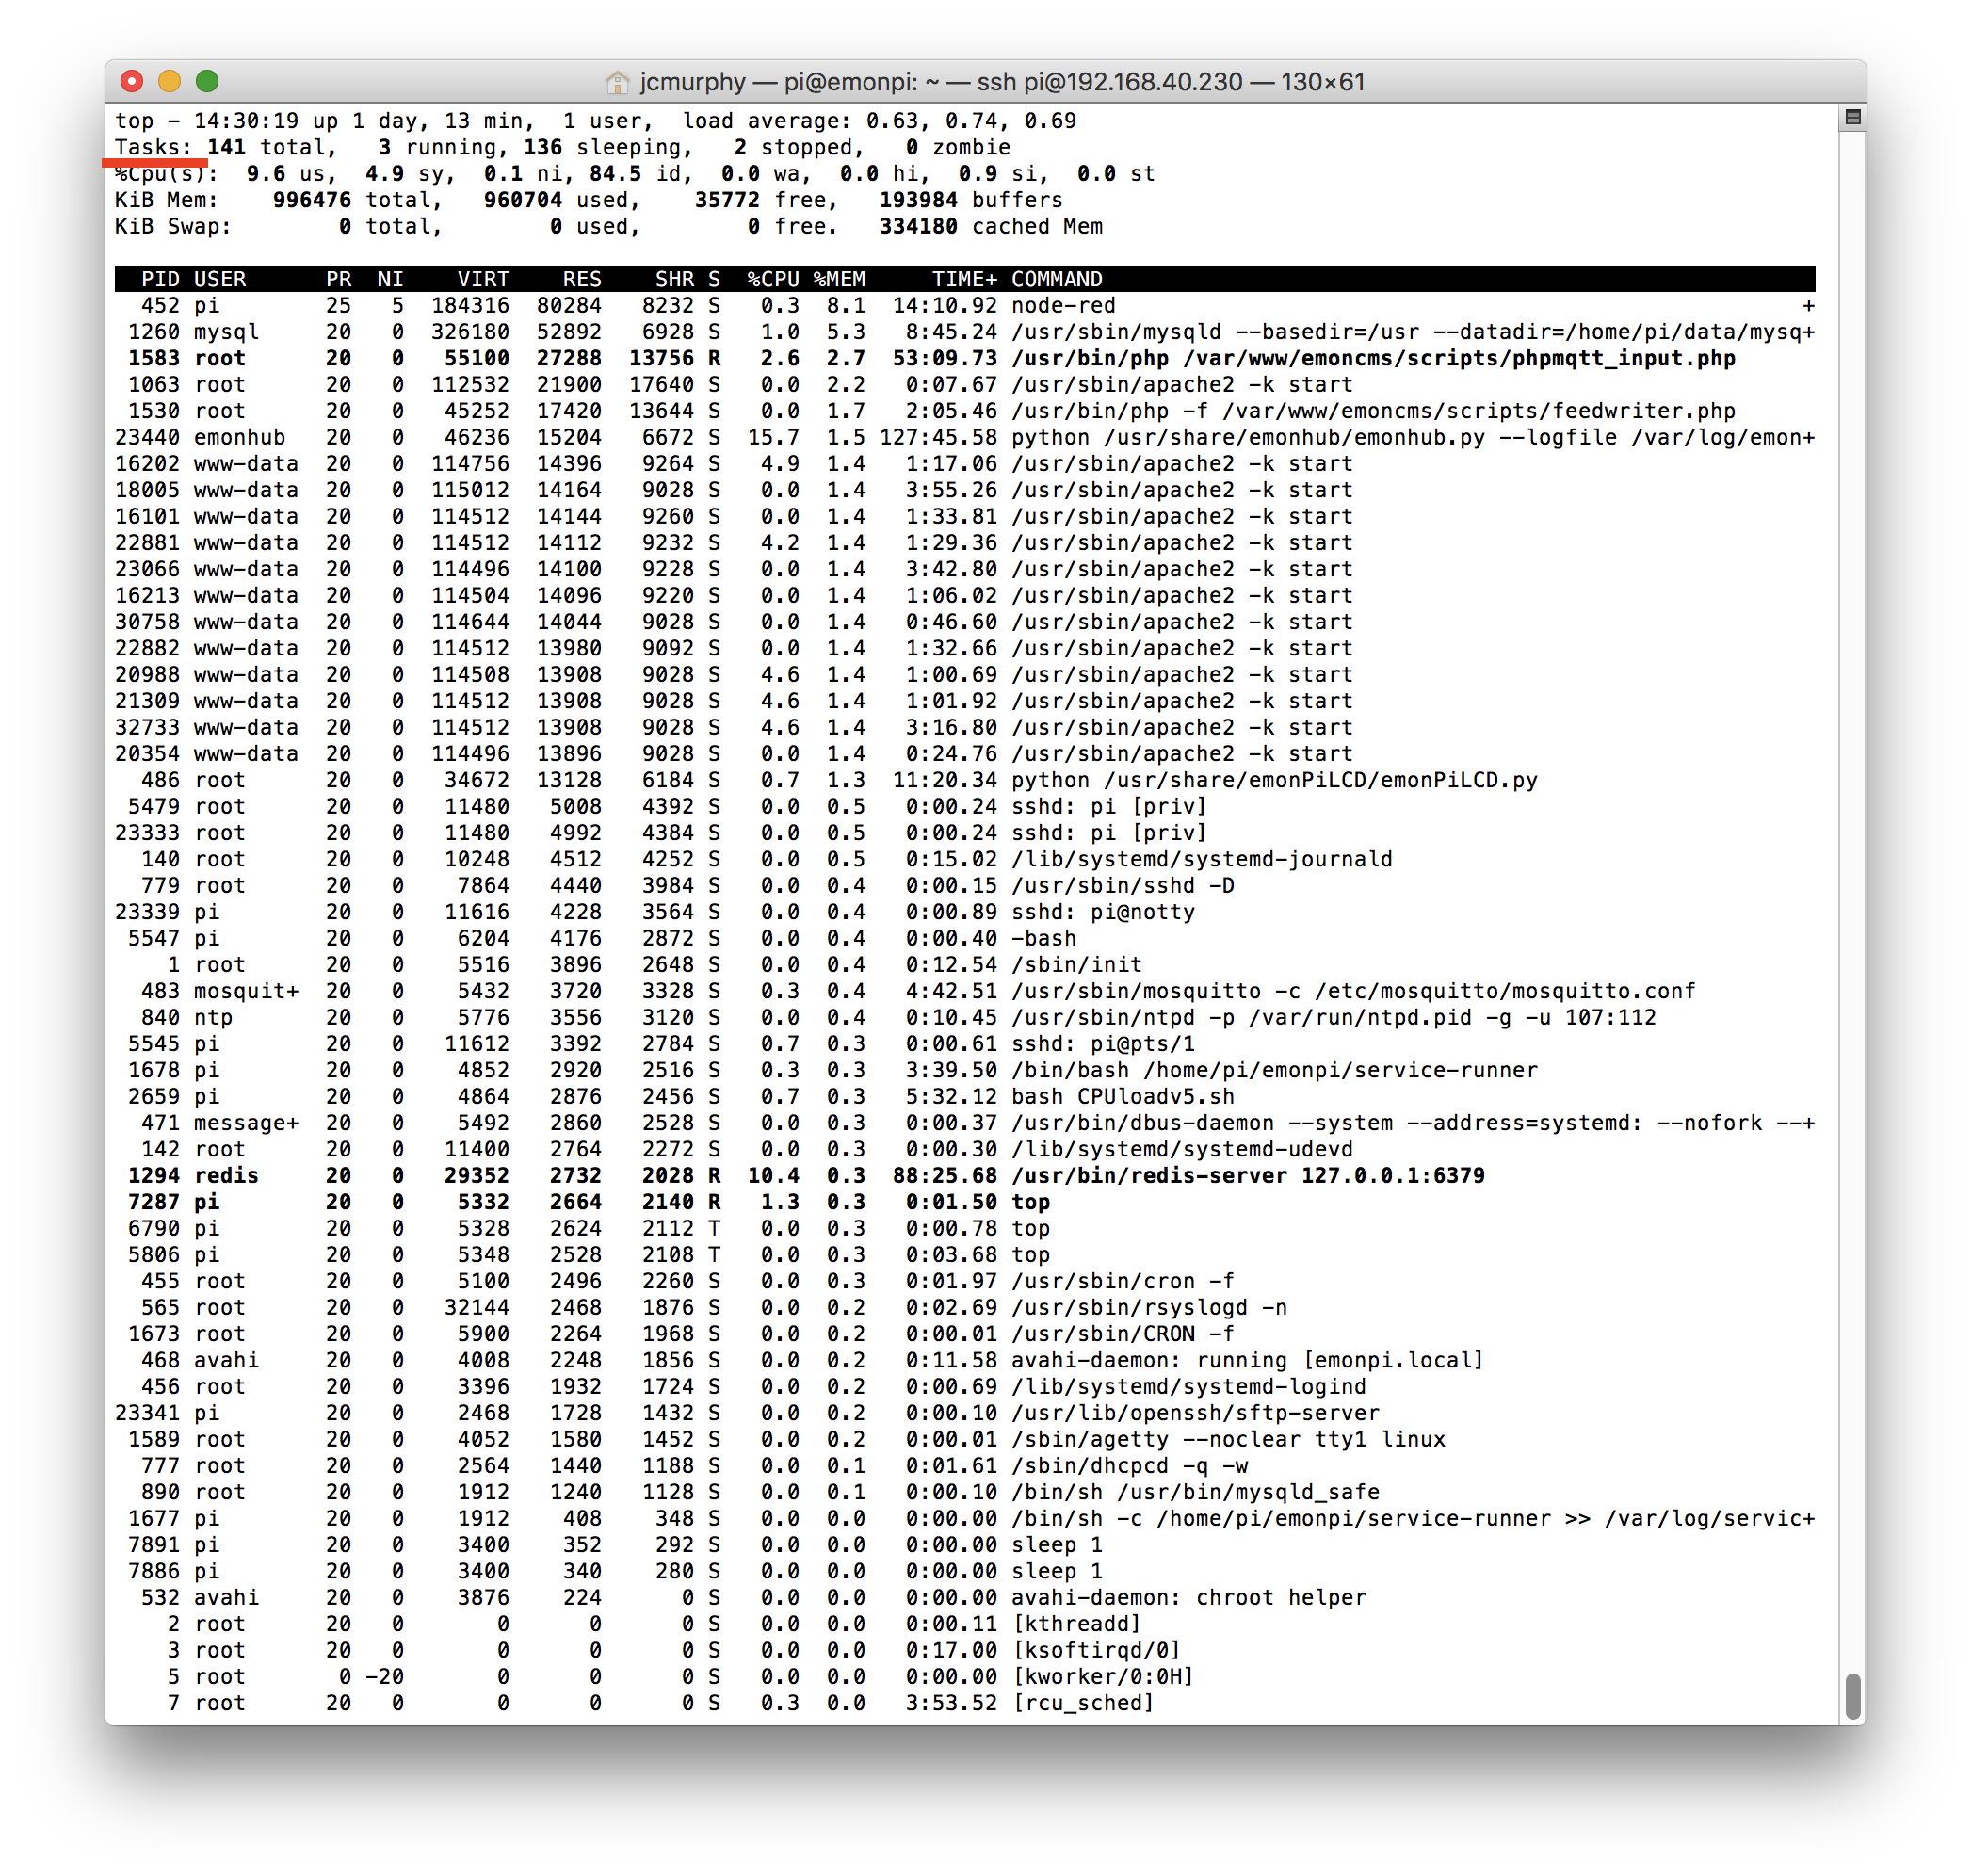
I’m still experiencing lots of slowness with my emonPi. And I’m not sure how to determine what is using up all of the RasPi resources. I’ve been monitoring the process over the past few days and it seems like I am running out of memory (RAM) and that is causing high CPU loads (but this is a wild guess).

The emonPi is a Raspberry Pi 2 Model B with 1 GB of RAM. After I reboot the emonPi the RasPi has about 500 MB free RAM (out of 1 GB). Within two hours I am almost out of RAM and it ends up around 35 MB to 70 MB of free RAM (per the top command). CPU utilization (1 minute load average) will hit between 6.0 and 9.5. To me “4.0” would be the highest number for a quad-core processor so there is something I am not understanding.


There seems to be lots of instances of Apache running. Is this normal?
 

And there are 24 threads of mysql running - it this also normal?

Any suggestions on how to debug memory (RAM) issues would be wonderful!

hello Glyn , ihave the same problem

Please provide more information. What version are you running? Are you posting to Emoncms.org?

Try and run emonPi update then when it’s done reboot the system.

I have a similar problem.
I running emoncms on a RaspPi 3 with raspian and a manually installed emoncms in low-write configuration. The reason for that is, that I need the graphical desktop for a special reason.

If I’m logged in at emoncms, I should get the Feed list, but instead I get a rolling wheel which rolls and rolls on…

If I monitor at the same time the system with htop I can see that the RAM consumption increase more and more, still it is completly full, including the SWAP-space, at this point the whole systems dies.

At the same time I can’t recognize any process which thread or process need so much memory.

Has anyone a clue what happen?
Can someone tell me how I have to setup the settings.php to get another startpage as the fedd list?

Greetings

Guido