Submitted by TrystanLea on Sun, 24/04/2016 - 17:10
I’ve been working on improving emoncms support for timezone correct daily, weekly & monthly kWh data and also fully calculated average (mean) temperature, humidity, power etc.
Its now possible to access, view and export to CSV these values from the new emoncms graph interface as a start.
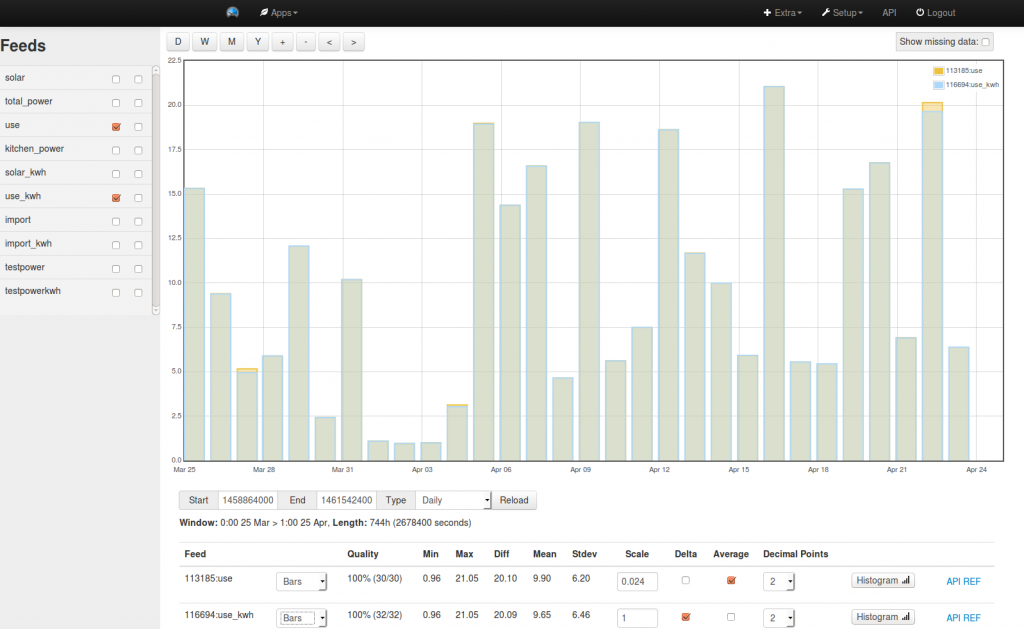
This screenshot shows average daily power data calculated from a power feed overlayed against daily kWh as calculated from a cumulative kWh feed. Both approaches arrive at the same values (apart from a few small differences if there are outages). But it illustrates that the calculation of daily mean is aligned correctly.
The request type can be selected from the type drop down menu and includes types:
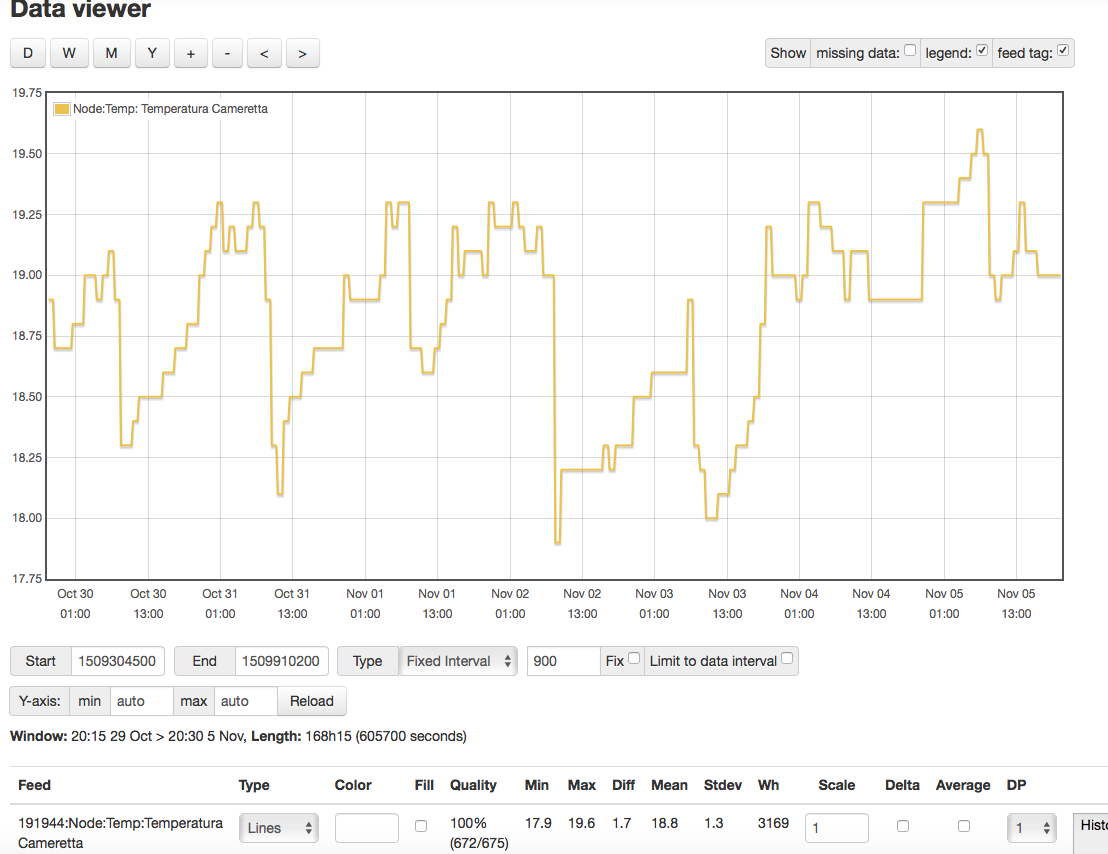
Interval - specify a periodic fixed interval at which to request datapoints i.e a data point every 3600 seconds.
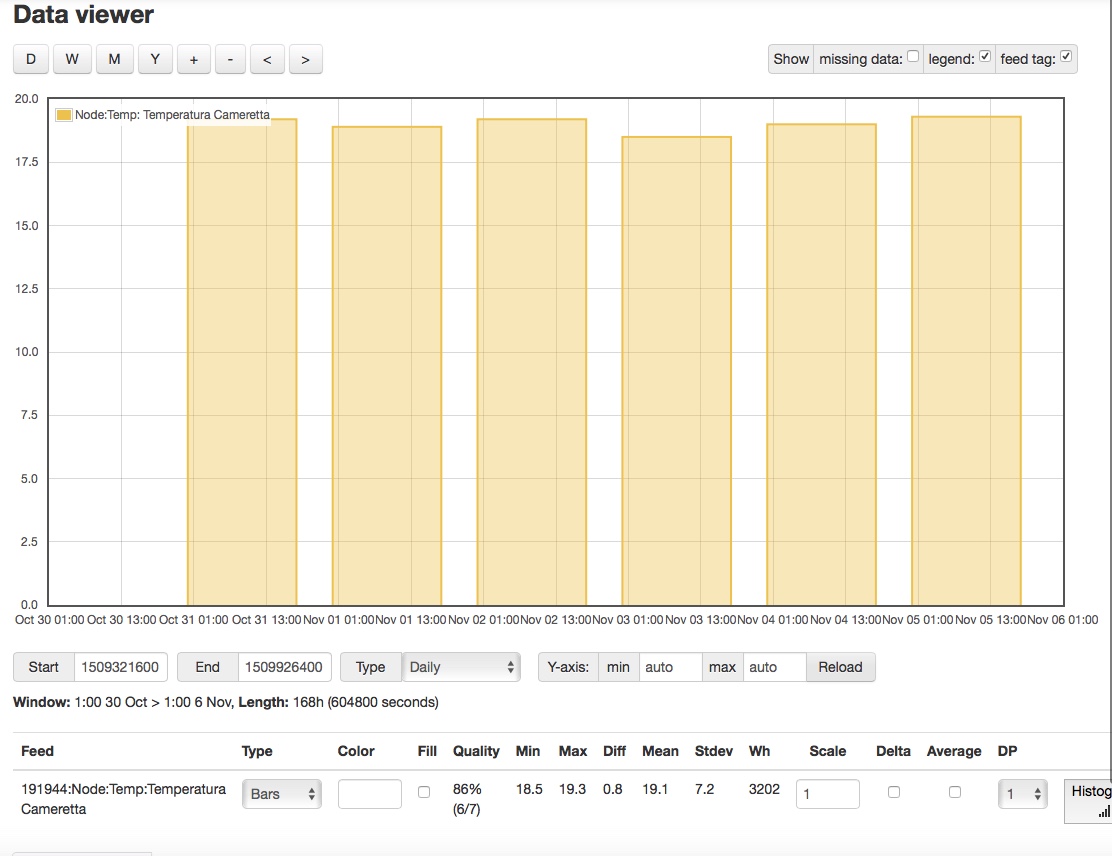
Daily - daily data correct to timezone set in user profile
Weekly - weekly data correct to timezone set in user profile
Monthly - monthly data correct to timezone set in user profile
To return the average for the period selected the average tickbox needs to be ticked, otherwise the value at the timestamp of the start of each interval will be returned - which is what is needed in the case of calculating kWh data from cumulative kWh feeds.
On request the averages are calculated on the fly in the background, the result is cached so that next time an average is requested the whole feed does not have to be processed. Because of the way this works at the moment ‘reload’ needs to be clicked twice once to register the feed for averaging and second to display the result. I will be working on a way to make this a more seamless experience.
While most of the implementation for this is currently working on the emoncms master branch the part that registers the feed for background processing of averages is not yet complete and so the averaging will only work up to 7 days there while on emoncms.org averages covering the full feed can be returned. There are a couple of things left to do to fully complete this but for anyone keen to test its present state this is now available on emoncms.org and the master branch for testing.
I need your help.
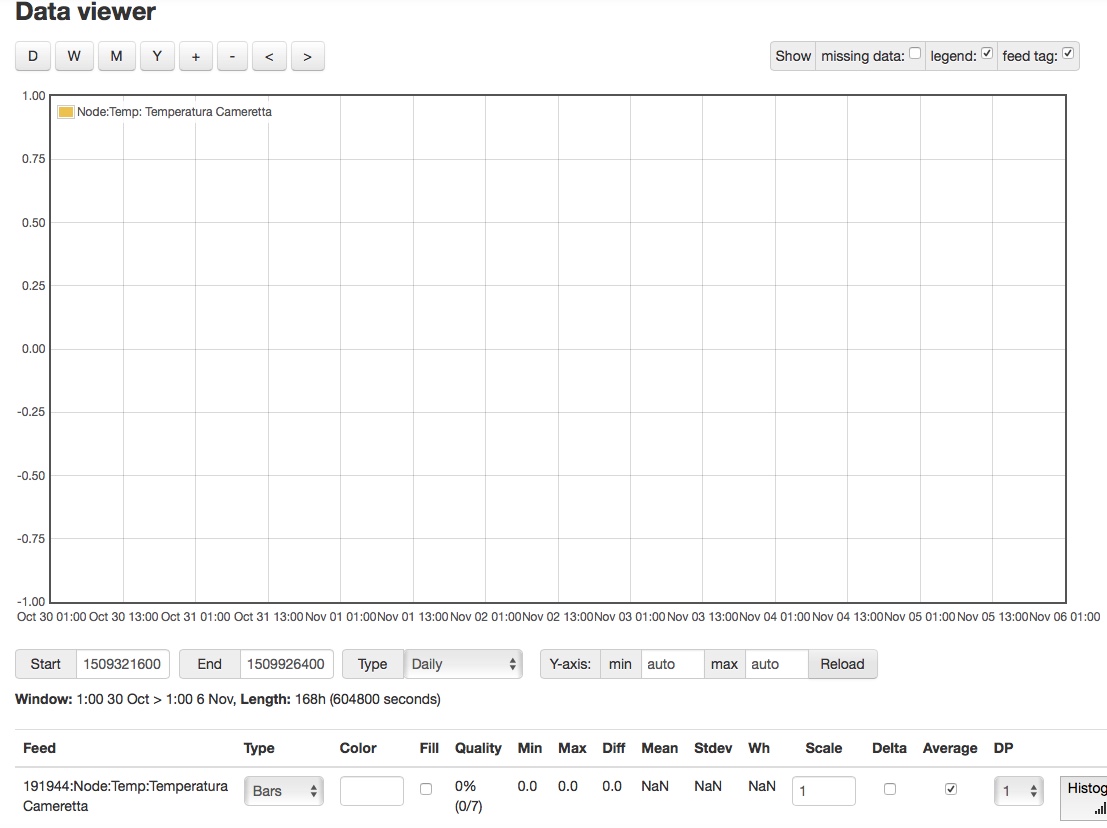
When I flag the average column, in order to obtain a daily average graph, the graphs disappear and also all the values in CSV format and the statistical information in the row of that particular feed. Where is the mistake?
I add only one thing: if I Oper CSV values, I see that at the begging of my data series there are a lot of missing values (null). I don’t know if this is the cause of the problem.
Mario - sorry for disappearing. I’ve been trying the same thing and got equally odd things (chart disappears). And I did get averages that didn’t make sense. I did see the order you click on things does change the output (i.e., clicking Averages first versus change Type to Daily)
So I grabbed the raw data and calculated my own averages for the day. Now I know the right number!
Anyway the bottom line is I could not determine what was going wrong. Trystan @TrystanLea can you assist?
Jon, it does not mind the order I select fields. There is only one constant: when I flag “average” and then “reload”, graph disappears. Always, any case or type has been previously selected
Hello, could you see if there are any errors returned in the request to the feed/average API using developer tools?
Do averages of smaller time frames work? hourly or perhaps 6 hours?
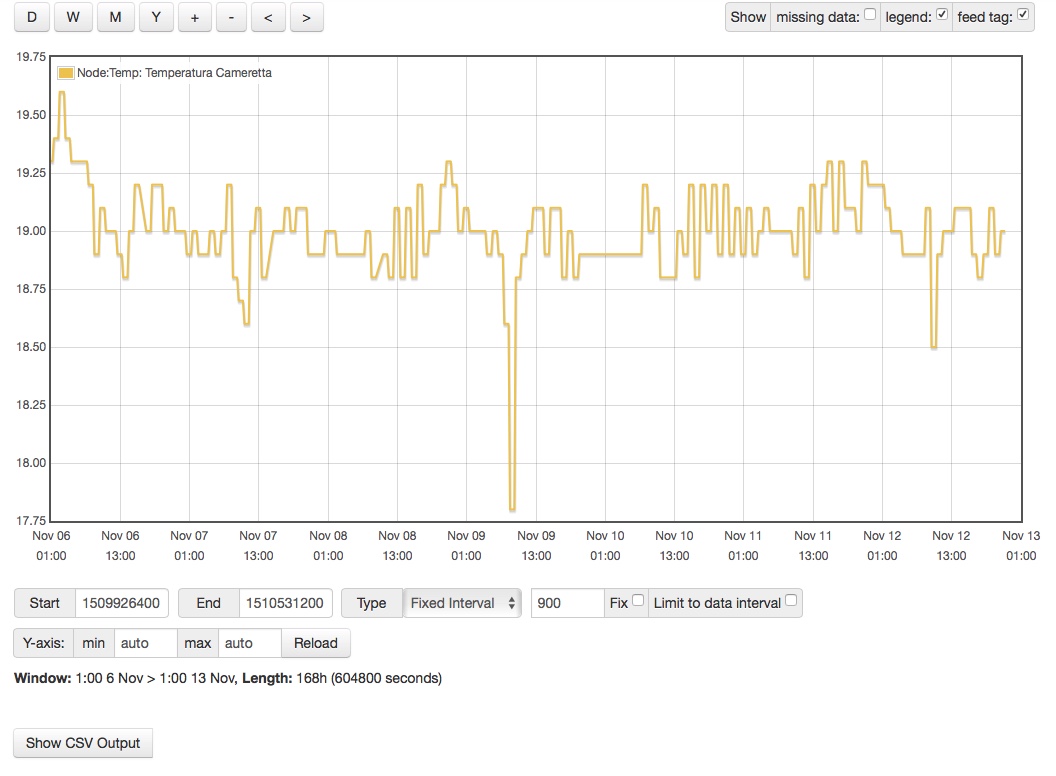
I tried to get your suggestions, but now this is what appears to me on emoncms page…
Where are the average option and the statistical values under the graph?
Now, if you select a certain time interval only single data at that particular interval are plotted, no average values at all…