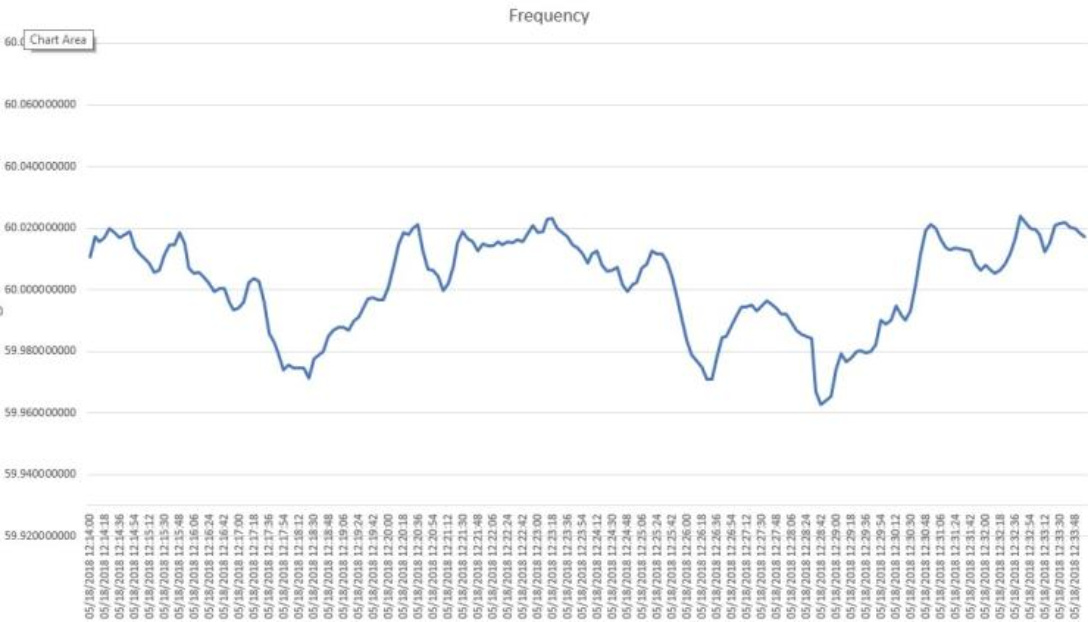
As you can see, it dips and rises all day every day, usually anywhere from 59.95 to 60.05 about 98% of the time. If it ever drops below 59.9, or rises above 60.1, a serious system event has occurred, e.g. a major loss of generation or load somewhere in the US.
Well crap - I suppose there’s one downside to using a microprocessor as opposed to a micro-controller. I can’t guarantee that my code will be executed at exactly the same time, every time. In every day use this is never really a problem, but at these small time intervals, it might be a problem.
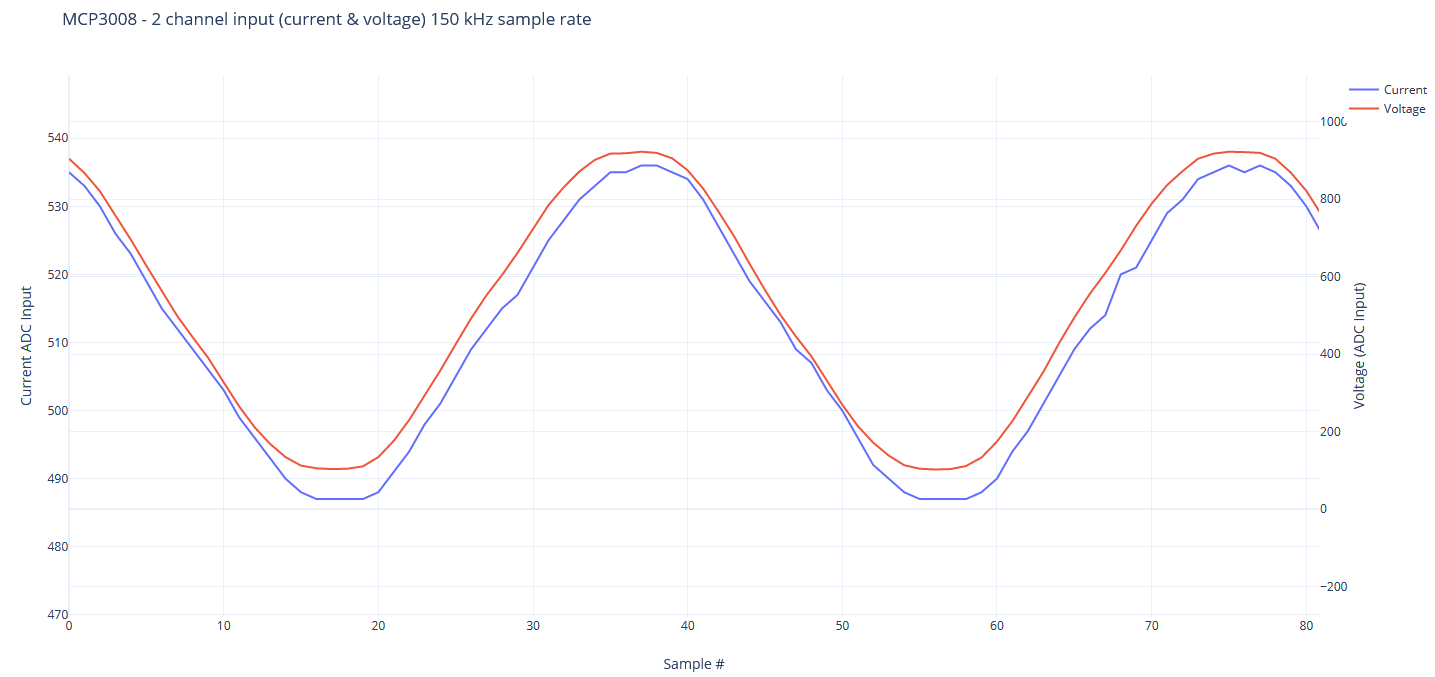
The good news is I just pulled some data from both channels in the same loop, as in, read channel 0, read channel 1, repeat. I collected 2000 pairs of readings (current and voltage) in 0.99 seconds with an ADC clock speed of 150 kHz. Here is the raw data for the first two oscillations. I’ve adjusted the scale on the chart for the voltage reading to allow it to fit on top of the current curve better so we can see the phase error. It turns out it looks like the voltage reading peaks only 2 or 3 samples prior to the current sample peaking.
Would that phase difference have a measurable impact from an accuracy perspective? I’m just trying to gauge exactly how accurate this already is. Am I already well above the accuracy threshold of commercially available meter, like the Kill-A-Watt?
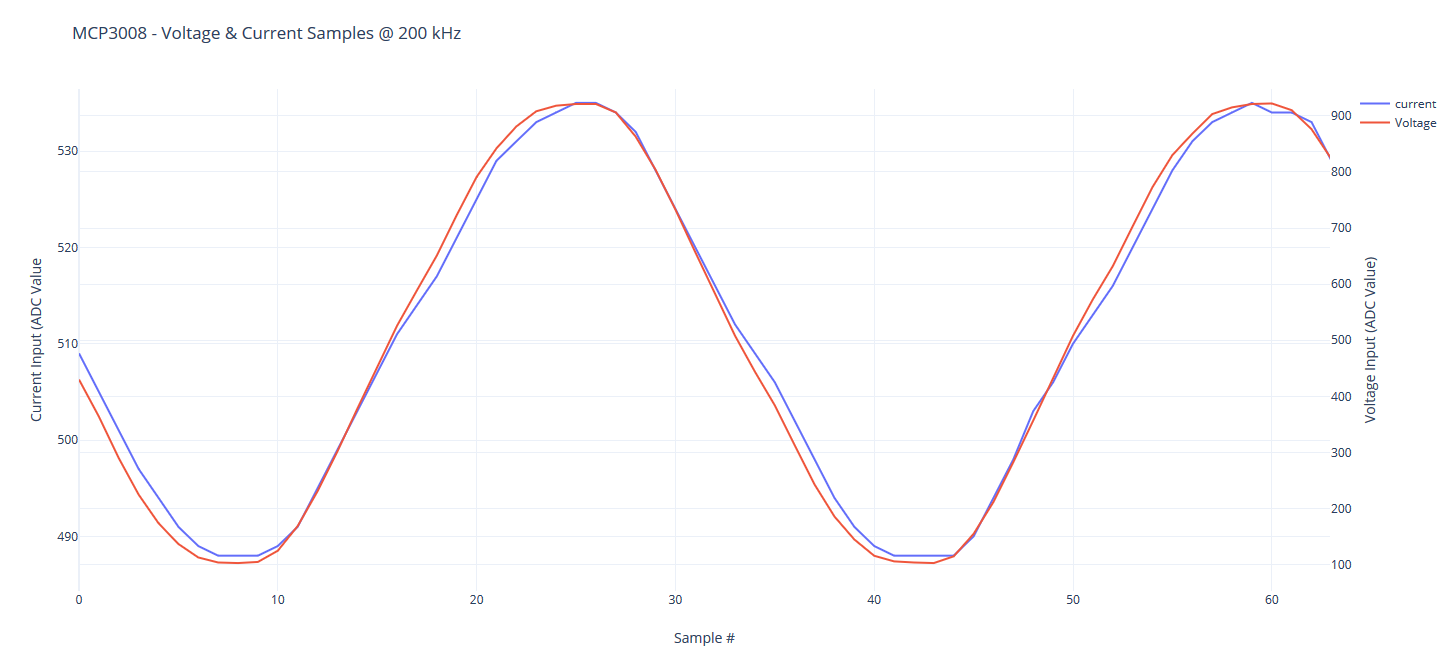
While writing this post, I played around a bit and tried to correct for the phase error in software. The only thing I could come up with was to increase the clock speed of the ADC to 200k so that there is less time between reading voltage and current. I also added a 100 microsecond delay after reading both channels to try to offset the increase in read speed so that I don’t get too much data. This helped bring the current sensor peak closer to the voltage sensor peak by 1-2 samples, but they’re still not perfectly in phase. Here is an interactive plot for my attempt at getting the phases aligned closer.
Do you think I’ll be fine from an accuracy perspective with the above sample data (in the linked chart)?
While on the subject of phases, my project, when complete, will have 4 CT sensors total:
2 on my main panel for each 120V leg (which I think are 180* out of phase with each other)
1 on my 100A subpanel (not sure which phase this is coming from - it has it’s own main breaker fed from the utility’s panel on my house.
1 on my solar feed from the DC inverter.
I am anticipating an issue when trying to calculate instant power using the voltage measurements from leg 1 of the panel, but a CT reading from the main input for leg 2 of the panel. My first thought to work around this is to essentially do what an absolute value operation would do on a negative value (hope that makes sense to you). My second thought would be to add a second voltage sensor for the other leg.
This is very interesting. Thank you for sharing! That is a very small average variation. I guess I wouldn’t need to worry about variations in phase changes throughout my few thousand data samples…
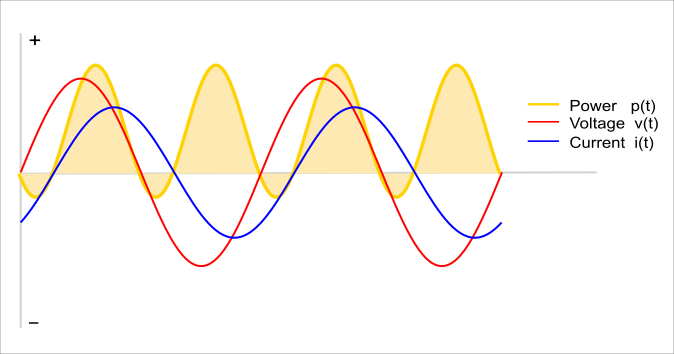
Measuring off your picture, I reckon that’s about 10° phase shift. At unity power factor, that would come out at 0.985, which isn’t too bad. Unfortunately, with a p.f. of 0.8, it would read 0.89 or 0.68 (depending on which way it is), and worse, if you had an almost pure reactive load with a p.f. of 0.1, it could look as if the load was generating!
So if you have “well-behaved” loads with a respectable power factor, it’s a minor error. The worse the power factor, the bigger the error.
But the time between readings is only part of the error, as I explained (I think), it’s down to variable errors in the transformers.
I’m not going to look, please upload it here.
We’ve tried to explain that on the Use in N.America page.
Generally, voltage imbalance between the two legs hasn’t been a problem. And if the c.t. is the wrong way round, you can either reverse it on its cable, or put a minus sign in the maths.
I just finished refactoring my calculations using my new data collection method and here are the values I came up with for the data set with 2000 samples taken at 200kHz linked above, using an electric heater (with a fan) as the load:
Real Power: 636.604 W
RMS Voltage: 120.134 V
RMS Current: 5.324 A
Apparent Power: 639.546 W
Power Factor: 0.995
p.f. = 0.995 is pretty good for a resistive load, yeah? Now that I have the basics down, I can get started on optimization for looking at the data samples for non-resistive loads.
This is what I was concerned about - that’s an easy fix! The CT sensors I purchased do indeed have the 3.5mm plug and I’m currently just using a female jack with the 3-pin breakout to connect to my breadboard. I may snip the jacks off and use cat5e to transport the signal from the 4 CT sensors that will be in my main panel back to the Pi.
I have some more reading to do on the Calibration Theory section before I continue. Thank you for the assistance so far!
What you need is in post no. 18. - in one sentence: “So if your ADC is 4096 counts per 3.3 volts at the ADC input, and your voltage divider is 126.5 V at the mains input per volt at the ADC input, then overall it’s 4096/3.3 counts per 126.5 V at the mains input.” SImple
If that sentence is about calibration, I have no idea where that needs to be applied, why it needs to be applied, and what it corrects (and how it corrects whatever it is). It sounds similar to the scaling factor, which I’ve already applied to my data. Also, I’m using a 10-bit ADC so I don’t think the 4096 figure is applicable. You probably feel like you’re repeating yourself, but I think I’m missing a piece (or several) of the puzzle.
I’m not sure what to expect when I move my CT sensor over to a non-resistive load, or better yet, the house mains, so I’m trying to broaden my understanding of how other types of loads interact with the waveforms. I just don’t want to be taken by surprise (and frustration) when I connect the other sensors to my breadboard and start compiling the data, only for it to be wrong and not having the slightest clue about where to begin looking for the problem.
Those numbers are (usually) derived from the ideal values that come from manufacturer’s data. In your case, part of one is accurate because you measured it (the transformer ratio). All the rest are subject to manufacturing tolerances. Your reference voltage probably won’t be exactly 3.3 V and the divider resistors won’t be exactly 10 kΩ and 100 kΩ. Your current transformer won’t be exactly 100 A : 50 mA, and the burden won’t be exactly 20 Ω. Calibration simply means tweaking the numbers to take account of all those factors so that you get the same answer as some reliable standard.
You’re right - it’s 1024 in that case.
You’ve almost got that the wrong way round - it’s more like how the waveforms interact with the loads. That can be quite complicated. For example, if you’ve got an old and cheap battery charger, it’s going to have inside the case a transformer and a rectifier. The rectifier will only pass current when the voltage out of the transformer is higher than the battery voltage, so you’ll get a narrow pulse of current around the peak of the voltage wave. If you have a refrigerator with an induction motor in it, then a property of an inductor (a coil of wire, and there’s a lot of that in an electric motor) is the current builds up slowly when you apply a voltage. So the current wave lags behind the voltage wave. Things like microwave oven timers require very little current, and those often use a capacitor to lower the mains voltage to power the electronics. The capacitor works the opposite way to the inductor - when you apply a voltage, the current rushes in fast (that’s why there’s often a sharp crack when you plug it in - a laptop power supply is similar, having large capacitors inside) so then the current waveform leads the voltage.
And that brings me full circle to why you need to set the correction, for timing and all the other factors that shift one wave relative to the other, with a purely resistive load. When you have that right, any other shift results from the properties of the load.
Thank you for clarifying! Would an alternate approach to calibrating static values be to take a sample of the board voltage, and a sample from the voltage divider voltage, prior to the start of each polling cycle? In other words, if I have the actual values that are the direct result of using components with unique tolerances, do I care what those tolerances are in the end? I guess with the current transformers it isn’t possible to do this, but for the board and ref. voltage, it should be?
… by exactly 90 degrees - I just finished a 30 minute lecture on inductors and waveforms
So, I suppose the ultimate question is, will my calculations be able to account for these shifts in the wave (and accurately measure power consumption), or do I need to handle different shifting scenarios in code?
…I would assume the sign on the power will keep the calculations straightened out, and that I shouldn’t have to worry about the difference in phase between the two waves.
Lastly, I’ve been letting my DIY power monitor run and I’m observing the following output. My CT sensor is on a conductor that is not energized/live. (The real power is actually returning a value between -1 and 1, so I am currently printing 0 if -1< real power < 1 is true):
Real Power: 0 W | RMS Voltage: 123.713V | RMS Current: 0.3A | Apparent Power: 37.09 W | Power Factor: -0.014
Real Power: 0 W | RMS Voltage: 123.859V | RMS Current: 0.299A | Apparent Power: 36.984 W | Power Factor: -0.022
Real Power: 0 W | RMS Voltage: 123.782V | RMS Current: 0.297A | Apparent Power: 36.767 W | Power Factor: 0.002
Real Power: 0 W | RMS Voltage: 123.751V | RMS Current: 0.301A | Apparent Power: 37.262 W | Power Factor: -0.007
I don’t know why apparent power and RMS current is so relatively high when there is absolutely nothing on the cable. Do you have any ideas?
That’s exactly what was done in emonLib for the emonTx V2, which could be powered by batteries and didn’t have an on-board regulator. But… You still had to calibrate because the on-board reference of the Atmel 328P is 1.1 V ± 0.1 V.
Sorry, but you can’t get out of jail that easily.
No, you don’t. All you care is the resulting voltage and current readings are correct.
I can’t be explaining very well. There are two groups of things that cause the voltage and current waveforms, that come out of your processor as numbers, to be shifted in relation to one another. The first is errors in the measurement technique and properties of the measuring circuitry. Those you aim to correct or compensate for.
The second group arise from properties of the load. You must not try to compensate for those, because if you do, the measurement will be wrong.
I have. It’s most likely electrical noise being picked up from somewhere. Those numbers are absolutely characteristic of that. What is the construction of your analogue circuitry before the signal gets to the ADC? Because of the voltages involved (0.3 A represents about 3 mV at the ADC input), you need to be very careful with the layout, and grounding, and decoupling the supply. There’s lots of information from all the manufacturers of ADCs and processors that incorporate ADCs available.
Hah! Ok - well at least it sounds like starting with voltage measurements from the board and the voltage divider is a good place to start.
Your explanations are perfectly fine and extremely helpful! I just don’t have the depth of knowledge in this subject area that ties all the concepts together. I feel the same way when explaining complex networking problems to my peers - the ones that don’t have the big picture sometimes just don’t get it the first few times.
I have absolutely zero knowledge about proper analog circuit design principles and how/where interference might come from. Would it be helpful if I build my circuit on an online breadboard simulator to share with you? An uneducated guess at the source of the issue is that my entire circuit is using the same +3.3V and GND pins on the Pi, which includes the 1 CT sensor , the MCP3008, and the 9V AC input source.
I found some online resources about EMI, including a thesis by JINGJING YU and a video created by Texas Instruments. I am interested in learning more on the subject because when I get my prototype to a working and comfortably accurate state, I intend on moving the circuit from the breadboard to a more durable prototype board (or even a basic custom printed PCB) for final deployment in my house.
Edit: With the 3.5mm CT sensor jack removed from my female input, the circuit is still detecting ~0.3A RMS current, so the suspicion of interference is confirmed!
Oh, ok! This is my first practical electronics project - so I had no idea! I’m thinking of a prototype PCB like this once I’m ready to move to that stage.
That’s probably going to be very similar - WRT noise - to what your breadboard is giving you now.
A low-noise solution is faily well involved. Things like ground planes, power supply decoupling
and circuit design are just some of the criteria that need to be taken into account.
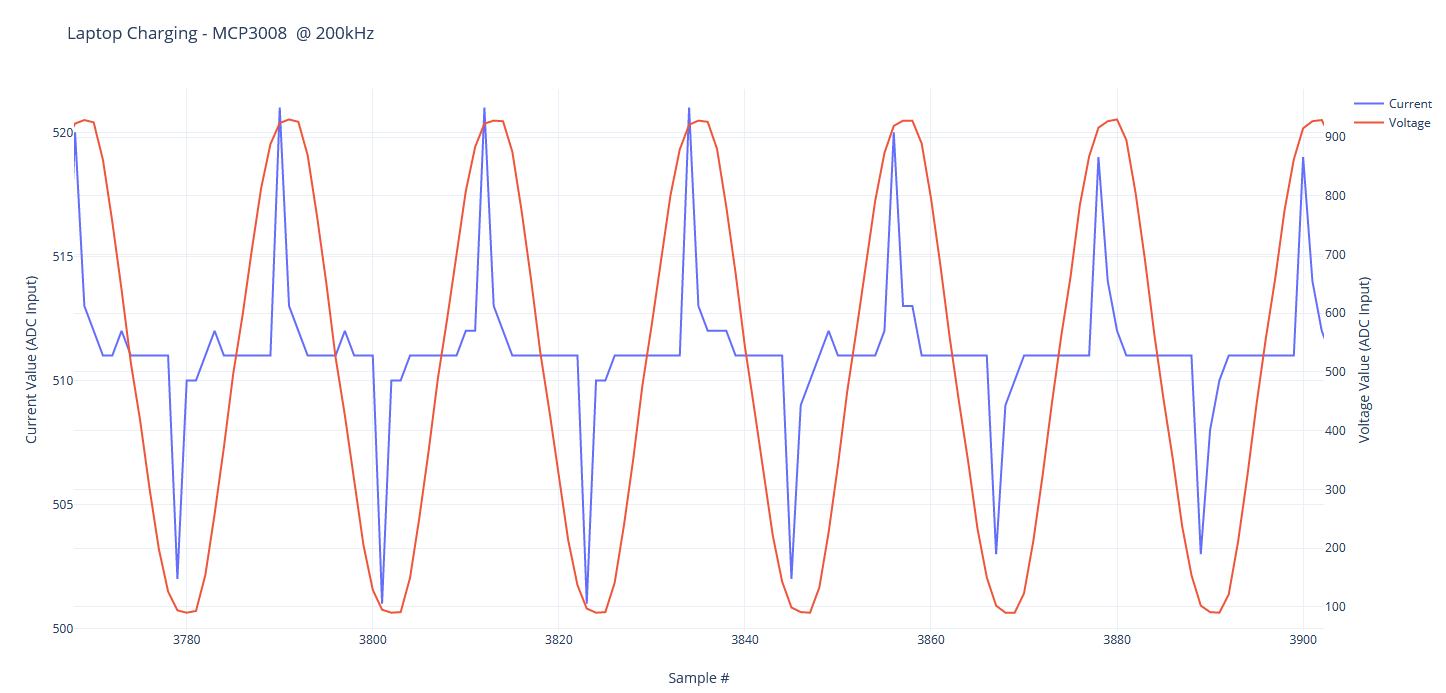
Your Switching Mode Power Supply current trace looks similar to dBC’s
compact flourescent load waveform.
Now you see - first hand - why accurate waveform reproduction is necessary.
Oh boy, ok. My main motivation to move to a proto-PCB is just to have something more durable and compact compared to a breadboard. I’ll have to keep looking for the source of the noise!
Yes, absolutely! A lot of the theory has all come together for me since I started seeing data first hand. On that note, my power factor for the laptop charging is about 0.49 - that’s because of the laptop’s reactive power characteristics (ie, phantom power).
Real Power: 41.222 W | RMS Voltage: 123.81V | RMS Current: 0.698A | Apparent Power: 86.469 W | Power Factor: 0.477
Real Power: 46.707 W | RMS Voltage: 123.942V | RMS Current: 0.768A | Apparent Power: 95.155 W | Power Factor: 0.491
Real Power: 42.458 W | RMS Voltage: 123.887V | RMS Current: 0.697A | Apparent Power: 86.375 W | Power Factor: 0.492
Real Power: 44.517 W | RMS Voltage: 123.982V | RMS Current: 0.733A | Apparent Power: 90.932 W | Power Factor: 0.49
I would guess that the closer to a p.f. of 0.50 for a reactive load, the more accurate my detection circuit is?