I would like a chart giving the relationship between heat-pump COP and air temperature, air humidity and ouput flow temperature for the differant refrigerant gases and power output/ input.
This will be very specific to a given manufacturer of heat pump. Do you have a model in mind?
Hi moojuiceuk,
Thanks for your reply. I love the name, I guess you are a dairy farmer?
No specific model as I was hoping to get info for different gases. However I have tried to find details for the Mitsubishi Ecodan R32 Ultra Quiet PUZ.
From my work installing swimming pool ASHPs I am aware of the vast difference in performance due to ambiant air temperatures and I understand that the humidity of the air would make a difference but I don’t know how much or wether high or low humidity gives the best COP?
I’m certainly no dairy farmer. I chose that name years ago in the dial-up era and it sort of stuck. I actually work for a heating manufacturer, but it’s not Mitsi.
Having a look on the Mitsi website, found this manual which I think you would need to use to look up the R32 PUZ range specifications: Ecodan ATW Databook R32 2020 - Document Library - Mitsubishi Electric
They are listing things like maximum flow temperature output vs ambient air temperature, min return temperature acceptable, kW output vs ambient air temp for a given flow temperature and kW vs CoP for those given flow temperatures. It doesn’t seem to detail exactly what you would like to know.
High humidity levels in cooler air conditions will generally cause CoP to drop. As an evaporator is a colder surface compared to the ambient air temperature whilst heating, if the evaporator is below 0C, the moisture in the air will freeze against the evaporator coil, causing frosting to occur. The more frost that builds up on the evaporator, the worse the airflow is across the coil and the less thermal energy can then be absorbed by the coil from the air passing across it. Eventually the heat pump will drop into a defrost cycle to clear this frost.
Most ASHPs these days are reverse cycle defrost machines, which effectively flip the evaporator and condenser around using a 4-way valve inside the heat pump to then borrow some heat from the house (or pool in your case) to then defrost that evaporator before flipping the 4-way valve around again, waiting for a couple of minutes for that defrosted moisture to drip away from the evaporator, then start up the fan, then the compressor to continue heating as before. The exact algorithms behind when to defrost, when to stop etc are always manufacturer specific.
This defrost cycle negatively impacts CoP figures, so lower humidity air in these cases results in better CoP figures. There are heat pumps which use an electric heating element trace heater of sorts to defrost the evaporator but that is generally less efficient as direct electric heating is approx 100% efficient vs using the heat pump in reverse will certainly be > 100% efficient as we’re “borrowing” energy from the home / pool briefly and that thermal energy was obtained relatively economically in the first place.
What I do not have, is data on the effects of humidity in milder temperatures. If the air is very humid and the evaporator cold but above zero, condensate will form. How this affects efficiency, I can’t say for sure as I’ve never really looked into it but I can imagine beads of water on the evaporator narrow fins might obstruct air flow to a degree and have some negative impact on efficiency. Whilst various heat pump R&D labs probably have that data from their climate chamber tests, I’ve not seen it published. What I would say though, as an installer, is to only worry about things in your control.
As the ASHP is sat outside, you cannot really control the humidity of the air outside, so it’s not really worth worrying about. I would also be against using the warm expelled air from a swimming pool room to “pre-heat” the evaporator air directly. Whilst it might seem like a good idea, the air coming from a pool room would be moist chlorinated air and would have a corrosive effect on the evaporator as most are made from copper pipes and aluminium fins. A split evaporator is not fun to deal with, not to mention the loss of the refrigerant.
What is important is the position of the unit outside, so that it is not re-circulating the air it has taken thermal energy away from already. It’ll have the same effect as lowering the outside air temperature locally around the heat pump and will greatly reduce the CoP. Good air flow is key to good performance. I have seen a monobloc ASHP incorrectly installed into a garage with the door removed and just a small opening at the back of the garage. It was like going into a walk-in freezer and the running costs were huge.
Keeping flow temperatures as low as possible will keep the CoP as high as possible. Selecting the right size heat pump for the application will also help. Massively oversized heat pumps are a bad thing. Even on inverter driven systems, the inverter can only modululate the compressor output down to a certain low output. If a system is cycling on-off frequently as it cannot modulate low enough, every start up will mean the compressor is initially running at a higher output kW briefly for a couple of minutes before modulating back down to ensure oil moves to the right places inside the compressor. On fixed speed compressor installations, oversizing is even worse of an issue.
Refrigerant choice - it’s not really a huge choice anymore. Most new small monobloc systems will be R32 these days or maybe R290. R410A is still about. You’ll need to compare similar systems CoP to make a choice, and even it would not be my biggest deciding factor when choosing a system. R32 is probably going to be a few percent more efficient than R410A.
Manufacturers historically selected refrigerants based on their pressure-temperature characteristics for the application they were using. Over time, an awareness of CFC gasses on the ozone layer, and HFCs effects on global warming have forced manufacturers to look at using refrigerants with a lower “Global Warming Potential” compared to historical refrigerants once selected. More on the HFC GWP are here: Calculate the carbon dioxide equivalent quantity of an F gas - GOV.UK
The commonly seen refrigerant R410A has a GWP of 2088. Put simply, if 2.4kg of R410A were released into the atmosphere, it’s the equivalent of releasing 5 TONNES of CO2 into the atmosphere! Whilst monobloc heatpumps are typically hermetically sealed and the risks of leaks are minimal, this is the reason why manufacturers are moving from say R410A to R32, with a lower GWP figure of 675.
Other refrigerants such as R290 (Propane) have a GWP of just 3, which is why it is used in a number of new heat pumps. That said, Propane systems may be limited in where they can be installed (monobloc outside typically) due to the highly flammable refrigerant ,whereas R32 is only “mildly flammable”. R32 on paper has a small edge over R290 but going forward, I think we are likely to see more R290 monobloc systems due to the lower risk to the environment.
Are you thinking about what to fit for future installs, or looking at an existing system, or just idle curiosity?
Hi Moojuiceuk,
Thanks for your VERY comprehensive answer. I feel guilty putting you to so much trouble.
I am all too aware of the problems of icing in ASHP units. Personally I just tell customers to turn the unit off and forget swimming until air temperatures improve.
What I was really driving at was the difference in performance at normal air temperature between high and low humidity air. As water releases heat when it condenses high RH air will contain more heat than low RH air at the same temperature (assuming that some or all of the water vapor condenses in the unit). Some manufacturers make this point but I have been unable to find any figures on the actual difference in CoP. I want to know for future installations so that I can more closely calculate the size of the unit required according to location.
Cheers Hugh
Hi Hugh,
It’s good to see you looking into this idea.
Here’s a graph from the last week. We’re just creating hot water at the moment.
If you extrapolate up from the gold spikes (heating times) you can see what the humidity was from the blue line.
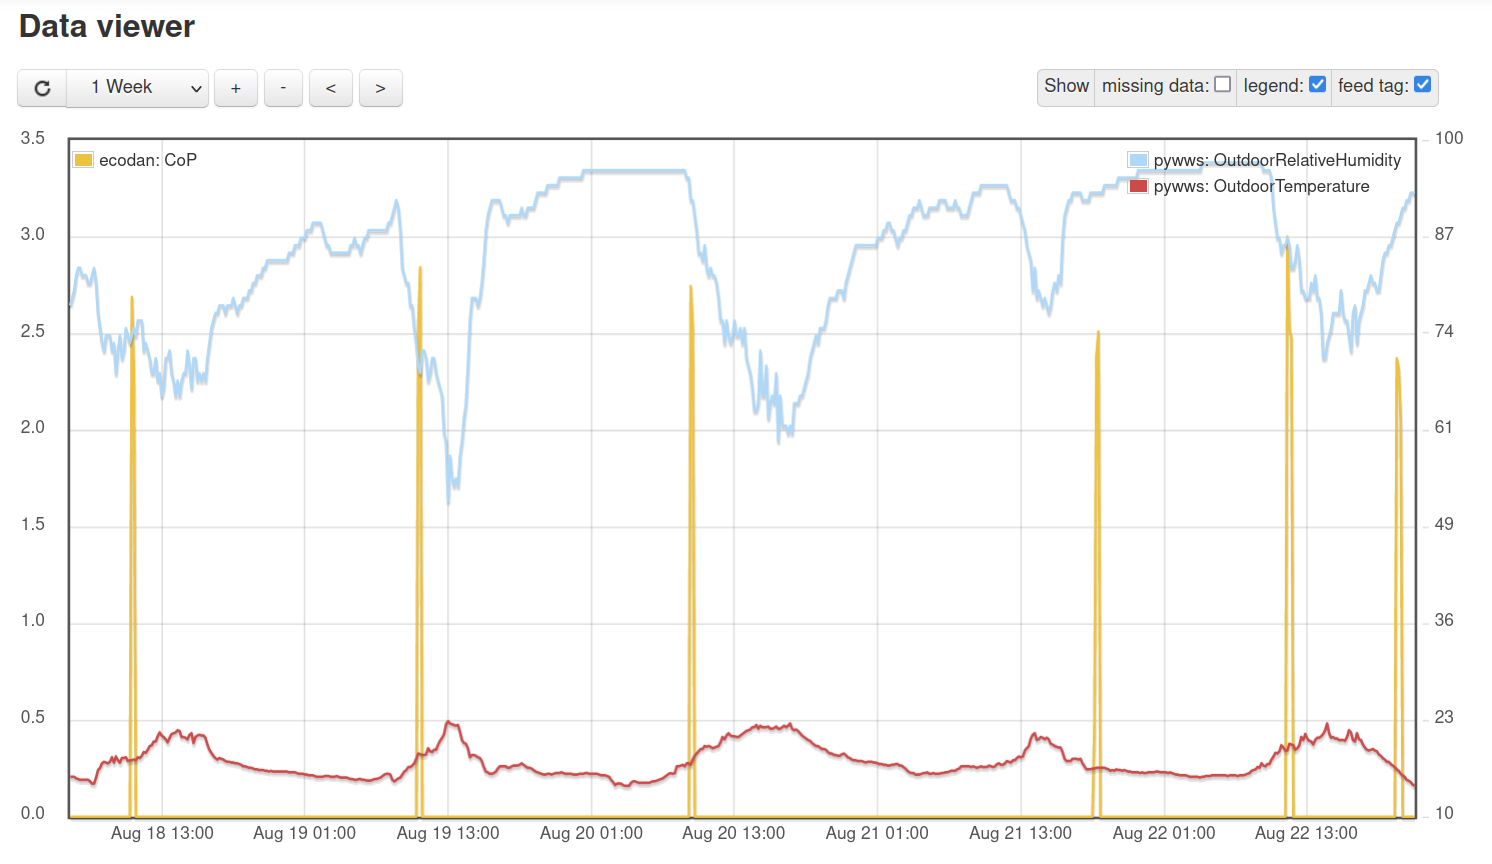
Note how the last two heating events are both at 86% humidity and the air temp only differs by 4 degrees, but the CoP varied between 2.4 and 2.9. I’m finding that other factors are affecting the CoP so much that the effect of the humidity change is being swamped. For example, you can see the humidity on the 19th was down to 70% but the CoP was still 2.8.
I don’t have a data table, but I do have millions of readings. I tried hunting down some more useful ones, but of course I see this pattern all too often:
The outdoor temp and humidity are inversely related (where I live) so when the humidity rises (and you’re hoping to extract more heat from the air) you find the actual air temp has dropped significantly enough to more seriously affect the CoP.
Here’s the raw data from above, filtered to just include times when there was heating.
I’ve put it in a separate post so I can remove it in case it’s annoying to folks.
Are these temps more useful as they are from April (when the humidity wobbles about more too)?
The jumpiness in the CoP comes from the way I grab the meter readings from the heat pump’s web site every minute. BTW this is an Ecodan 14kW inland in Yorkshire.
| Unix timestamp | ecodan:CoP | pywws:OutdoorRelativeHumidity | pywws:OutdoorTemperature |
|---|---|---|---|
| 1618244100 | 3.7 | 38 | 9.2 |
| 1618244280 | 3.5 | 37 | 9.1 |
| 1618244460 | 3.4 | 36 | 9.9 |
| 1618249500 | 12.3 | 64 | 6.5 |
| 1618249680 | 2.8 | 64 | 6.2 |
| 1618249860 | 4.2 | 65 | 6 |
| 1618250040 | 3 | 64 | 6 |
| 1618250220 | 4 | 64 | 6 |
| 1618250400 | 3 | 65 | 5.7 |
| 1618250580 | 3.6 | 66 | 5.4 |
| 1618250760 | 3.3 | 67 | 5.1 |
| 1618255080 | 2.5 | 80 | 1.4 |
| 1618255260 | 2.9 | 81 | 1.4 |
| 1618255440 | 3.5 | 82 | 1.4 |
| 1618255620 | 3.6 | 82 | 1.2 |
| 1618255800 | 3.8 | 82 | 1.1 |
| 1618255980 | 3.3 | 82 | 1.1 |
| 1618256160 | 2.8 | 82 | 0.9 |
| 1618256340 | 3.3 | 83 | 0.8 |
| 1618256520 | 3.2 | 83 | 0.8 |
| 1618256700 | 2.9 | 83 | 0.6 |
| 1618256880 | 3.1 | 84 | 0.8 |
| 1618257060 | 3.2 | 83 | 0.7 |
| 1618257240 | 5.6 | 84 | 0.6 |
| 1618260120 | 8.8 | 88 | -0.8 |
| 1618260300 | 2.7 | 88 | -0.9 |
| 1618260480 | 2.3 | 89 | -1 |
| 1618260840 | 2.8 | 90 | -1 |
| 1618261020 | 2.7 | 90 | -1 |
| 1618261200 | 2.6 | 90 | -0.9 |
| 1618261380 | 2.6 | 90 | -1.1 |
| 1618261560 | 1.6 | 90 | -1.4 |
| 1618264080 | 2.4 | 92 | -2 |
| 1618264260 | 3.3 | 92 | -1.8 |
| 1618264440 | 2.9 | 92 | -2 |
| 1618264620 | 2.9 | 92 | -2.1 |
| 1618264800 | 2.9 | 92 | -2.1 |
| 1618264980 | 2.4 | 92 | -2.3 |
| 1618265160 | 3 | 92 | -2.5 |
| 1618265340 | 2.5 | 92 | -2.4 |
| 1618265520 | 3.2 | 92 | -2.5 |
| 1618265700 | 2.7 | 92 | -2.5 |
| 1618265880 | 2.4 | 92 | -2.6 |
| 1618266060 | 2.7 | 92 | -2.6 |
| 1618266240 | 2.4 | 93 | -2.6 |
| 1618266420 | 2.4 | 93 | -2.5 |
| 1618266600 | 2.6 | 92 | -2.7 |
| 1618273980 | 8 | 93 | -1.9 |
| 1618274160 | 2.2 | 92 | -1.8 |
| 1618274340 | 2.4 | 90 | -1.5 |
| 1618274520 | 2.7 | 87 | -1.1 |
| 1618274700 | 2.9 | 85 | -0.7 |
| 1618274880 | 2.6 | 84 | 0.8 |
| 1618275060 | 2.3 | 80 | 0.8 |
| 1618275420 | 4.2 | 78 | 1.1 |
| 1618277400 | 1.1 | 68 | 3.7 |
| 1618277580 | 1.9 | 64 | 4.1 |
| 1618277760 | 2.7 | 62 | 4.5 |
| 1618277940 | 2.6 | 60 | 5 |
| 1618278120 | 4.5 | 59 | 5.3 |
| 1618280280 | 14.7 | 57 | 7.5 |
| 1618280460 | 1.9 | 57 | 8.1 |
| 1618280640 | 2.7 | 56 | 8.2 |
| 1618280820 | 2.7 | 55 | 7.9 |
| 1618281000 | 2.4 | 55 | 8.3 |
| 1618281180 | 2.3 | 56 | 9.3 |
| 1618281360 | 2.1 | 49 | 9.5 |
| 1618281540 | 2.7 | 50 | 9.7 |
| 1618291980 | 6.8 | 39 | 11.3 |
| 1618292160 | 2.8 | 42 | 11.5 |
| 1618292340 | 2.8 | 39 | 11.4 |
| 1618292520 | 3 | 39 | 11.3 |
| 1618292700 | 2.9 | 40 | 11.2 |
| 1618292880 | 2.8 | 41 | 11.5 |
| 1618293060 | 3 | 41 | 11.5 |
| 1618293240 | 2.9 | 41 | 11.9 |
| 1618293420 | 2.6 | 37 | 12.5 |
| 1618293600 | 2.8 | 40 | 12.4 |
| 1618293780 | 3.9 | 41 | 11.7 |
| 1618294140 | 2.6 | 43 | 10.7 |
| 1618294320 | 2.6 | 49 | 10.2 |
| 1618294680 | 2.9 | 54 | 10.1 |
| 1618294860 | 2.9 | 52 | 9.8 |
| 1618295040 | 3 | 53 | 9.8 |
| 1618295220 | 2.9 | 52 | 9.7 |
| 1618295400 | 2.8 | 55 | 9.5 |
| 1618295580 | 2.7 | 54 | 9.3 |
| 1618295940 | 2.8 | 58 | 9.1 |
| 1618296120 | 2.9 | 59 | 9 |
| 1618296300 | 2.7 | 59 | 9.1 |
| 1618296480 | 2.9 | 59 | 9.3 |
| 1618296660 | 2.9 | 61 | 9.2 |
| 1618296840 | 2.8 | 63 | 9.5 |
| 1618299900 | 3 | 65 | 8.2 |
| 1618300080 | 3.3 | 67 | 8.2 |
| 1618300260 | 3.5 | 68 | 8 |
| 1618300440 | 3.7 | 69 | 8 |
| 1618300620 | 2.9 | 71 | 7.9 |
| 1618300800 | 3.6 | 71 | 7.8 |
| 1618300980 | 2.7 | 71 | 7.7 |
| 1618301160 | 3.6 | 71 | 7.6 |
| 1618301340 | 3.3 | 71 | 7.5 |
| 1618301520 | 3.2 | 73 | 7.4 |
| 1618301700 | 3.2 | 73 | 7.3 |
| 1618301880 | 3.2 | 73 | 7.4 |
| 1618302060 | 3 | 73 | 7.2 |
| 1618302240 | 3.3 | 76 | 6.9 |
| 1618305480 | 6 | 70 | 6.1 |
| 1618305660 | 3.8 | 73 | 5.9 |
| 1618305840 | 2.9 | 73 | 5.8 |
| 1618306020 | 3.3 | 72 | 5.8 |
| 1618306200 | 4.1 | 67 | 5.6 |
| 1618306380 | 3.5 | 65 | 5.7 |
| 1618306560 | 3.7 | 69 | 5.7 |
| 1618306740 | 3.6 | 71 | 5.5 |
| 1618310340 | 5 | 71 | 3.2 |
| 1618310520 | 3.9 | 73 | 2.9 |
| 1618310700 | 3.2 | 74 | 2.5 |
| 1618310880 | 3.6 | 76 | 2.1 |
| 1618311060 | 3.8 | 78 | 2.1 |
| 1618311240 | 3.9 | 75 | 2.4 |
| 1618311420 | 3.9 | 75 | 2.5 |
| 1618311600 | 3.9 | 74 | 2.5 |
| 1618311780 | 6.6 | 75 | 2.3 |
| 1618314660 | 0.7 | 86 | 0.9 |
| 1618314840 | 2 | 87 | 0.7 |
| 1618315020 | 1.9 | 87 | 0.4 |
| 1618315200 | 1.8 | 88 | 0.5 |
| 1618315380 | 11 | 88 | 0.5 |
| 1618315560 | 2.2 | 89 | 0.5 |
| 1618319340 | 1.8 | 92 | -0.8 |
| 1618319520 | 3.5 | 93 | -0.9 |
| 1618319700 | 3.9 | 93 | -1.1 |
| 1618319880 | 4.6 | 93 | -1 |
| 1618320060 | 3.9 | 93 | -1 |
| 1618320240 | 3.9 | 93 | -0.9 |
| 1618324380 | 4 | 94 | -0.1 |
| 1618324560 | 4 | 94 | 0 |
| 1618324740 | 3.1 | 94 | 0 |
| 1618324920 | 3.8 | 94 | 0.2 |
| 1618325100 | 4 | 93 | 0.4 |
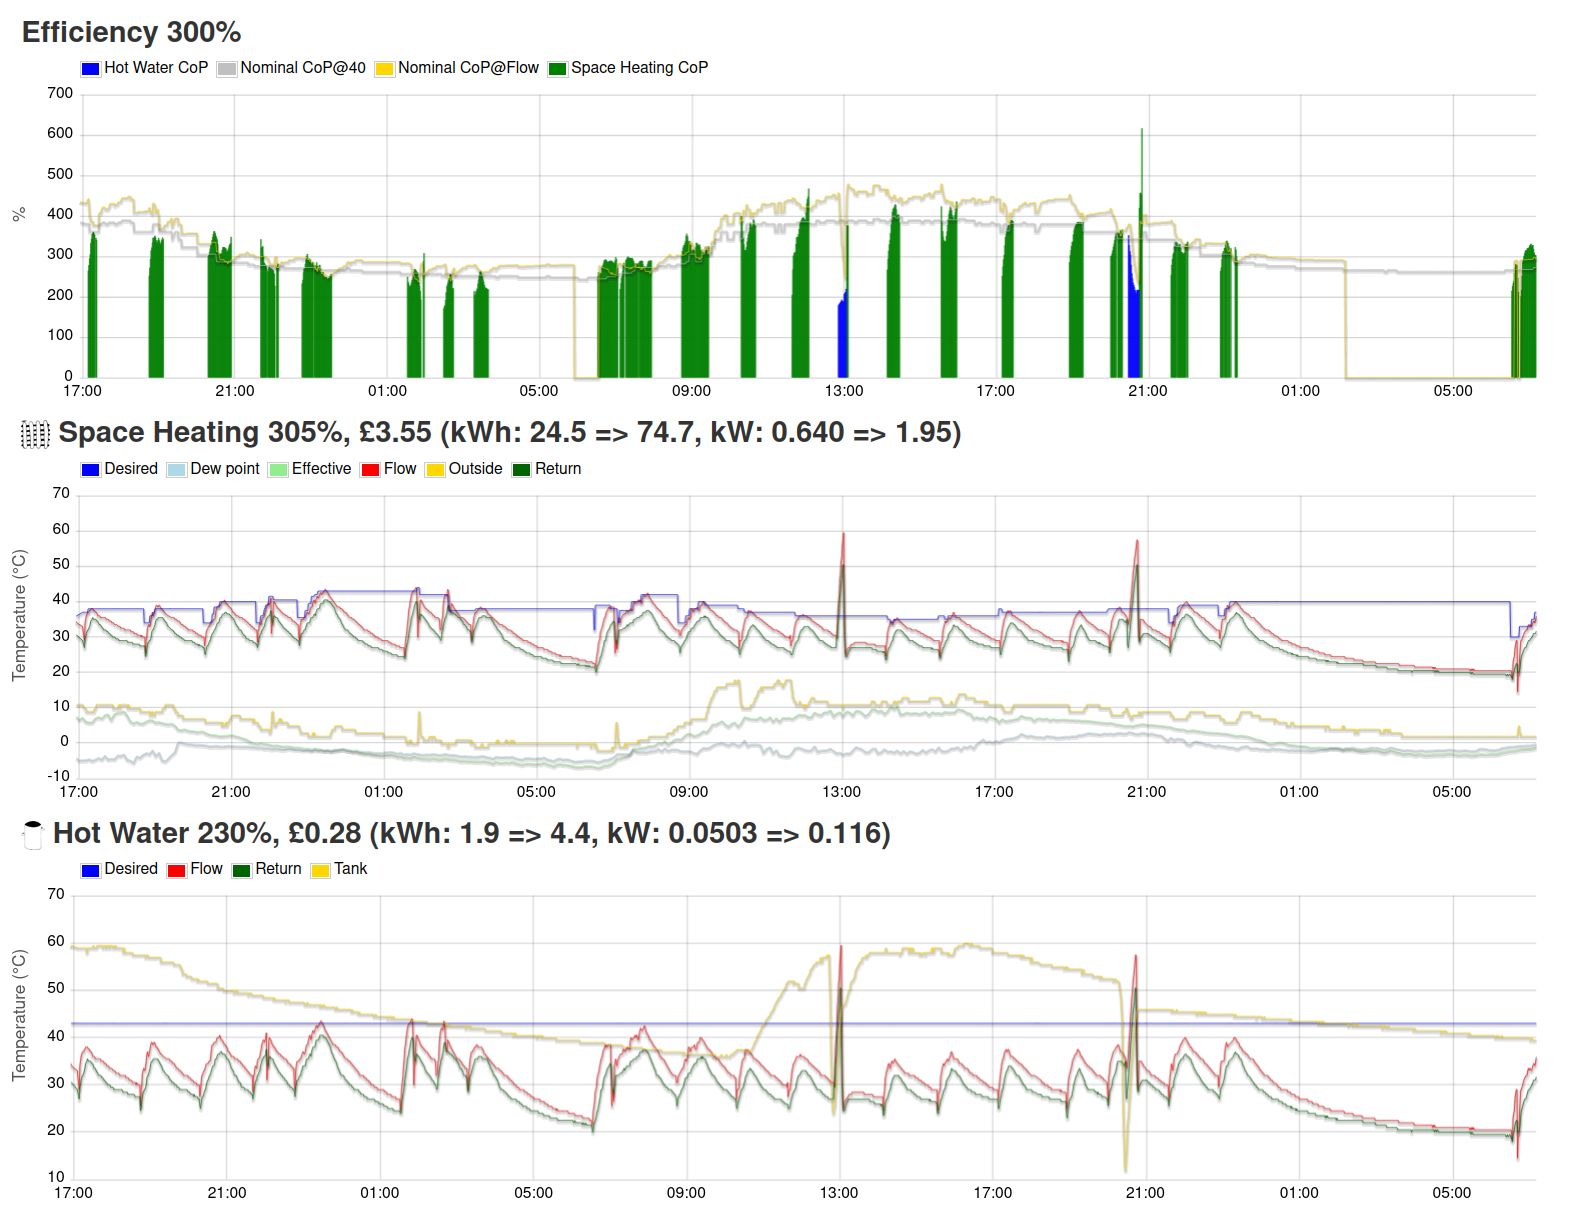
Oh, and here’s the heat pump’s view of the world during that time (with the CoP smoothed out a bit). The blue bits in the efficiency graph are hot water heating and the green bits are space heating.
Note the dew point is usually lower than the heat pump’s view of the outside temp and also the effective temp (which takes account of the weather station’s temp, the humidity and wind speed). You can see that for some of the time the effective temp and dew point are the same. It didn’t rain during the time window I’ve shown.
I had always thought this was more the heat pump control aglorithm being ‘too eager’ to reach the room or flow temperature set point, given perhaps an assumption that most users would not want to wait for a slower but more efficient ramp up (more time spent at lower flow temperatures), could it be a combination of both or is it more to do with the compressor oil? Why does it need to run at higher power to move the oil in the compressor?
Here’s an example of my heat pump bringing the flow temperature up to 30C with the first 20 minutes here spent at higher output…
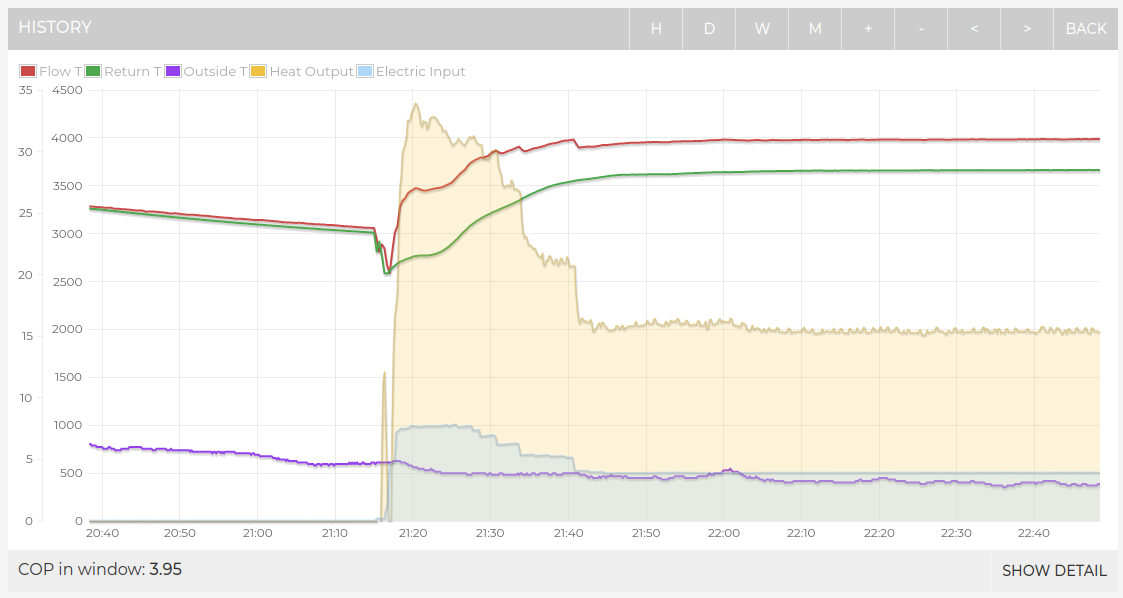
If it is a relatively simple closed loop control system, and unless there’s an adjustable limit on the heat output - which would have the effect of limiting the rate of rise of temperature, it will automatically run at full output until the comparator (looking at setpoint temperature vs actual temperature) comes out of saturation and lowers the demand for heat.
Yes thats what I thought, though it sounds like there may be another factor in here as well to do with compressor oil? But maybe that only needs a relatively brief run at high output? Would be really interesting to know what’s going on in a typical air-source heat pump’s control algorithm.
@moojuiceuk I have one of those “massively oversized” heat pumps and it does struggle to modulate down far enough.
I thought I’d mention that I have a reasonable workaround where turn the heat pump off pretty often:
Which of course brings us round to your point about the start-up being power-hungry.
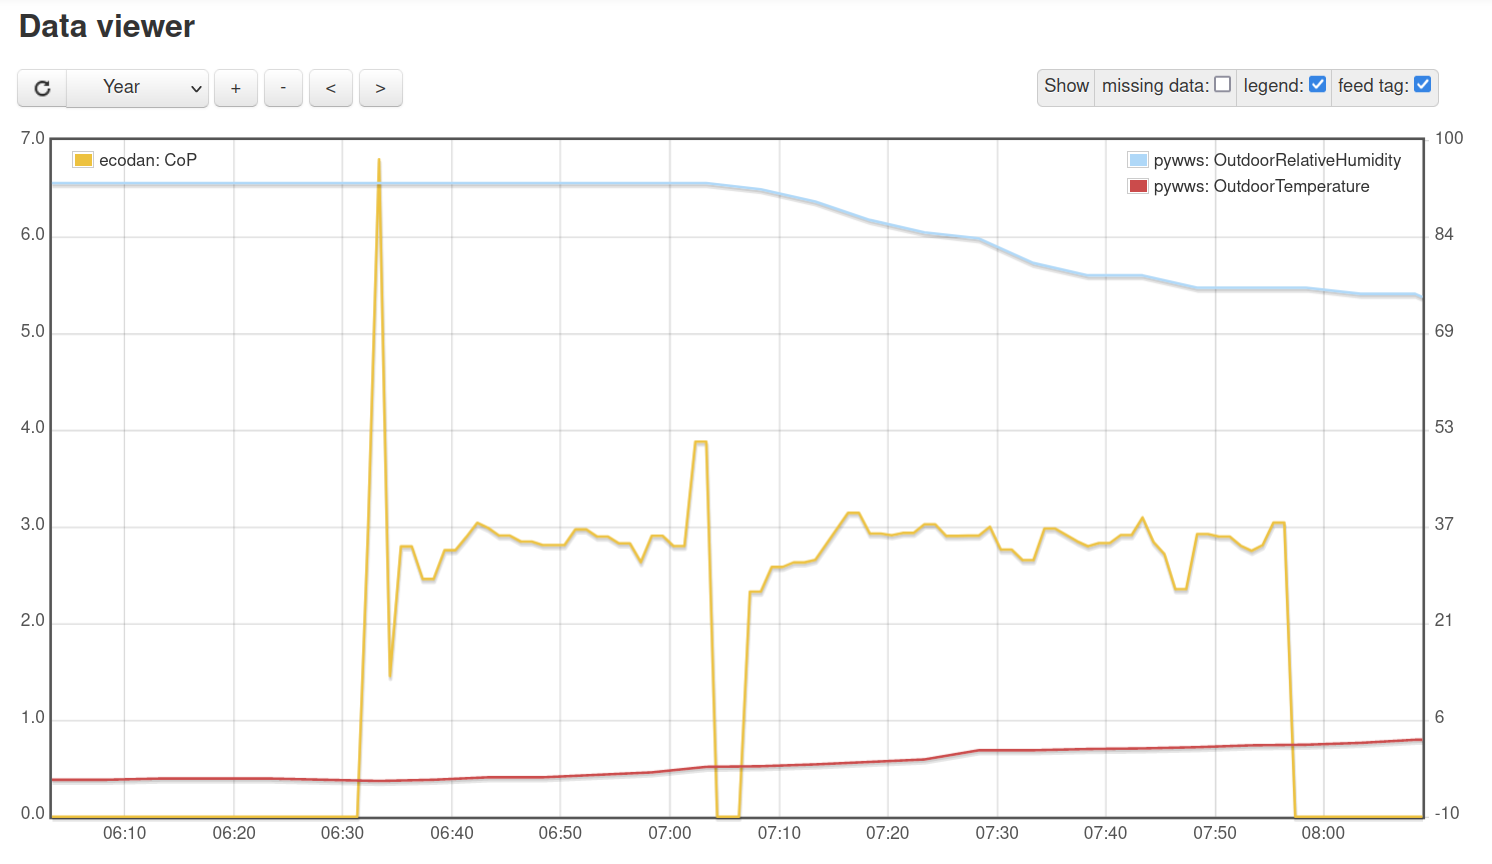
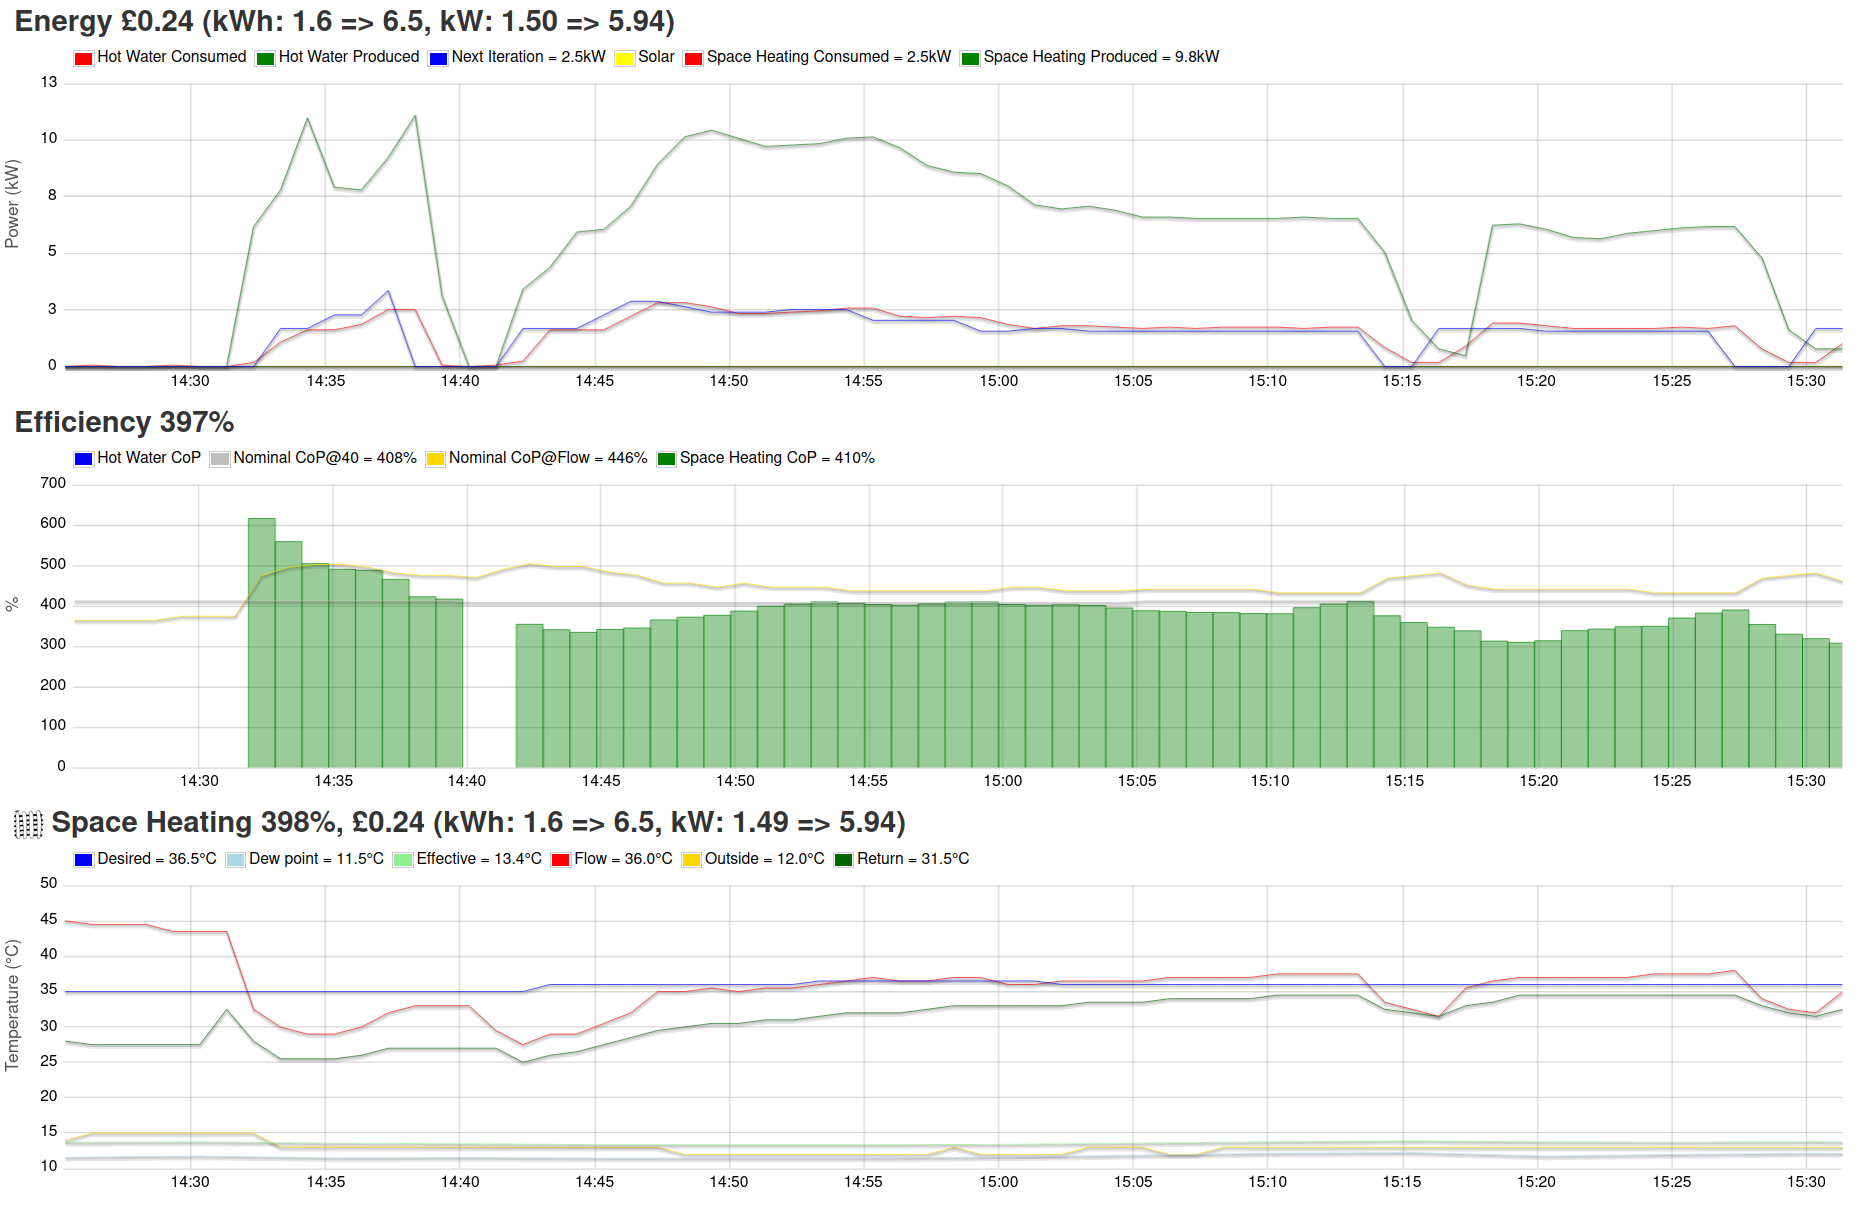
Here’s the default Ecodan control algorithm which does use more power at start up and then settles down to something lower:
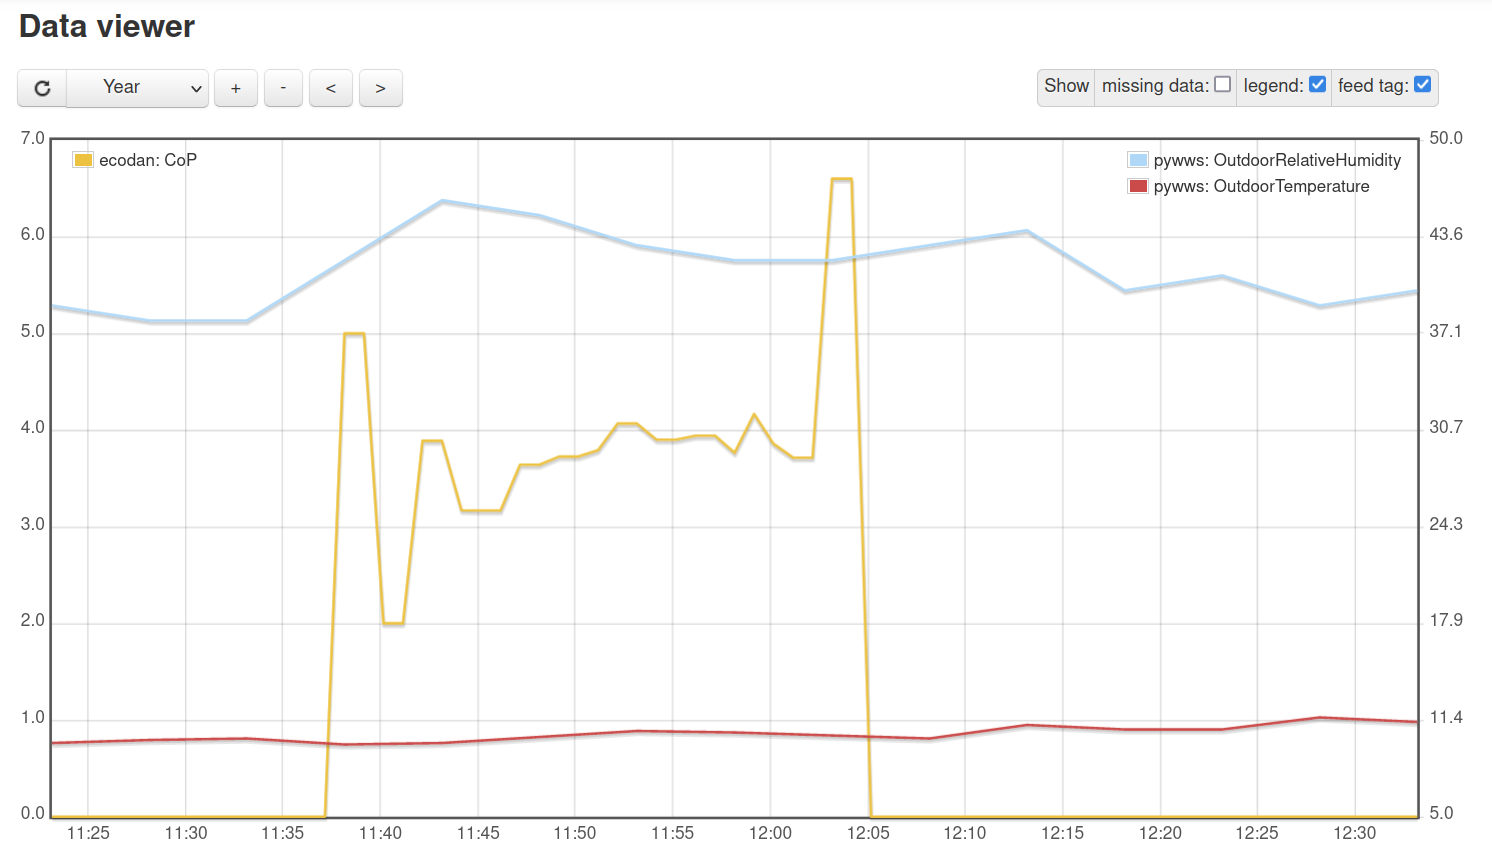
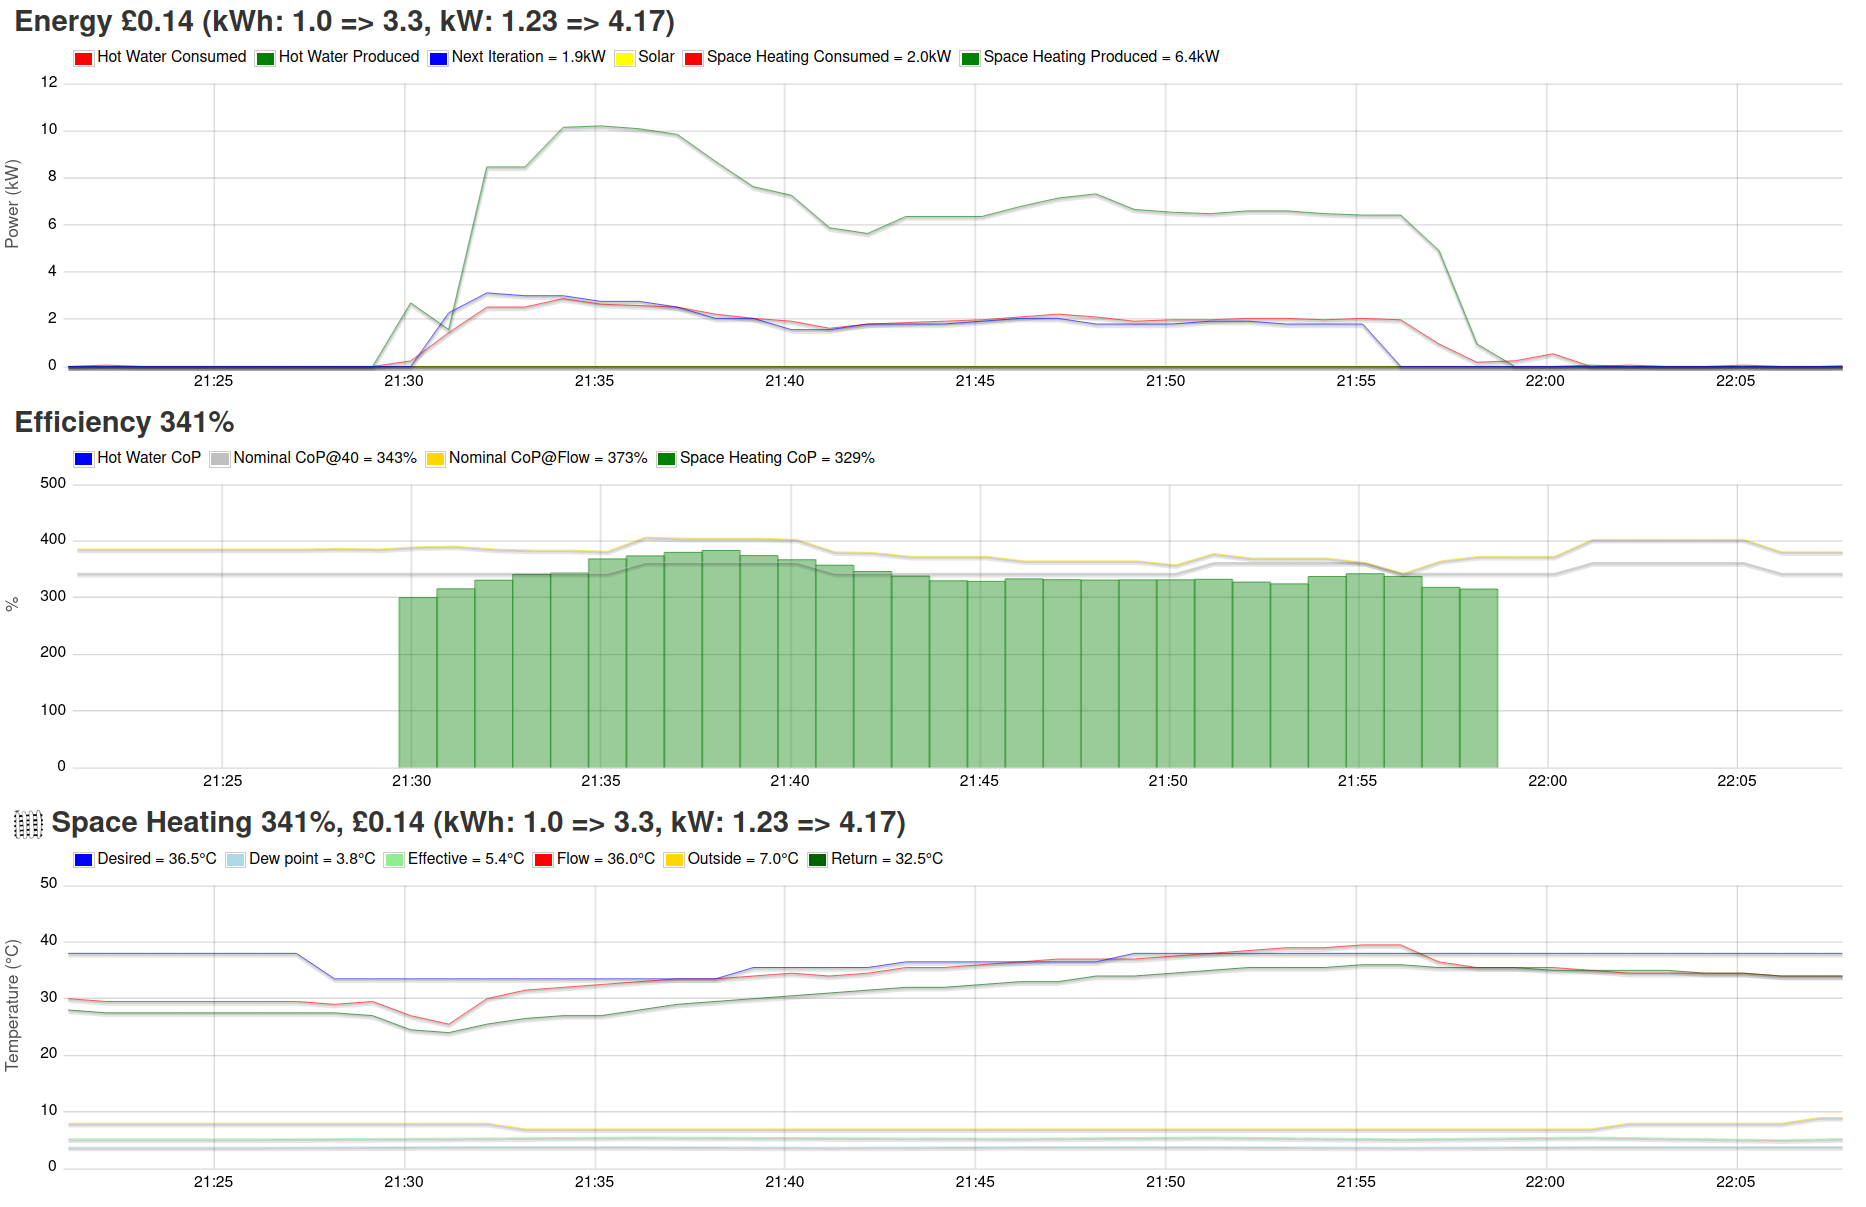
Below is my control algorithm attempting to hold it back a bit by starting with a target temp of 33.5 and walking it up to 38. It still runs away a bit at the start as you describe. I’ve tried various ways to hold it back but if I reduce the target too far the heat pump declares victory and shuts itself down which means it’s not amortizing the startup over a reasonable run. Most of my runs are 15-30 minutes specifically to help amortize the startup cost.
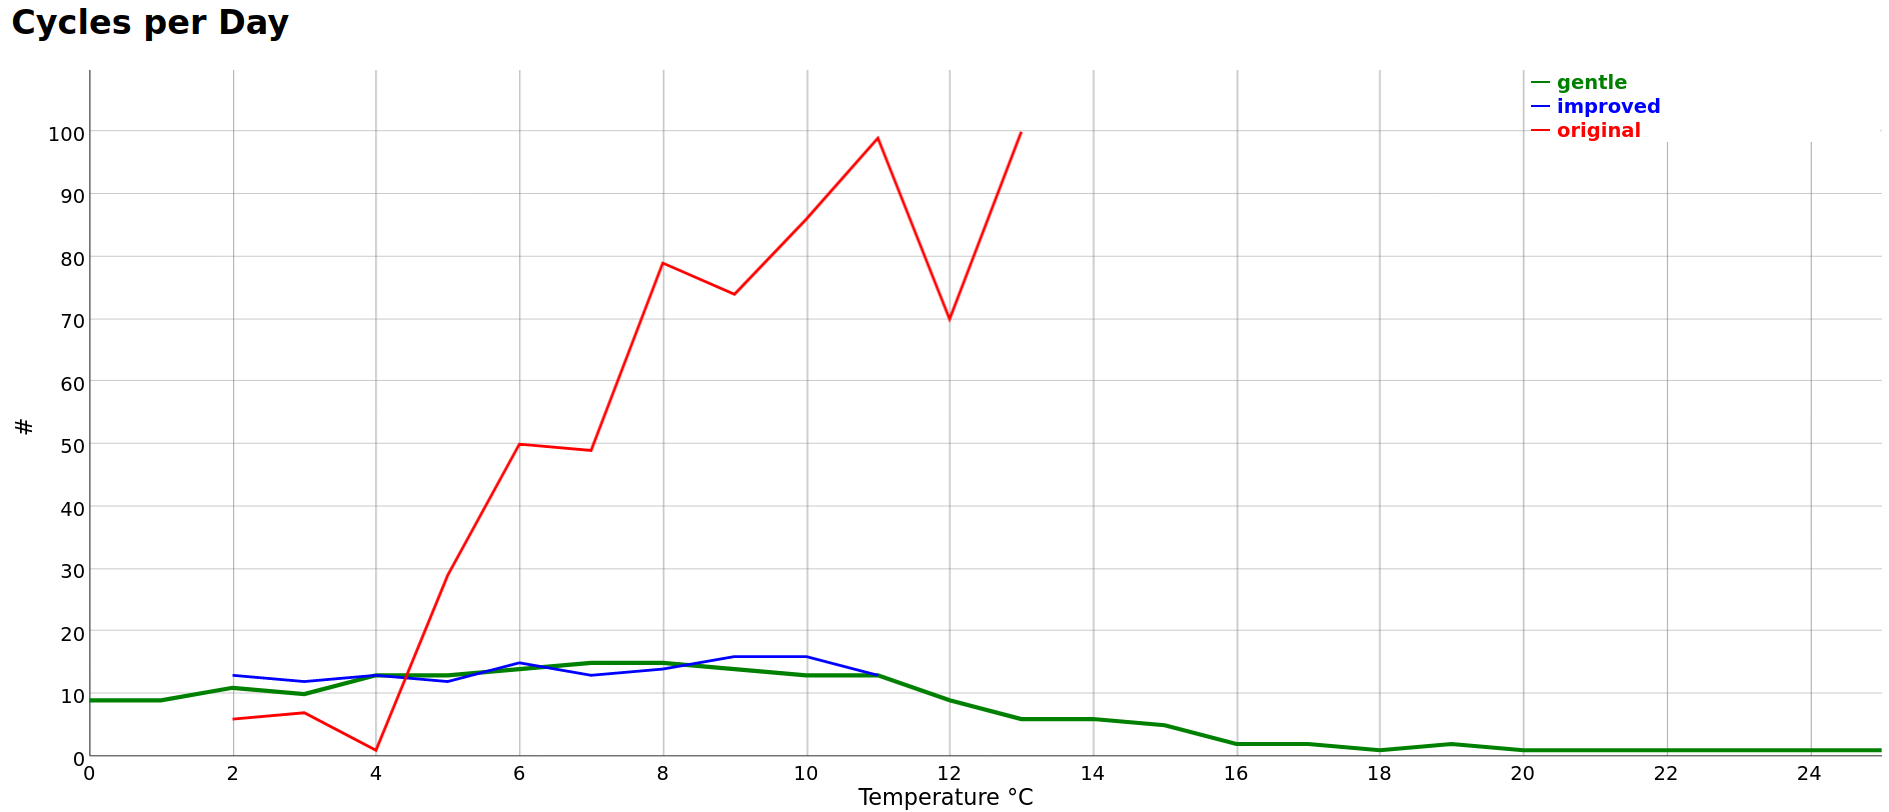
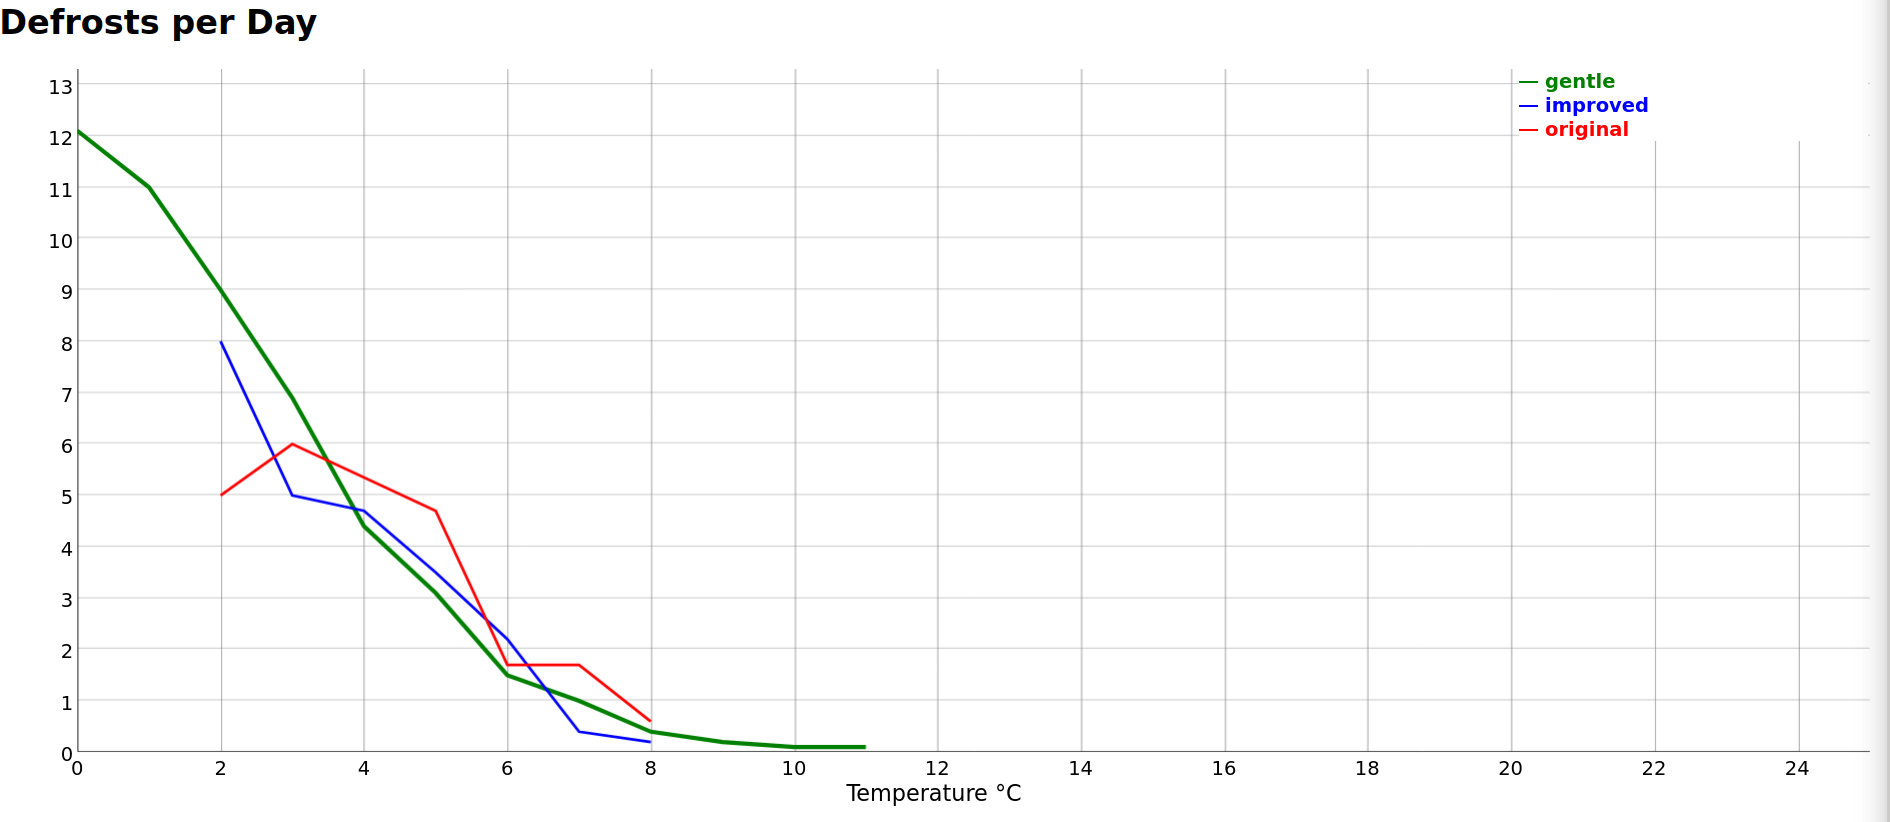
Of course I’ll claim my oversized heat pump is “for those bad days” and in fact it did cope really nicely in February 2021, but that type of cold is pretty rare. At least on the bright side my “gentle” control algorithm is stopping it cycling as much as it was on the “original” Ecodan algorithm which you can see in the chart below (which will make you fall off your chair):
Hopefully this’ll help people consider using more reasonably-sized heat pumps, but as Hugh is intimating, it’s hard to get a really accurate calculation without taking all the factors into consideration. I thought your analysis of the situation was pretty good moojuiceuk.
@HUGHG Not a problem to write out a long message as I don’t mind sharing my thoughts on this sort of thing.
Average humidity in the UK can vary quite a bit according to this site: Average Humidity in the United Kingdom - Current Results
If it’s a foggy day, you have to assume it’ll have a very high humidity and on a hot summers day with no rain in weeks, fairly low. It’ll vary quite a bit all over the country. Given the defrost cycle is going to have a negative impact compared to milder days and generally speaking kW output of most heat pumps declines as you fall in ambient temperature towards 0C ambient temp, I would look at the kW output graphs vs ambient temperature to aid sizing rather than worry too much about the effects of humidity.
As for compressor control algorithms, each manufacturer has its own ways they employ when it comes to inverter control and protecting the compressor. Many compressors have a minimum run time that they must run for to prevent undue wear on bearings etc. Running a compressor at a fixed RPM for a set time on startup helps the system to stabilise within a likely safe operating zone inside the compressor envelope. It will also help ensure the oil is returned to where it needs to be. After a time has elapsed, it’s likely a PID algorithm takes over to monitor kW output, looking at flow and return temperatures and the rate of change of temperature.
See note from Copeland on this topic: Determining minimum run time for ZP*KB compressors
and this Recommended minimum run time from startup to shutdown for scroll compressors
and if you want an example of some generic application notes Copeland provide as an example for OEM system builders have a look at this: https://climate.emerson.com/documents/copeland-scroll-variable-speed-compressors-xhv0181p-to-xhv0382p-application-guidelines-en-gb-5260810.pdf
Interesting @MyForest mentions wind speed. I’ve watched an electronic expansion valve play hunt the suction superheat setpoint value game before where there is a varying, yet very strong wind present. Wind conditions can have a noticable impact on performance.
On the fixed speed systems I work with, there is a 6 or 7 minute minimum run time to ensure compressor longevity. After that time has elapsed, the heat pump controller then looks at the return set temperature to see if the target has been met, and if so, switch off the compressor. If return set point + hysteresis is met before the minimum time has elapsed, tough, compressor will keep going until its minimum run time has finished. Protection of compressor comes before niceties of exact hit set points.
If set point has not been met after x elapsed time, then it will increase in power stage by bringing on another compressor (on multi compressor systems) and monitor that for x mins before deciding if another compressor is needed or not and repeat.
The only things that can stop a system I work on before “minimum run time” has completed are safety events such as a high pressure event, hot gas stat triggered, soft starter error, low pressure event, loss of control of electronic expansion valve, sensor fault etc. All those are safety critical events which take higher priority than minimum compressor runtime.
There is also a rule that the electricity Distribution Network Operators like heat pumps to obey and that is not to perform more than 3 compressor starts per hour. It is likely this rule is programmed into most heat pumps sold in the UK, but it’s worth bearing in mind if you have a no-name Chinese built thing off ebay churning away in the back garden as a DIY affair.
One thing that might be worth looking at in oversized heat pump installs is an inline buffer tank on the heating circuit (but check with the manufacturer first!) Increasing heating circuit system volume will increase run times, decrease starts per hour / starts per day and with inverter controlled setups, might allow longer running at a lower RPM state where the CoP figures may well be higher. It also gives greater thermal energy to assist with reverse cycle defrosts. It can also give a potential mounting point to backup immersion elements for the heating circuit if no backup or flow boiler is in situ.
Thanks for the Copeland links @moojuiceuk will read through the application guide that looks really useful!
I wish we’d done that with ours @moojuiceuk , but the installer wasn’t keen and I deferred to them. They got lots of other things right so I’ll forgive them one little oversight.
It transpires that having lots of huge radiators is actually acting like a fairly sizeable buffer tank. By running the pump for 15 minutes and then shutting it down for 15 mins we’re letting the heat gently drain from the radiators and we don’t even need a pump to keep pushing the water from the buffer tank to the rooms. I was expecting this to cause comfort issues as the room temps oscillated, but the flow temp is so low the occupants barely know when the heating is on or off. You don’t get that sudden hot blast you might get with a 60 degree system. As a result the radiators are like a big warm dog in the room and just keep it gently warm.
Of course the actual run / cool down duration is based on the flow / return temps and when it’s off then it’s watching a reading that is practically a radiator which tells when it’s cooled down. Typically it lets them get down to about 26 degrees and then jumps back into life. As you say, there’s a minimum run-time in the algorithm too, which was for startup-cost amortization, but I’m now glad to hear that’s helping protect the compressor.
Thanks again for your explanations.
Hi David Bowen,
Thanks for this very interesting information that gives a clear idea of the affect of RH on CoP
I have taken the thirteen temperatures above 10 degrees ( eliminating the fourteenth as it was clearly an anomaly)
Also the thirteen lowest temps and averaged both the RH and Temp far each set. The results below:
| Cop | RH | temp |
|---|---|---|
| 2.85 | 41.85 | 11.4 |
| 2.69 | 92.15 | -2.42 |
I would expect a lower CoP for the second temperature (13 degC lower)
However as you can see the CoP for the 2 sets is remarkably similar (due to the higher RH at the lower temp)
This gives me confidence in the performance of ASHP in lower temperatures.
There is still the problem of icing at lower temperatures, however it shows that the CoP is remarkably consistant (due to latent heat in water vapour).
Thanks again, Hugh
[Second (almost identical) post merged. Moderator (RW)]
Hi @HUGHG
I’m glad you were able to use that information and come to a conclusion about the behaviour.
As you mentioned de-frost I thought you might like some data on that.
In this chart I have the average daily temperature on the x-axis and the average number of defrosts on the y-axis. This might give you an idea of how prevalent de-frosts are.
Bear in mind that:
- the variation around the average on any one day could be quite different (so all the “2 degree average” days will be different for example)
- I typically only run my system from 6 am until midnight
- I’m in dry, flat, sheltered countryside about 50 miles from the coast
- the impact of each algorithm (e.g. “improved”) didn’t actually alter defrost behaviour much
- we don’t have a buffer tank so the heat for defrosts is being pulled from our more-than-ample radiators
- as occupants, we aren’t aware of the defrosts - it doesn’t noticeably affect the room temps
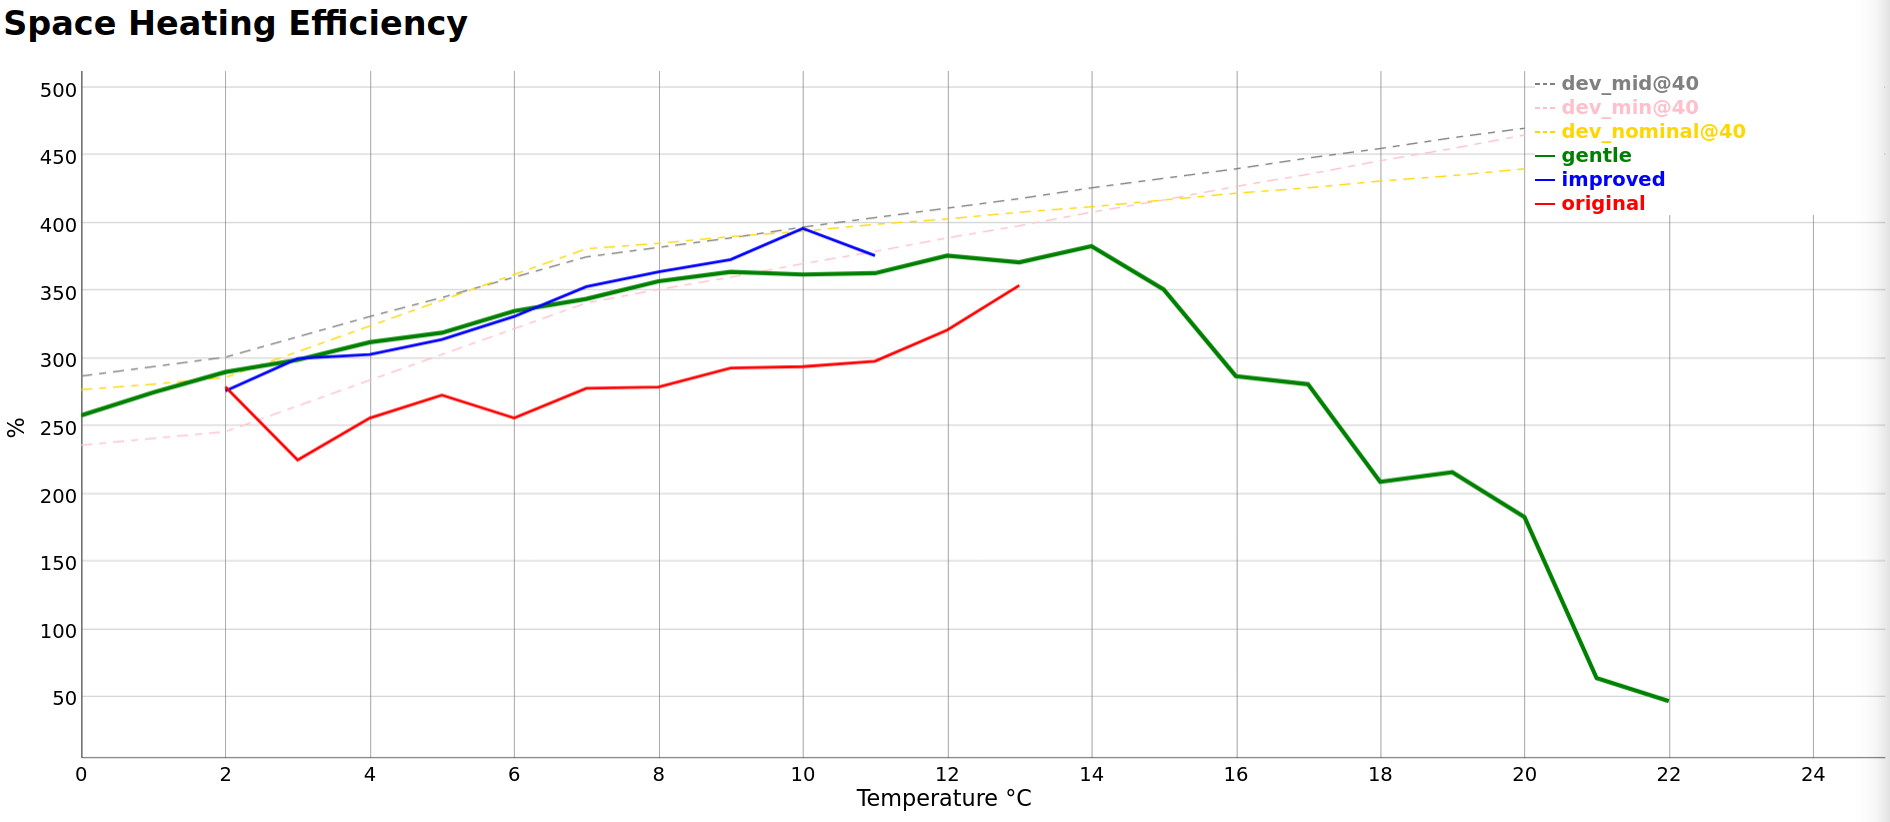
I believe the other real-world chart you might be interested in is this “CoP vs Temp” one. Again, the x-axis is average daily temp. I’m mostly posting it here so you can see that we’re somewhere near the manufacturer’s guidance (the dotted lines) so although we are all sceptical of published stats, they do roughly reflect reality. The drop off after 14 degrees is because the heat pump runs for much less time and doesn’t get a chance to get into it’s happy place.
Hi David,
I also have a Ecodan 11kW and had it running for just over a year.
The COP is quite disappointing (probably around 2 as an average).
However, I am not sure how reliable a measure it is as I am getting the data from MelCloud which says it is “estimated” only, and the resolution is only dayly.
you mention reading the COP from the pump’s website. Could you clarify how you do that? Which website is that?.
Thanks.
You might find the topic below a useful read, as it talks about another user’s trouble with this unit:
If you’d like help understanding the performance of your own system, it might be best to start a new topic.
Hi Tim, thanks for the link, it indeed looks useful as it discuss accuracy of the measurements reported by melcloud.
I am still wondering where the data for the graphs shown on this thread is coming from.
I can’t see information about heat generated with a lower resolution that a day through melcloud.
Is there a way to access more detailed information?