I know this is somewhat of a cheek bearing in mind OEM is a paid for service/product, but there must be many of us on this forum (?) who need the advice, but don’t have the monitoring equipment (I know there’s at least 1 !!) - what I’m referring to is a display field that could be filled in randomly by users on the heatpump stats website that would show what the manufacturer (eg Vaillant) COP figure was saying that could be compared with the actual COP figure being generated by the much more accurate OEM stuff. It would give us data-less owners at least a pointer to how our systems are performing compared to better monitored/installed setups.
I read somewhere that the data coming from at least Daikin’s MMI was a bit pessimistic compared to the aftermarket fitted monitor apparatus.
Would be great to see what you suggest.
The Daikin’s data is neither pessimistic nor optimistic. It just has a (relatively) high degree of error, for two main reasons:
- The MMI records electicity use and heat produced rounded to the nearest kWh over each two hour period.
- The temperature sensors are not calibrated, so each individual unit may be under or over-reporting heat production.
The only way to be able to tell if your system is accurate would be to have MID monitoring setup and compare the data with the MMI.
@mortstar is right. From the data we’ve seen, onboard monitoring can have significant errors, either underreporting over reporting depending on manufacturing tolerances or errors e.g given two identical heat pumps one may be significantly over-reporting COP and the other may be underreporting, unfortunately there’s no way of knowing unless you can compare with a MID meter.
See this thread for examples:
It’s usually safe to assume that the electricity is monitored correctly, the error is usually in the heat measurement.
Not quite sure you’ve understood the idea behind my post - it’s not so much about accuracy as being able to compare, say, a vaillant sensocomfort app provided COP figure against the same figure from an OEM monitored setup - so an OEM monitored user might enter a figure, on a certain date, of a Vaillant app COP of eg 5; their OEM setup provides a COP on that same date of say 4.65. If their setup rates highly on the top of the COPs table, and on that same date, my Vaillant app COP was also 5, then in theory my system is sort of running at a similier efficiency as theirs, and as such would also then be high on the COP table.
If @mortstar and @glyn.hudson are right, then that is exactly what you cannot say. They are saying the COP Vaillant reports is within an as yet undefined tolerance band of the true (MID measured) COP, so all you can claim is your true COP might be 4.65 When a sufficient number of systems on Heat Pump Monitor report both ‘claimed’ and ‘actual’ COP, it should be possible to get values for the observed limits of accuracy for the COP as reported by the Vaillant app.
I’m still not getting my idea over correctly. I’ll try again.
Lets say Fred’s system has a proper OpenEnergyMonitor COP of 5 on a particular day, and he has a 5kw Aro+. His vaillant app says his COP is 457. I’m using that ridiculous figure to show that I’m not interested in the accuracy of the 457; what I’m interested in is the fact that “my” vaillant app COP also says on the same day 440. From that I can have a look at Fred’s position in the Top of the COPs, and since my 440 is similiar to his 457, I’d guess that my system was running at about the same sort of efficiency - again, not interested in exacts, but just a clue that mine can’t be doing too bad, and I can stop worrying about wether I’m losing lots of money for no reason.
Every Vaillant heat pump has differing amounts of error on the onboard monitoring, so it’s impossible to compare your figures with anyone else’s figures with any degree of certainty.
That’s the reason we use MID meters which have a guaranteed level of accuracy, only then can we compare figures with confidence.
I’m sorry, but I’m afraid you don’t understand the concept of component tolerances. There’s plenty written about it, both before the Internet became ubiquitous and since, so I recommend some background reading. But to save a little time, let me create an entirely fictitious example:
I have a heat pump, it reports a COP of 3.2. You have the same model, it reports a COP of 4.8. Your friend across the road has a different make of heat pump with MID metering and that records a true COP of 4.7.
What you’re saying is you can legitimately claim that your heat pump also has a COP of around 4.7 - 4.8 What we don’t know is the manufacturer of our heat pumps fits sensors that combined have a 25% tolerance band, but they test the heat pump and if the COP is within 20%, they ship it to the customer, otherwise they replace the sensors and test it again.
Now what if my heat pump’s sensors happened to be just inside the bottom end of the tolerance band and yours happened to be just inside the top end? We could both have heat pumps whose true COP was 4.0. Sorry, yours is 15% worse than your friends, not 2% better.
I’ll try again !! Lets say Freds system (see above) is the same model, and firmware level of aro+ as mine - so the only variable really is the heating system itself. If there are differing levels of error in the app reported COP, they should be similar enough to ignore as not changing the level of magnitude. Now, on a certain reported day, Fred tells us that his App COP is 7.2, and his OEM reports 6.75 - so a pretty good result. If my app reports 4, it’s not going to be different errors that mean mine is so low, it’s going to be that mine just isn’t as efficient, for some reason (whatever that may be). But, say mine came back at 7.3 - Ok errors could play a part, but the bottom line is, if Freds system appears to be Top of the COPs, then mine must be running pretty damn good; I don’t care what the figure means, or should be, it’s just that I can compare with a properly monitored system on a good/bad/crap level.
Hi Jeffrey,
Vaillant’s errors can easily be 30-40% in either direction. Taking the upper end of that margin, with a true MID COP of 4, two arotherm heatpumps at the same hard/firmware level could show you a COP in the app anywhere between 2.9 to 5.6. You could have two identical houses right next to each other with the same heat pump and one would show 2.9 in the app, the other 5.6. This is such a wide margin that it’s absolutely useless to compare anything to it. COPs from all heat pumps in all conditions are all within the same order of magnitude (1-10), so you need much better accuracy to judge performance.
On the coldest day this year (-8°C), I had a COP of 2.9, on a +10°C day I get 5.8. This spans the whole range of outside conditions and essentially falls fully into the Vaillant error band.
Ok, well now I get it !! I hadn’t in my wildest nightmares thought the error margin could be that crazy; Thanks for the info, and I shall move on to my next anxiety causing issue.
While the heating system may be the the “only variable”, this is the main driver of heat pump performance even if measured accurately. Fred’s system could be running at a much lower flow temperature, so one would expect it to have better COP. Other temperatures (inside and out) would also factor into performance.
My main measure of heat pump performance is whole house cost of electricity versus temperature difference to achieve target temperature. This takes into account tariff used, heat pump efficiency and home heat retention etc.
I have found that with a comparatively very low cop (2.8 YTD) my whole house costs against both temperature difference and heat pump kWh output are far lower than gas and various time of use tariffs that I have tried, across all temperature differences.
Trying to measure and improve cop for my system has proven to be a red herring. I leave optimising flow temperatures etc to a remote algorithm and focus on monitoring cost performance.
Jeffrey, As many people have said, the data self-reported by the heat pump is not reliable.
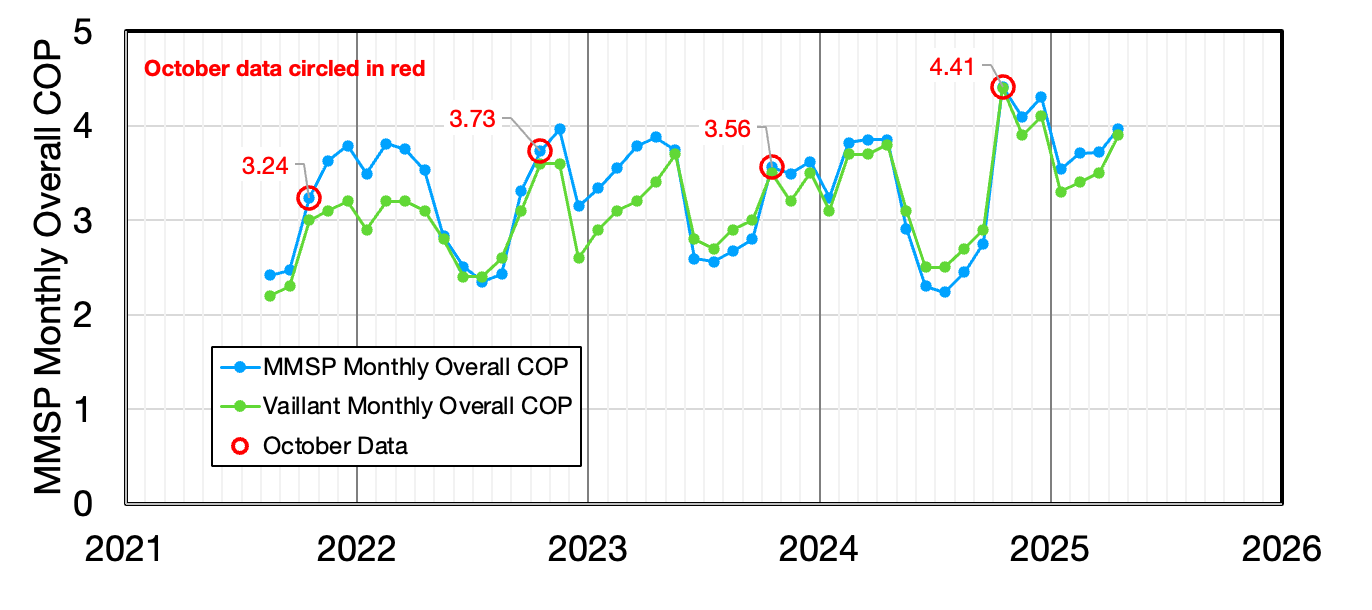
I have added a graph showing my comparison of MONTHY COP reported by my 5 kW Vaillant ASHP versus MONTHLY COP reported by my heat meter and monitoring system. Unfortunately it’s not linked to the Open Energy Monitor.
Back in 2022 the data was seriously in error, but in recent years it seems to be better. I really don’t know what has changed. That’s the problem!
Drop me a line if you would like more information: best wishes: Michael
i have seen vast differences in COP between the Daikin MMI compared with data collected directly from heat pump using ESPaltherma , the Daikin MMI is certainly optimistic and has huge rounding up numbers and issues with timing of data collection
the problem with the ESP altherma compared with the open energy monitoring equipment is where it’s measuring the data , OEM is measuring normally in the plant room where the ESPaltherma is measuring at the heat pump
not sure which is better but all data helps to improve the efficiency
Is space heating cop versus temperature difference really a linear relationship or do we just like to fit a linear line to the data?
If, as outside temperature falls the heat pump is trying to extract more heat from a diminished heat source (i.e. the colder outside air), then you would expect that it is having to work even harder and so require more kWh input for even less gain.
Similarly at higher outside temperatures the heat required is little but there must be some base load just to run the pump before any extraction - this effect is likely to be comparatively minor.
Certainly my cop v temperature difference plot points do not appear to follow a linear pattern - more like an inverted U - so I just question the suitability of a straight line fit.
My COP is quite linear in my data, as is the manufacturer datasheet data. The “U-shape” can be seen in the electricity requirement vs. outdoor temperature - if COP is linear with deltaT & heat required is also linear with it, then the required electricity goes with the square of deltaT. The pump power is indeed a simple additive term that becomes relevant at the heating threshold when very little heat is required.
Thanks, that explains what I am seeing when I plot heat produced, electric usage and cop.
My Samsung heat pump onboard monitoring on average underreported heat by 20% and over reported electricity by 5% resulting in a 30% lower SCOP e.g 3.2 compared to 4.3 from the MID certified meters.