Hi, I’m sorry if this question has been asked before but I wasn’t able to find an answer either on the old or on this new forum. I’m experiencing strange measurement fluctuations with the standard 100A OEM CT. I have 2 U-hooks installed in my electricity box, specifically for attaching my clamps. When I attach the CT at the bottom of the U-hook I get about ±200W changes every measurement cycle, producing sawtooth-like power curve when I zoom in. If I position the clamp on the straight part of the hook, they disappear.
I don’t have much experience with CTs and I found no specific instructions as how to put the meter on the wire. On the contrary, reading various posts on the net I got the impression that the position and angle doesn’t matter, I just need to make sure the wire runs inside the clamp. What is your recommendation? Do I maybe have a faulty CT (unlikely)?
The position and angle shouldn’t matter, and when I tried to measure it, it was masked by variations in current due to the voltage bouncing around (I don’t have access to a stabilised mains supply). Somebody published figures not very long ago showing a variation, not using the shop CT, of around the 1% mark, if my memory serves.
If you’re seeing a systematic variation on alternate measurement cycles, it’s more likely to be an external influence that happens to be synchronised with the measurements, or a timing difference in software. Though you haven’t said, I take it you’re using emonCMS?
Well, sorry, my native tongue is not English. I tried to describe the simple wire that forms something that looks like the letter U and hangs from the junction box. I can attach my clamp meters to them. One for the current flowing from the interver to the junction box and one between the utility meter and the junction box.
I made a series of test before posting here to make sure what I’m seeing is not a fluke. I started testing my new system and put 2 meters (one is the blue from OEM and one 30A model from the same manufacturer) on the same wire to see if they show any difference in measurements. There seems to be a negligible difference in their computed Wh totals for ~24 hours (about 170Wh), good. I decided to go live soon and attached the meters on their designated current hooks (wires). I then noticed the weird jagginess on the power measurements on the channel of the blue CT - removing the other CT changed its physical position on the wire. Moving it to the straight part of the hook eliminated the jagginess. Apart from the positioning, there was no other change. I plan to use EmonCMS (EmonSD on a Pi3 to be accurate), but for now I conducted my tests using a small shell script pushing data from the EmonTX to a Zabbix monitoring system.
My instinct says that what you are seeing is coming from the measurement or logging system, not from the CT. How are you sending the data from the emonTx to your logging system? Which sketch are you using in the Tx?
The YHDC CT is sensitive to magnetic fields from sources other than the wire it is on, but the effect is small, and listed in the test report in Resources > Building Blocks. The worst case was equivalent to 160 mA in the CT primary wire when 100 A was flowing in an adjacent cable touching the casing.
Again, I can understand that moving the CT might cause a slight change especially if the two halves of the core moved and added, altered or removed a small air gap, but I cannot see how that could repeat on alternate readings.
You have said that the change is about 200 W - but what is the base power - does 200 W represent a 10% or 1% or more or less fluctuation?
(Thanks for explaining “U-hooks” - I would call that a “test loop”.)
Data is received with a Moteino I wrote about in an earlier post. RFM69Pi implementation using a Moteino - #7 by kobuki
I filter lines printed on the serial line whose first word is “OK” and use simple shell arithmetics to post data using a Zabbix utility. These are among the the tools I use regularly so I know them pretty well. I don’t suspect faults here. But it’s for some tests only.
The fluctuation was modulated on a base power of around 6-700W so pretty significant. It sometimes stopped appearing for 5-10 cycles and during these periods it showed very little changes per measurement (I’d say “normal”). Again - the only thing I did was changing the position of the CT from the bottom of the U shape to the (left) side where it’s more or less straight, then watched the power curve. I can only think of some peculiar wire arrangement in the box above the test hook that influences measurements when the CT is placed in certain positions… I’m now using simple cloth clips for holding the CTs on the side to avoid future problems.
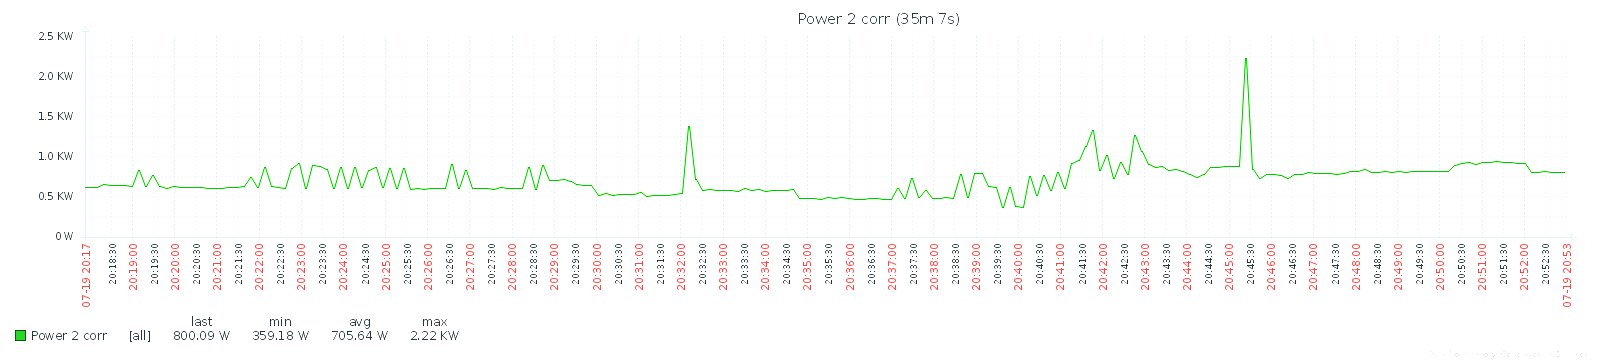
Attached are 2 chart images around the problematic part. On the first image you can see the state before and after playing around with the CT, arranging things, etc. On the second you can see the state after the problem with more details. After the spike on the right the CT has been positionied on the wire as I described above.
There’s another weird thing on the first image. That large ~2.5 kW streak on the left is after the rearrangement of the CTs. It didn’t really exist as consumed power. It disappeared after a reset of the EmonTX (unplug-replug). I credited it to the several changes I made and ignored it.
Dear me! If you knew that, as a Moderator, I look at every single post here, you would know why I didn’t link that to this thread. Even knowing that, I had to open up your profile and search back through it to find the thread.
I think I agree with that. Using power as a measure of current does not help when the operating voltage is unknown, but my 160 mA represents 40 W, so if it is an interfering magnetic field, it is quite substantial - something in the order of 500 Ampere.turns at close range.
Ah, sorry about the Moteino part, but I didn’t go into details because I don’t think it’s important in this problem. It’s just yet another Arduino-based receiver running one of the default sketches (and one that works well and is easy to work with).
Voltage is always staying around 240V ±5V without solar power production (during the problematic period, too), and those fluctuations are far bigger, so again I didn’t think it’s important. Interfering magnetic field of that order of magnitude is impossible near that junction box but I rather thought of something that changes the characteristics of the test hook, but ah well. I’m shooting in the dark, and have really no idea. Repositioning the clamp meter fixed it is all I know, hence this thread…
This question might not belong to this thread but since it’s the same setup I thought I’d ask here. Please guide me to the right forum if it’s a problem. I’m seeing these spikes on the chart where nothing should really happen. Green is utulity power, red is solar power. The spikes are only present on the former one. Is this considered normal? If so, are these filtered in EmonHub/EmonCMS or somewhere else? Is it a faulty CT, maybe?
EDIT: I realised solar should be unaffected since the current flow from the intverted is not influenced by the house load. It either flows out of the house (export) or the house uses it or both.
It is probably a silly question, but have you checked all the connections? An intermittent grounding of the CT input could create a current spike because the input is grounded when the plug is removed from the emonTx. (Take the CT off the cable, pull the plug out and you should see a big spike of power that dies away over a few tens of seconds, then another when you plug the CT back in.)
Also, are you checking the messages from your emonTx for validity - as well as the “OK” (which does not actually come from the emonTx itself), do you check the length? If a few bytes get missed, or the receiver gets out of step and decodes the data wrongly (which is possible if there’s a long string of zeros), that could cause no end of problems with false data being recorded.
I can re-check the connections again if the spikes persistently appear in the next few days. Otherwise they’re firmly plugged in.
The sketch I’m using unchanged is RFM69CW_RF12_Demo_ATmega328.ino. It checks the crc, does a few sanity checks and prints OK if all’s fine. In my script I check that the first field on the serial output line is “OK”. The spikes do appear in the messages messages as valid data (start with OK, proper number of fields). I also see some lines starting with “?” with less fields, garbage, etc, and I ignore them all.
If the spikes are coming in as valid, that seems to rule out any possibility of corruption in transmission or in the logging process.
They could be noise from something switching, and it was just chance that the pulses are at half your logging frequency.
One thing that I am reasonably certain of, the emonTx sketch does not by itself produce spurious values on alternate measurements. Are you powering the emonTx via the USB or an a.c. adapter?
The a.c. adapter then rules out a noisy USB 5 V power supply.
Why are the pulses always in the same direction? When you are importing, they show increased power. When you are nett exporting, they still head towards importing. That rules out an intermittent connection on the burden resistor and on the CT wiring.
I think it must be interference from somewhere. If the pulses are irregular, that points towards something switching and being picked up as interference.
Yes, I am suspecting something like that, too. But we don’t really have such a randomly switching device… All big consumers like water heater, usual household machines, etc. are under our manual control. I can clearly see the fridges coming on and off, too. There are 2 UPSes here, could they produce something like that? Anyway, these spikes last about 1 cycle only so they can’t influence the totals above the margin of errors. I will still find their cause, though.
I have to say that my immediate reaction to this post - was not really one of surprise.
Current clamps are small AC transformers (usually - although I’ll be the first to admit that I didn’t examine mine at this point) - AC/DC units use a hall effect sensor placed in a gap in the transformer coil to measure flux (I’m reasonably sure that the OOM unit doesn’t do this) and the AC only clamps are just a transformer using the field effect from the cable they are clamped around (as if setup like a single turn primary winding) to induce current in the secondary that is then measured.
If your clamp is not tight around your cable - it will not measure accurately, equally if the cable does not pass through your clamp at 90degrees to the ferrite “core” - it may not be accurate.
Your “U” of cable that you can putting the clamp on, is probably causing some additional effects outside of the clamp that the secondary is picking up, moving it to a straight bit of cable would be my suggested fix - I see you have already noted that this has the desired effect.
My assumptions are that the part of the cable passing through the clamp is:
not straight
not a tight fit.
close to another part of the same cable
The last one from above is probably causing some “noise” that is slightly off phase from the measured current, so sometimes reads higher and sometimes reads lower depending on the point of the phase where the measurement is taken.
**Some of the above is based on hard fact and some of the above is based on sensible supposition;
Thanks for your comments. All 3 of your assumptions are true. However, I’ve never seen these clamps on installation photos (even with expensive, brand ones) or live installed as a tight fit nor on a completely straight cable or far from other cables - on the contrary! So it occurred to me that it simply does not matter. As Robert noted it really shouldn’t. I could even imagine that the alternating change in the current I described would just average out on the longer run, not causing any measurable error. I’m keeping the clamps on the straight part of the test hooks now and they seem to be working very well. My energy generation measurements are within 0.5% of the ones reported by our SolarEdge SE5000 inverter’s measurements. (This interver has its quirks in over-reporting generation by 3-4% but there’s a workaround which tends to be a lot more accurate.)
You need to have owner-level access on your portal, so you’re are able to download CSV sheets for your daily instantaneous power data for the inverter. The sheet is by 5-minute intervals. I simply sum the values and divide by 12. The same is happening in EmonCMS but for the 10-sec intervals. Others on the solarpaneltalk.com forums reported this discrepancy. They claim the daily energy generation values are better on days with more sunlight…