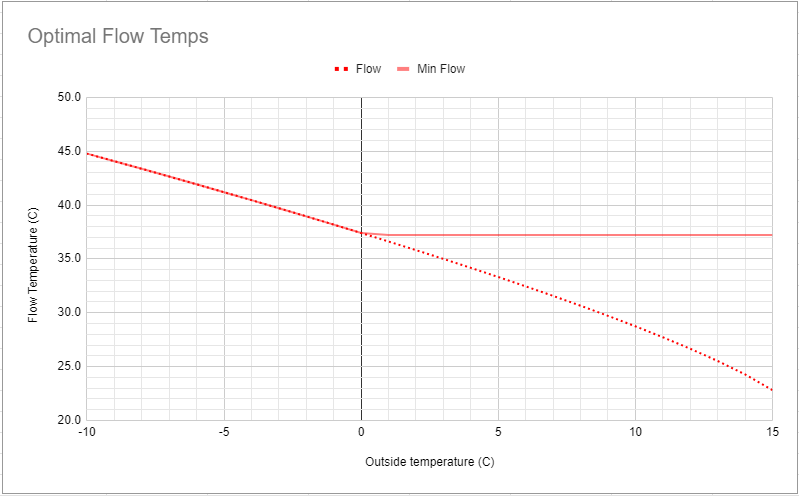
Heat loss = (outsideT - insideT) * coefficient - constant
Flow = (heat loss / radiator output) ^ (1/1.3) x 50 + insideT + dT / 2 Min flow is the same but with heat loss bounded by minimum heat pump output
The lowest temperature the heat pump can run at is 37 C, which matches the stable heating periods I’ve observed. If I’m willing to accept a duty cycle of 66% when it’s not freezing weather, then this drops to 33 C.
Here’s my spreadsheet if you’d like to do the same - make a copy and input your own numbers.
Adding more radiator output moves the line downwards. Reducing heat loss flattens the curve.
Hi Tim,
I did something similar in a slightly different way, armed with little more than Q=U.A.dT in a recent test on my most significant room (the lounge).
Happily, the external temp was constant for a whole day (12degC), so the ASHP exit sat at the WC temp (42degC) all day too, and the room reached a constant temp (i.e. steady state with heat lost = heat gained).
Based on the MCS-based U values (as used by my installer in his heat loss calcs) for extl/intl walls, ceiling, floor and windows, and their respective areas and dTs, I calculated my steady-state heat loss Q.
Then I used this Q in the same equation for my radiators (known A) to calculate the U for them. This was 48W/m2/degC, which compares with Vendor’s 61W/m2/degC (I can believe my figure as I have furniture items near the rads which limit convection).
Armed with these U values for rads and losses, it’s easy (spreadsheet) to look at different outside temps and different rad temps (which I assume to be very close to ASHP exit temp), so I will be able to tune the WC accordingly as we go into my first winter.
I was working on the same lines myself one rthe weekend, and I’ve just seen this excellent piece of thinking, and spreadsheet. However, how did you arrive at the Base Heat figure?
The simple method is to take the average daily electrical consumption that isn’t for the heat pump, and divide by 24, and add a 100 W for each human (70W for children). This comes out at 950W for me, which turns out to be a bit too high, perhaps due to some humans going outside sometimes. I’ve also not considered ~50W of heat “lost” from the cylinder than contributes to warming the house.
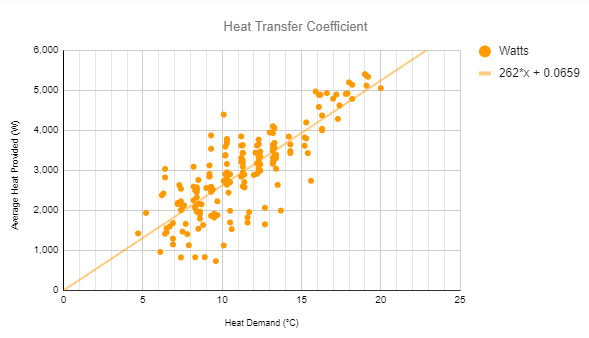
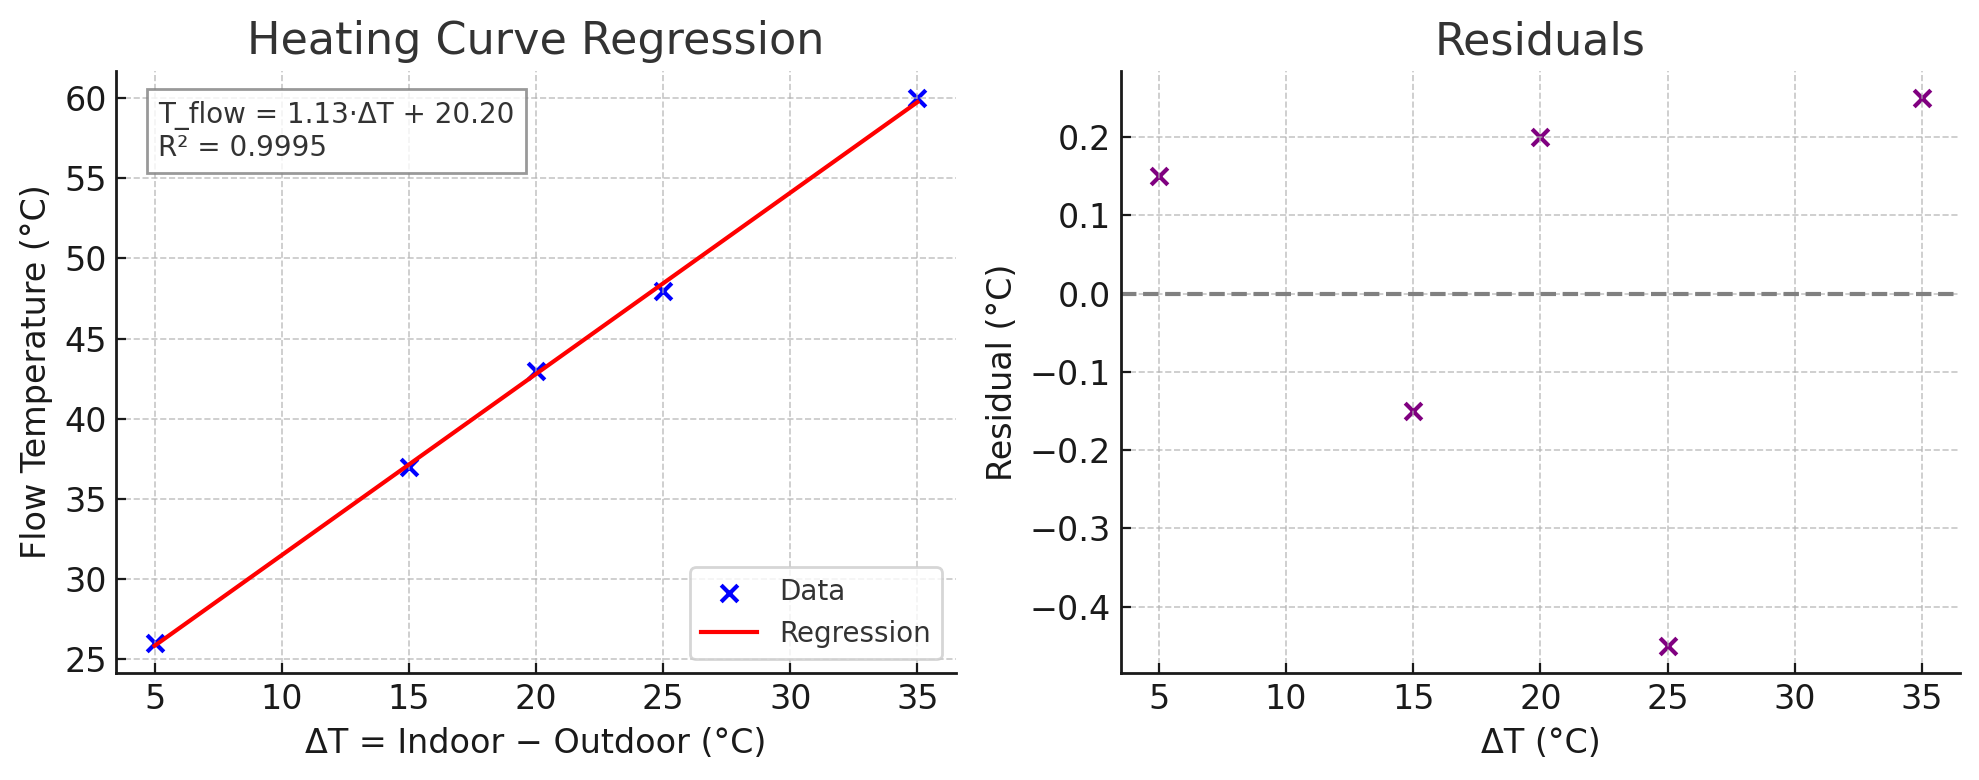
The more accurate method is to follow the “heat lost coefficient calculation” linked from the first post. Whatever offset is required to make the trend line fit through 0,0 is therefore the base heat from appliances and occupants. The additional (measured) heat from the heat pump then makes up the rest to match the heat lost from the property.
For me there’s quite an impact from solar gains as well. I only have limited data for now but in early January I need around 3 kWh/degree day in heat whereas now it’s starting to dip below 2.5.
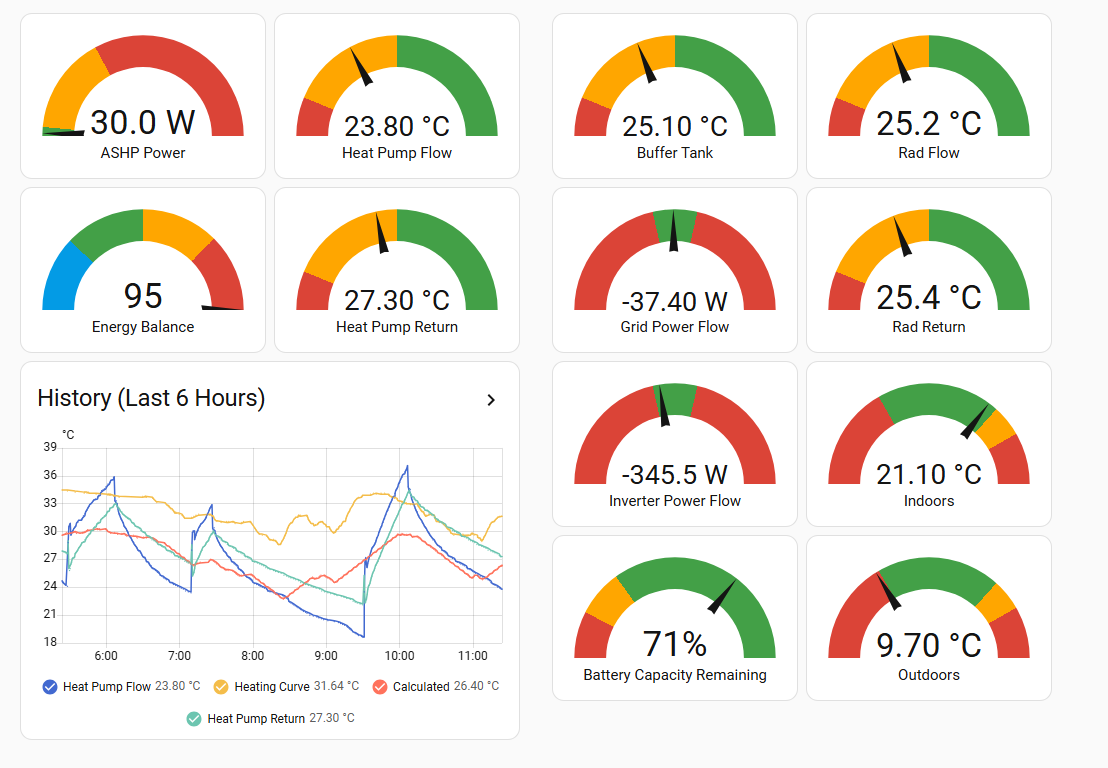
I have a AIRA Heat Pump system which has virtually no user controls or information on flow, return temperatures or water flow rates (or anything else, not even the temperature of the water in your hot water cylinder).
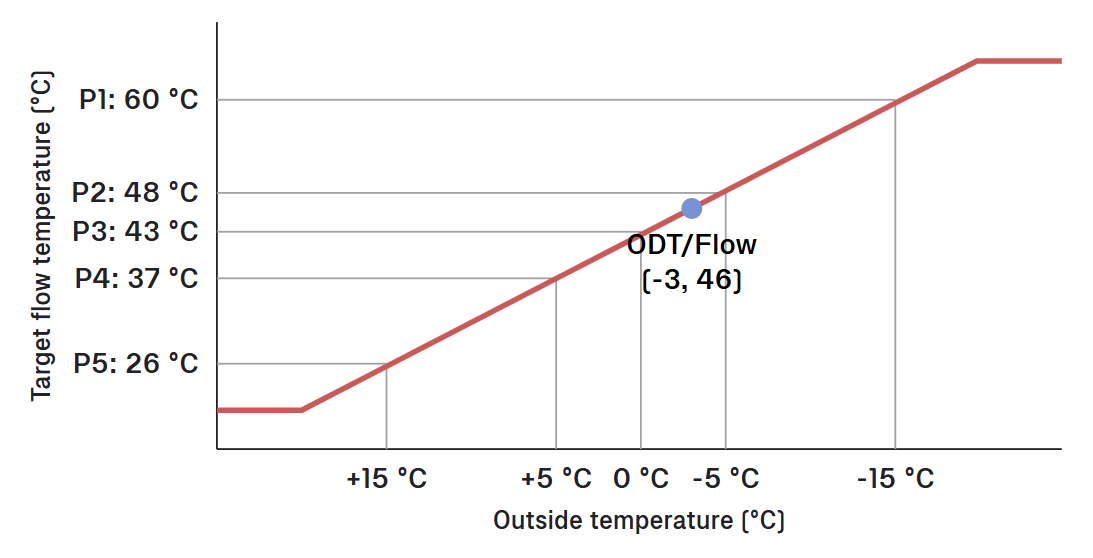
They claim it follows a curve which they can email to you
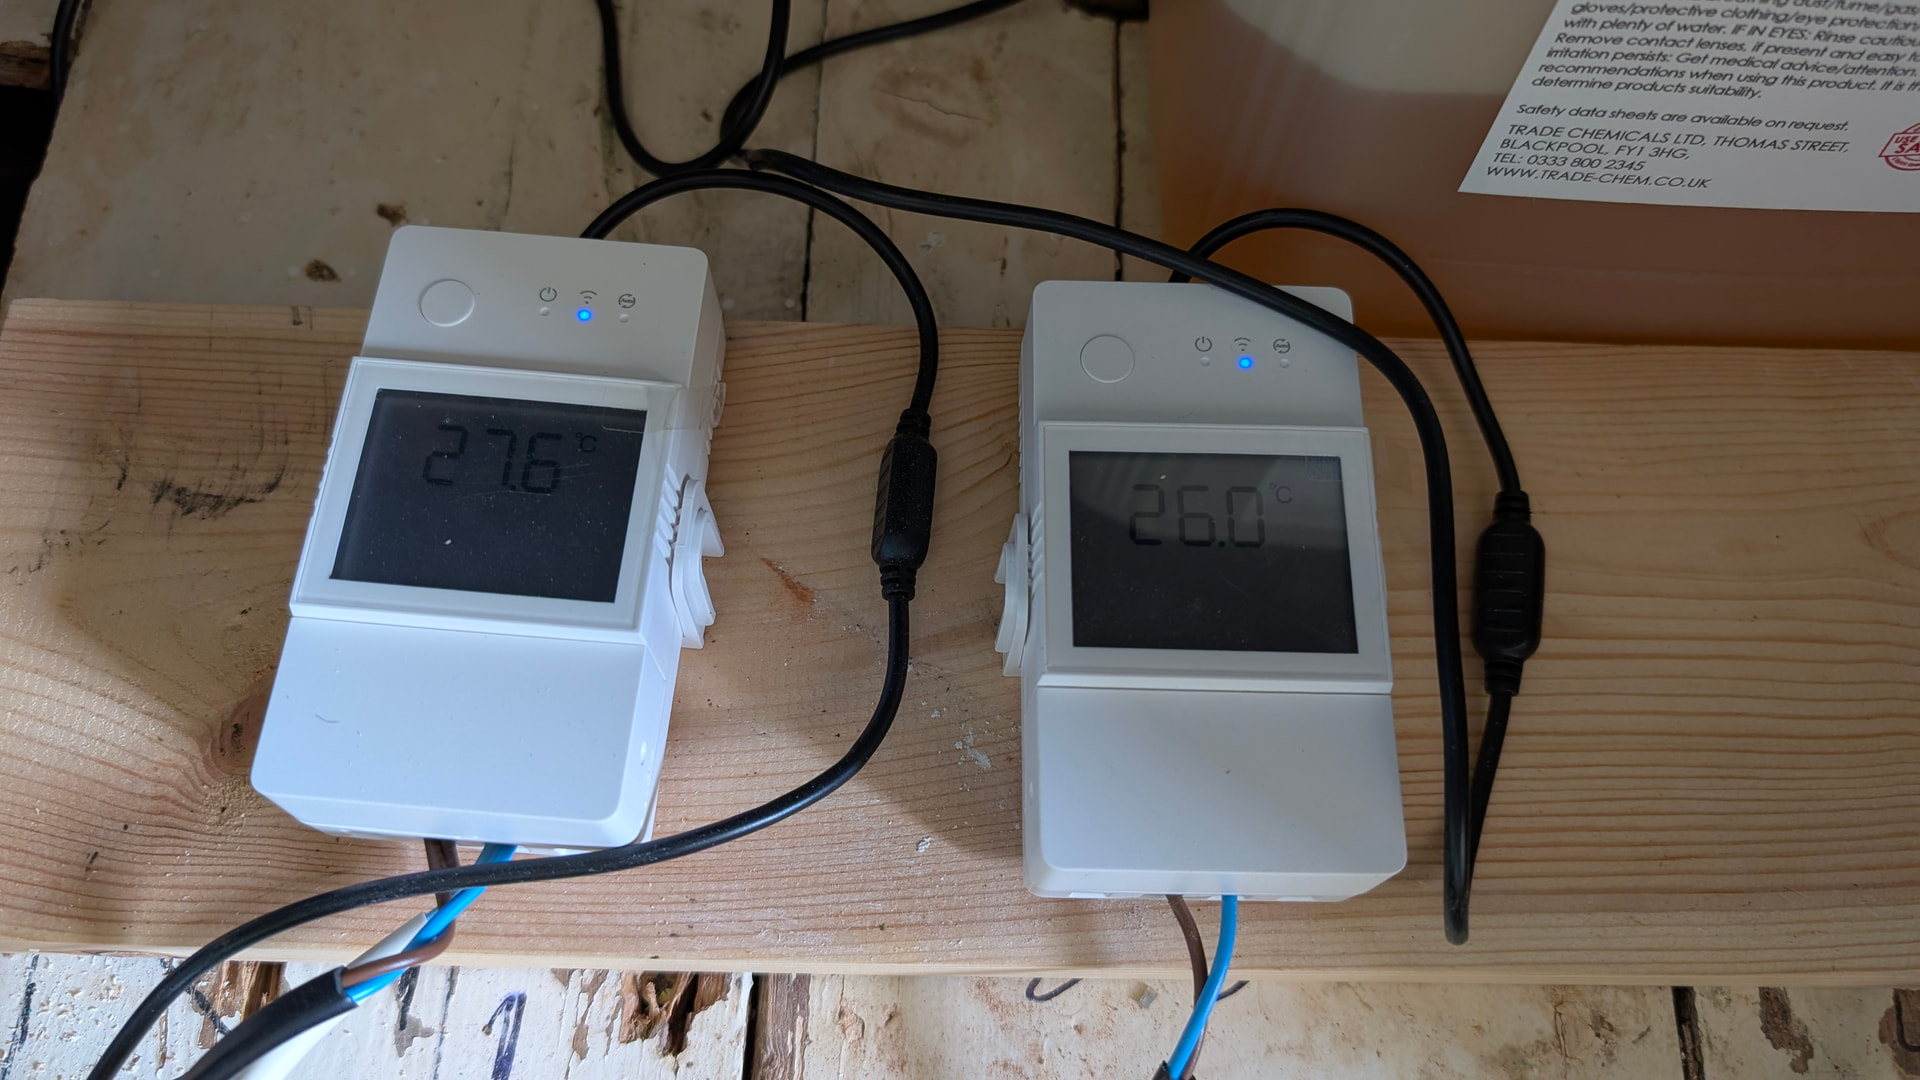
I have fitted my own flow and return rate sensors but what I am after is a more detailed graph giving you the information per degree c so for any outdoor temperature it will give you heat pump flow temperature. The idea being I can see if the graph is being followed.
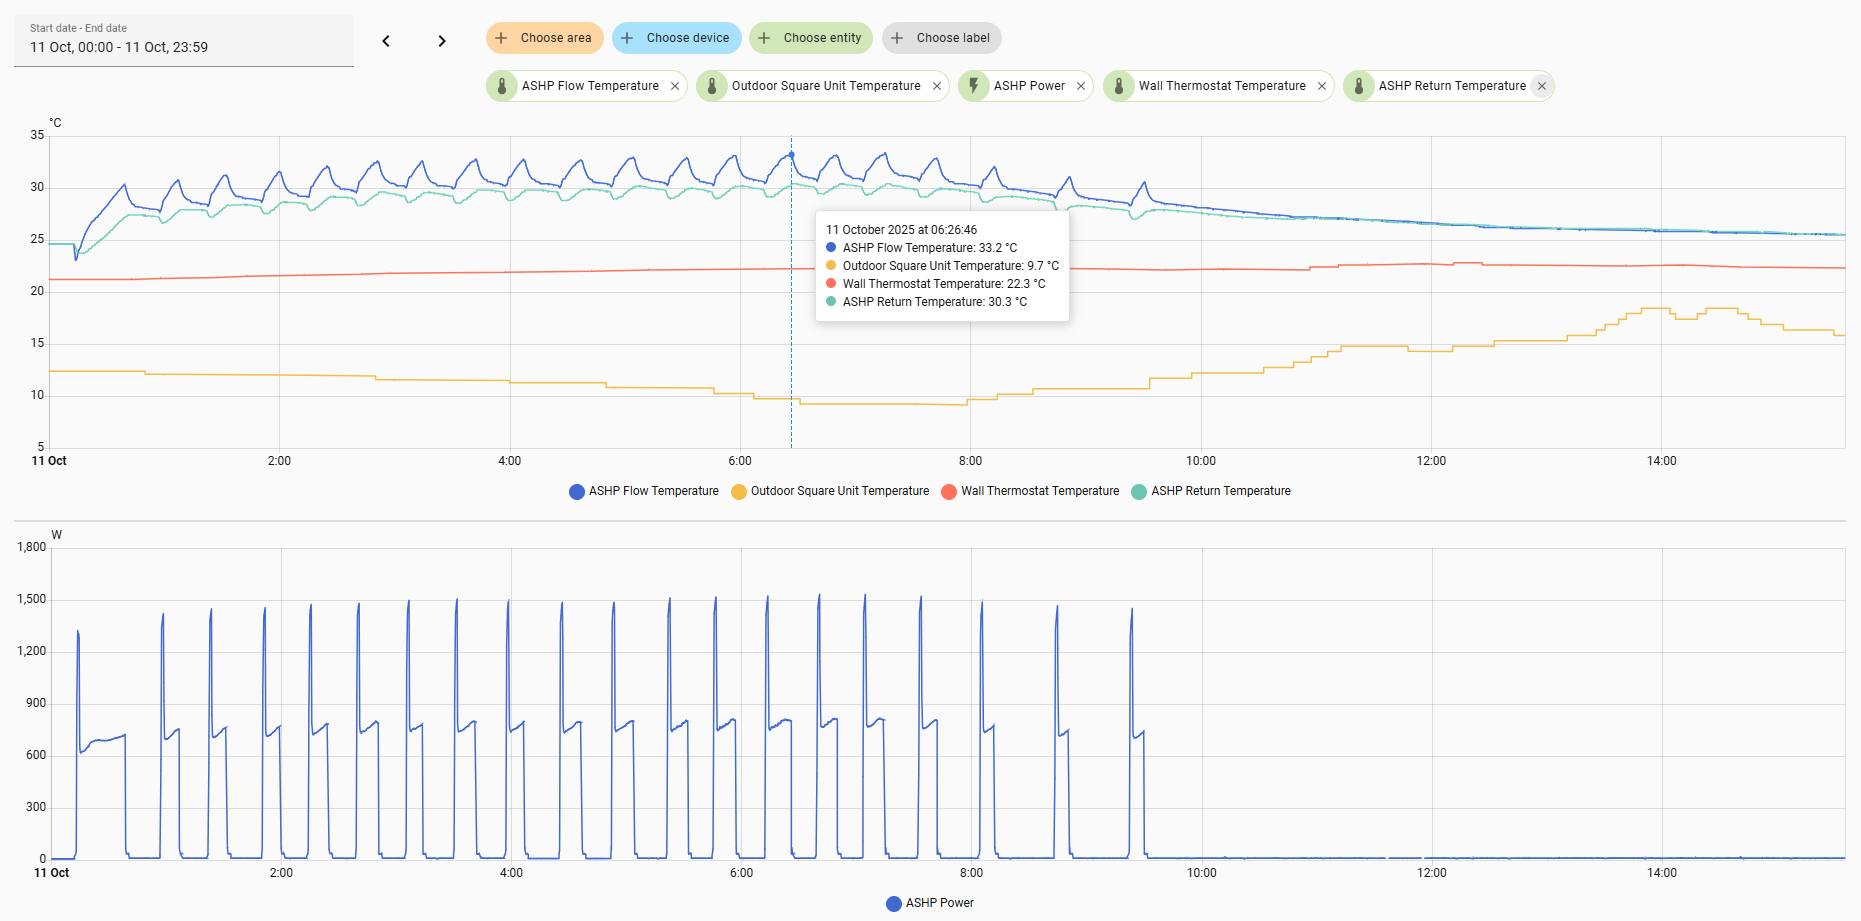
Your approach makes sense, but as your heatpump is cycling a bit you won’t directly see this since the actual flow temperature will oscillate around the target. Try averaging over mutiple cycles and see whether it fits.
However I don’t believe this curve as it makes no sense. It’s fully linear, and all heatcurves I’ve seen are sub-linear as convection heating by radiators and UFH increases more strongly than with deltaT.
Mike, disappointed to hear this as we are having an 8kW Aira Heat Pump installation and seeing your comment Aira confirmed unavailability of parameters but they have a device manager to monitor the system. Big “no no” when I suggested customer read only access! So what sensors would you advise I install, perhaps easiest during system installation. I note the Shelly needed would be for a heavy load.
Don’t tell AIRA but some clever folks have created a Home Assistant app which allows you to at least monitor it more but no more control than the AIRA app offers.
If you are not already running Home Assistant (best on a Pi and must have Bluetooth and be within range of your AIRA indoor unit) I would get that up and running.
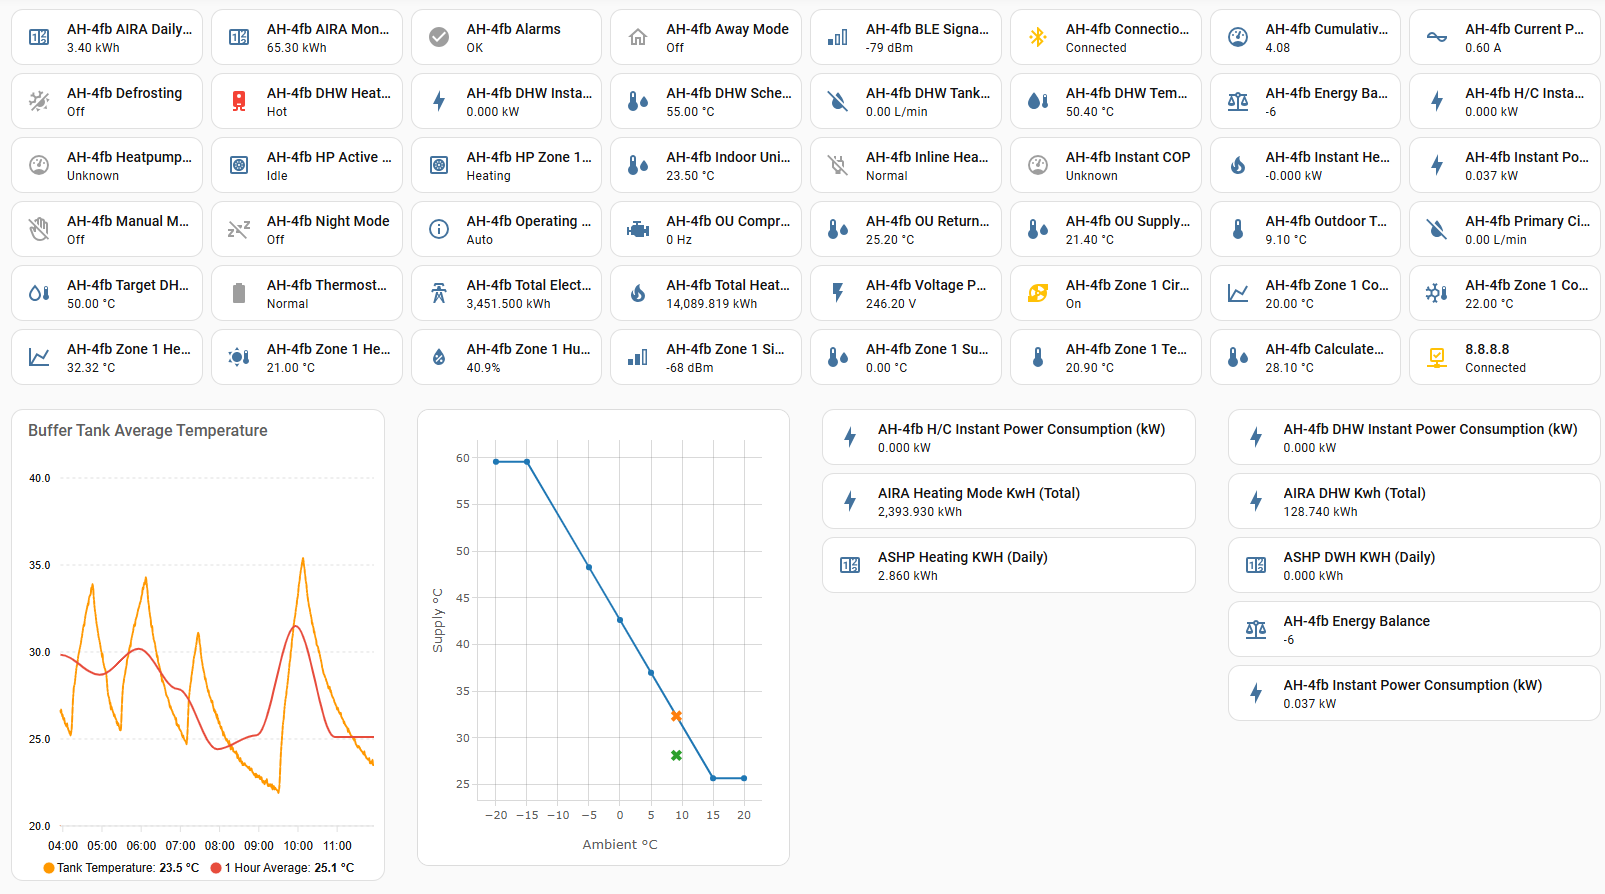
The following screen lists most of the data you can get from the system (there are a few more).
Thanks again Mike. But where do I start as cannot find an Aira integration within HACS, as loads of strings in the Forum, is there a basic guide for newbies?