I did my morning reading, and read with interest the highly technical discussion of saturation at the upper limit of useful range of the SCT006. By the time you finish the post, you’re ready to take a hammer to them. Not so fast…
There’s a history to this, and some of you may have been following, but the vast majority get their news from headlines and post titles, and that may be misleading.
The backstory is that the question of whether this CT might be exhibiting distortion in a 5.4A circuit was answered by me with my data from testing it at 60Hz. Subsequently, readers were warned that those tests are not valid at 50Hz. Specifically, the writer asserted that there was a direct linear relationship of 50Hz/60Hz that decreased the useful range to 16.666A (from an initial questionable 20A). I questioned that relationship then and I still do. What happens if you use it at 400Hz - is the capacity 133A?
I have been admonished for questioning the authority of the gurus that inhabit this forum, and I will surely suffer their wrath for this post as well.
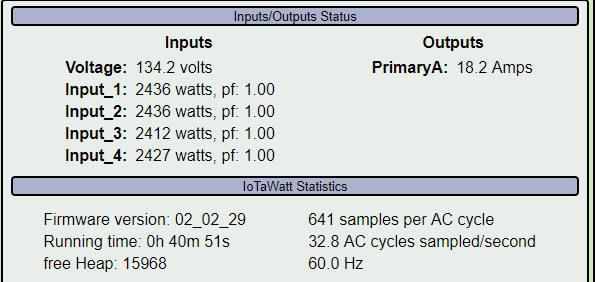
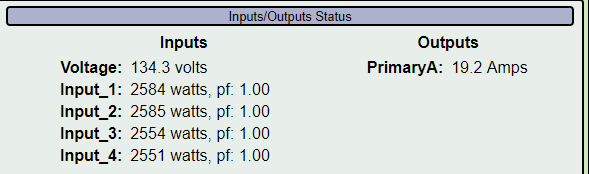
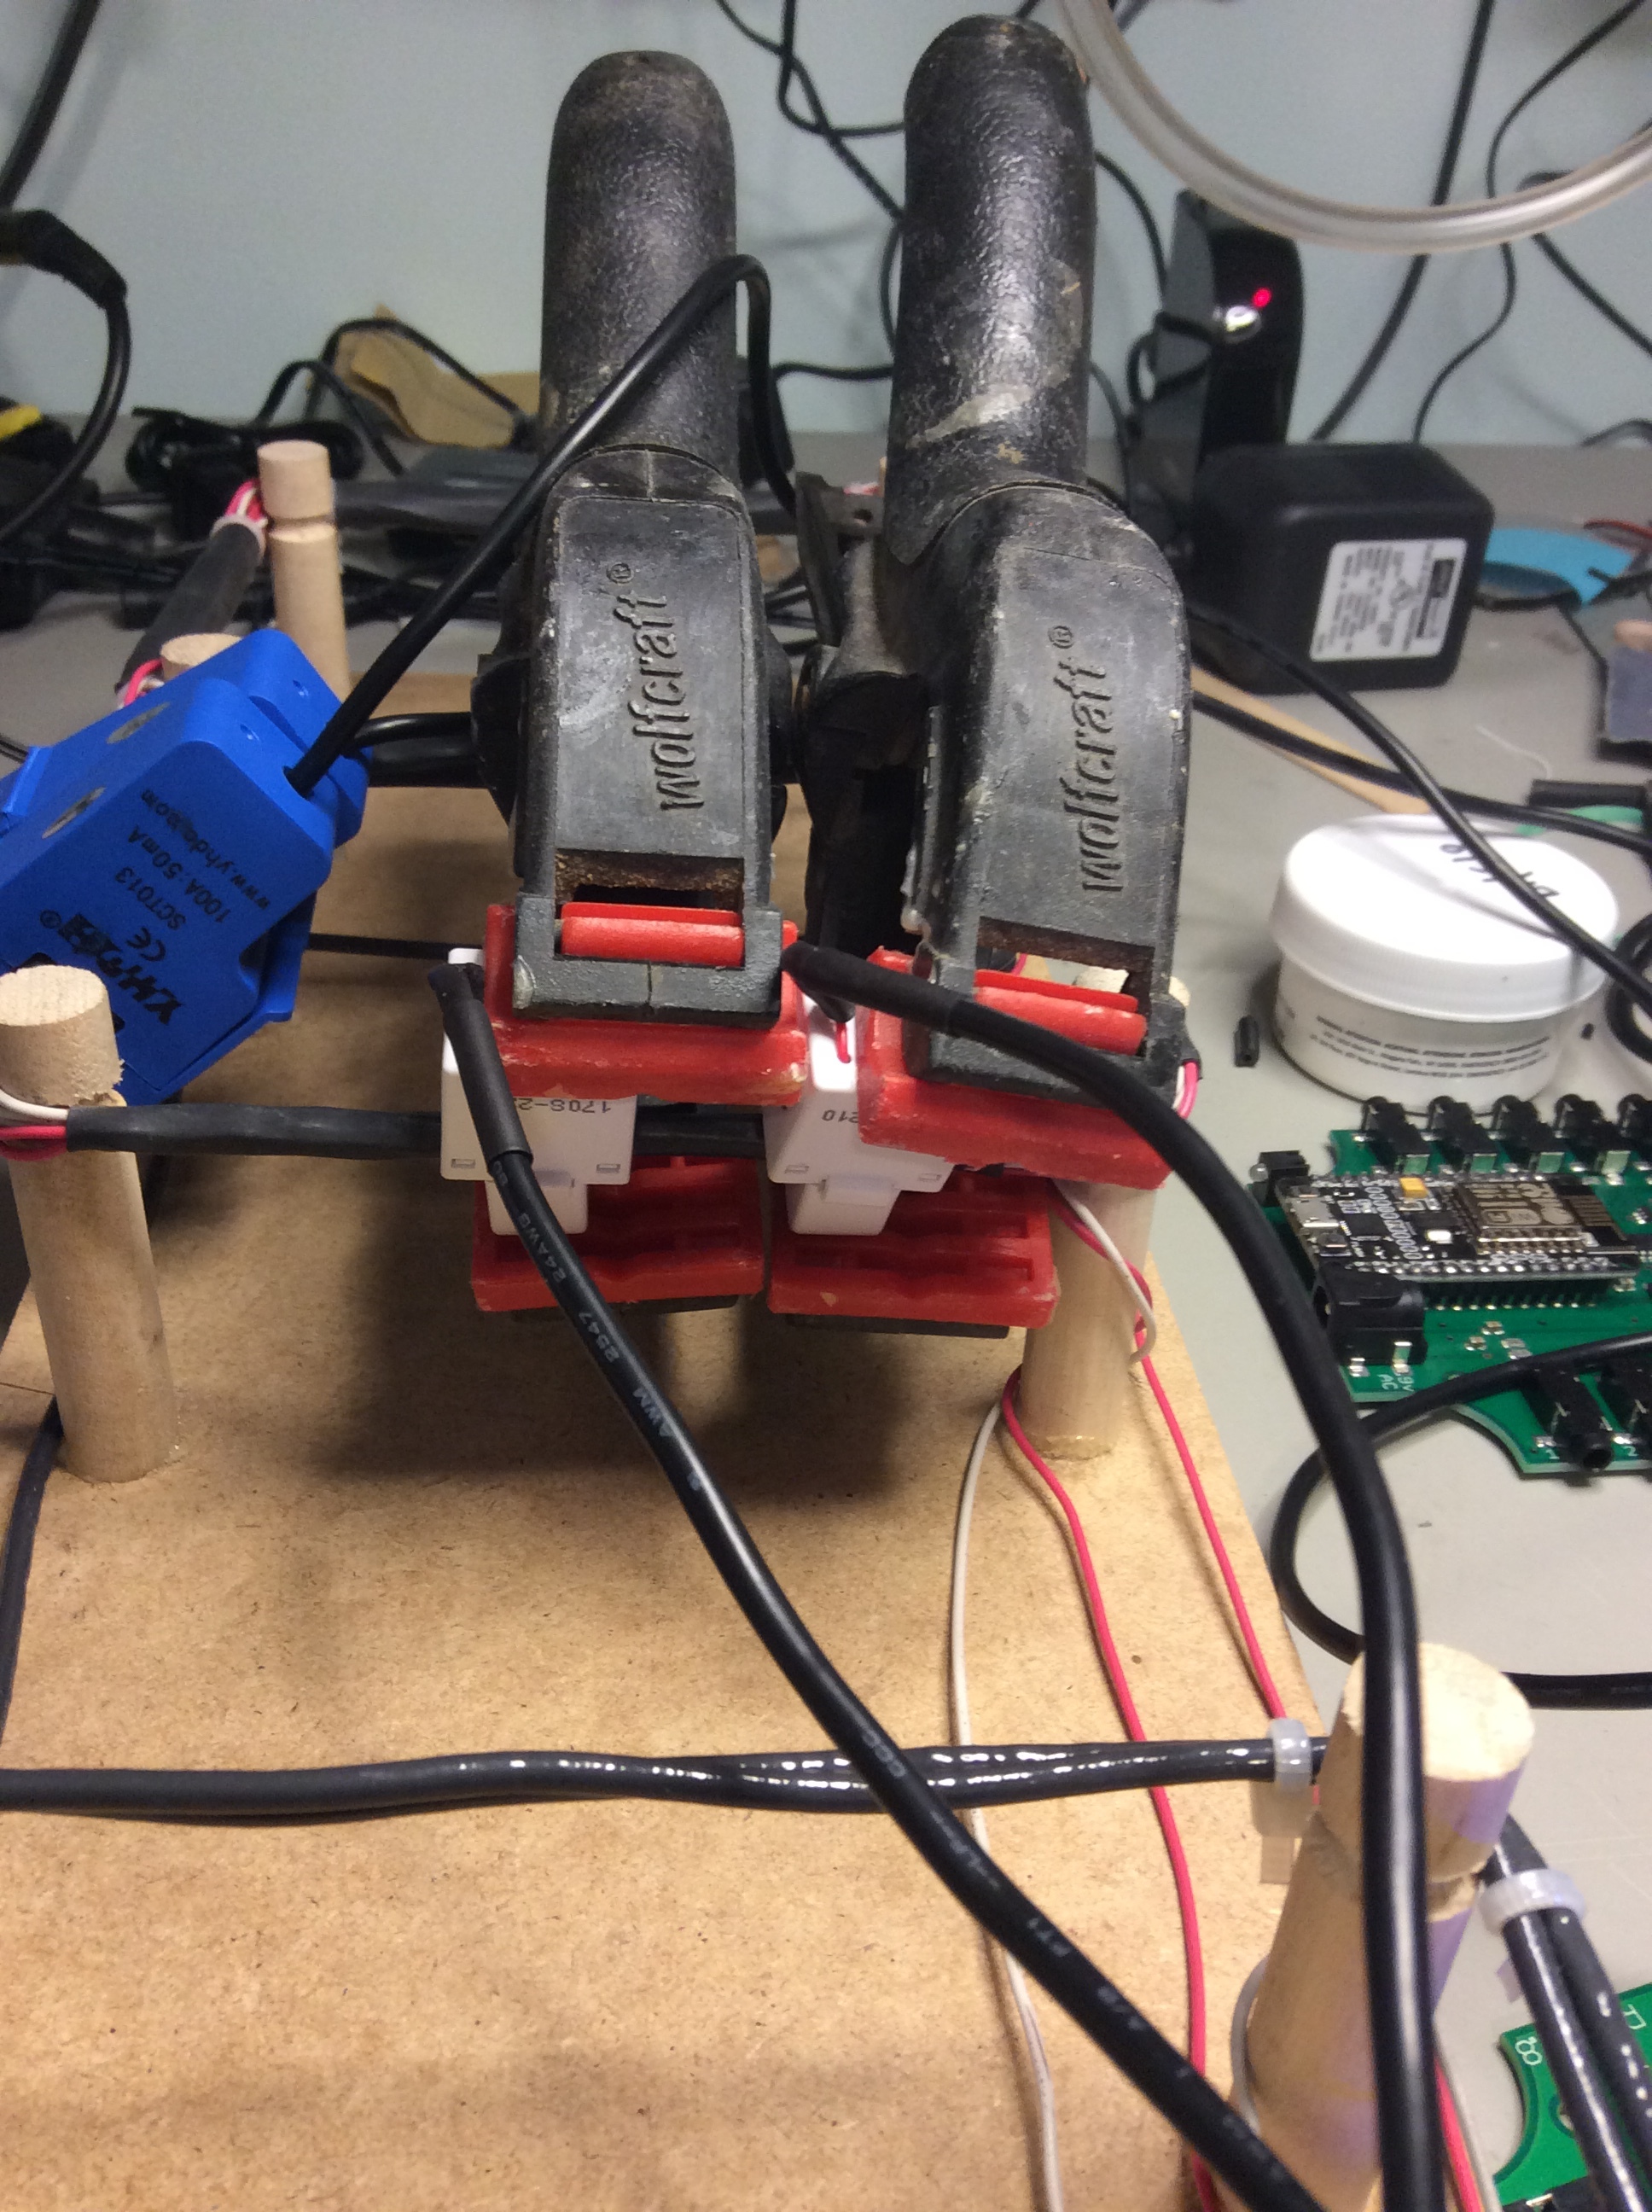
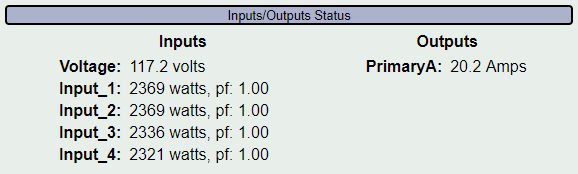
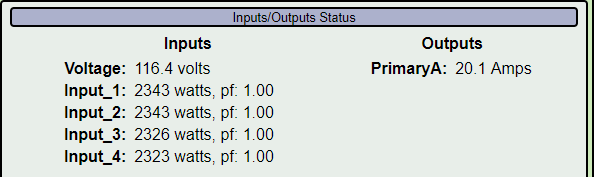
But being a bottom line guy, I connected a venerable SCT013-000 and an SCT006 to my IoTaWatt and got out a collection of light bulbs. Using a jig with 1,2,6, and 8 turns, I obtained these results:
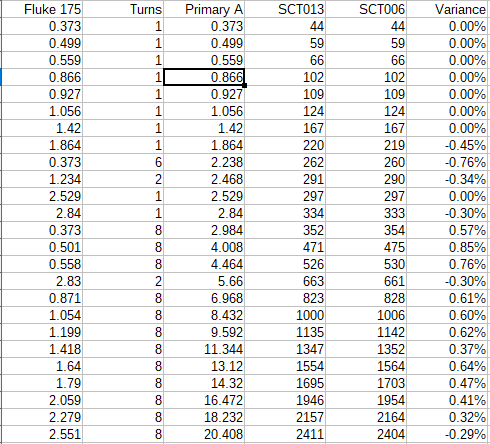
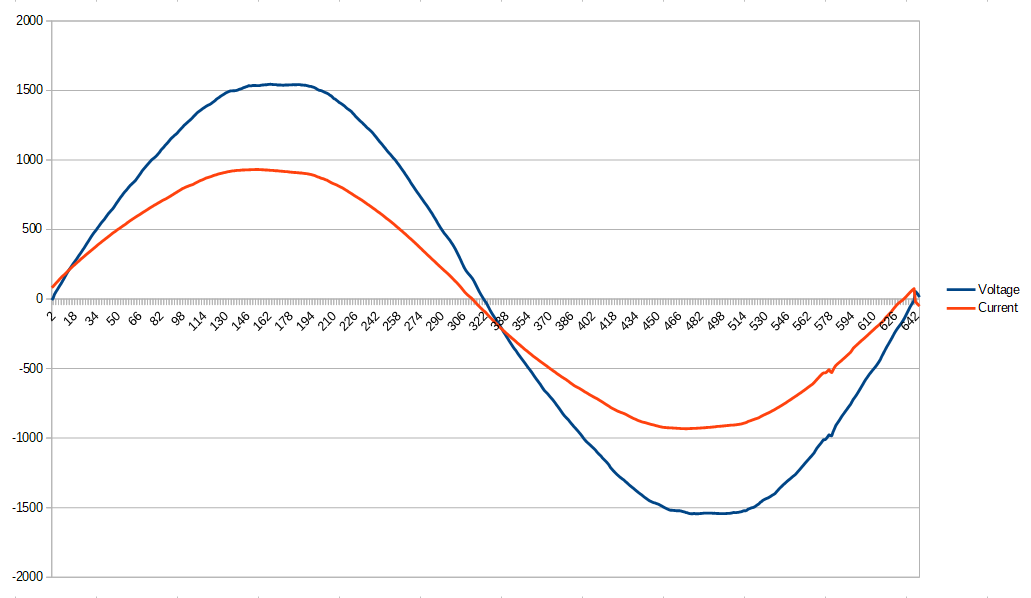
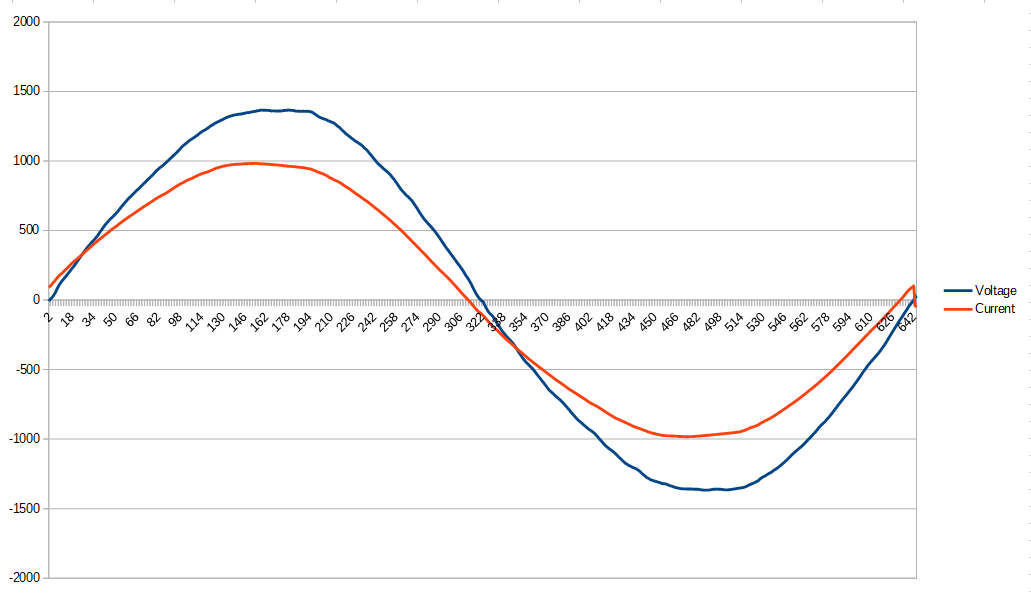
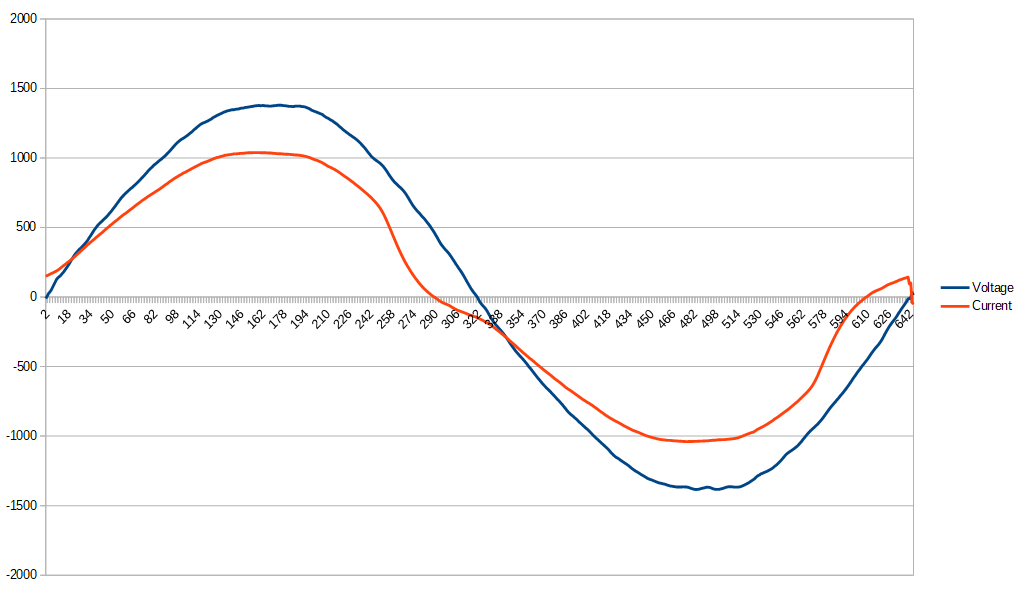
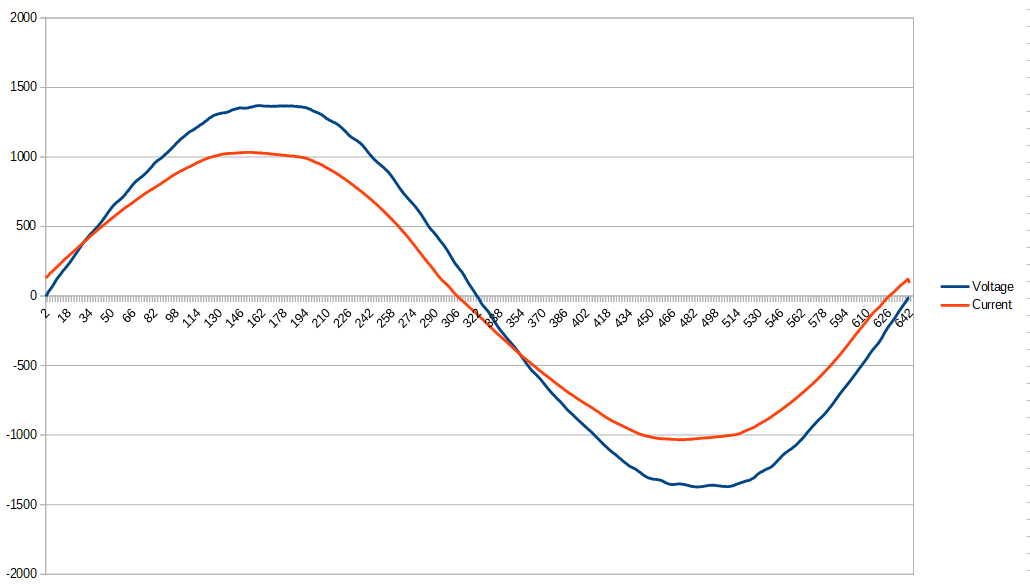
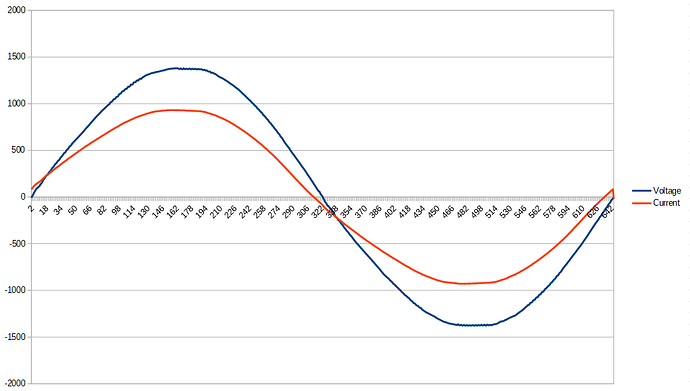
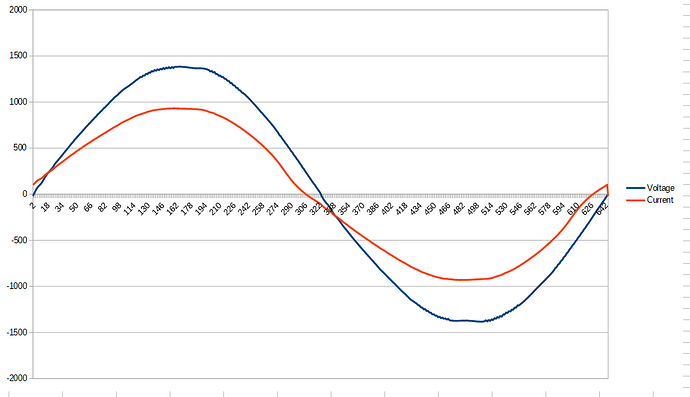
Graphically:
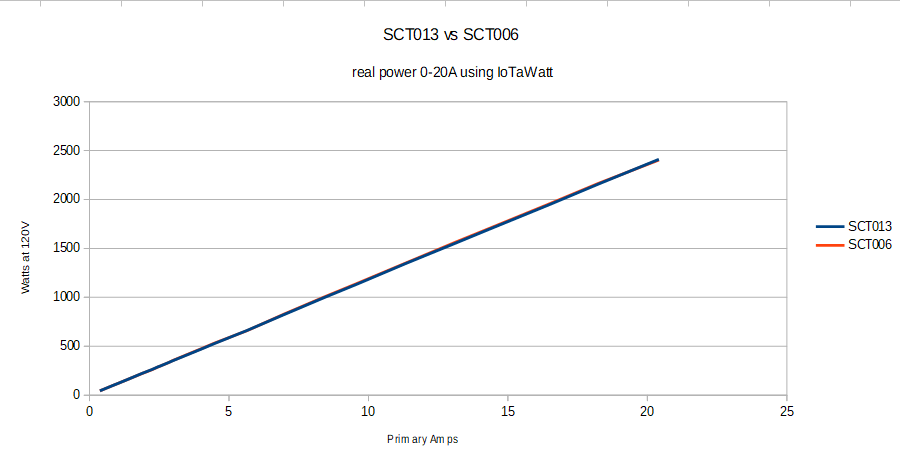
Sure, you can analyze these devices and find flaws. The question is what does it mean to someone trying to find out where their electricity is being consumed? These results work for me. There’s a guy who is going to make a fresh argument about extreme power factors and funky current signals. I stipulate that if you use the SCT006 in that environment - at > 17-18 amps, your results may vary.
BTW/ The argument that capacity is linearly proportional to frequency has not been supported, nor has any difference between 50Hz and 60Hz capacity been demonstrated. I don’t know the answer, I’m waiting for equipment to find out, but that’s the point. I’m waiting for equipment before I state facts that aren’t…
Yes, I did kinda take this personally.