If you are maintaining the same temperature in your house, you will always need the same heat energy for that - even the most advanced control system cannot work its way around the physics. If you need less heat than similar sized properties this means you have better insulation and/or air tightness and/or more favourable external climate conditions.
I would go so far to say that any gains in efficiency due to a control system like your thermostat should only be compared within the same house and not between different houses as the uncertainties will completely drown out the “signal”.
You could compare against properties with the same ‘Heat loss at design temperature’ or same annual ‘Assessed space heat demand’, though these are both estimated rather than measured.
Indeed, a well installed heat pump with correct controls will control its heat output very precisely using a combination of weather + load compensation. It’s the poor system design, oversizing and incorrect controls that cause some to under perform.
I still don’t follow what this calculation is. 0.15838£/kWh seems way too expensive. Can you explain it?
Here’s a paper a found [link below], which looks at thermostats with different precision levels.
According to the study:
Precision Impact on Savings:
A thermostat with 0.1°C precision achieves energy savings nearly identical to theoretical adaptive setpoints, enabling optimal use of heating and cooling strategies.
Thermostats with 1°C precision (common in older HVAC systems) result in significantly reduced energy savings. In some cases, energy consumption can even increase compared to static operational patterns due to the inability to finely tune the setpoints.
Energy Consumption Variations:
In heating, the energy consumption increases by 22.44% on average when using a thermostat with 1°C precision compared to 0.1°C precision in the current climate scenario
Quote from the paper
In the current scenario, an average increase in annual
heating energy consumption of 1.02, 10.47 and 22.44% was obtained
with AP-2, AP-3, and AP-4, respectively, and in the annual cooling
energy consumption, the increase percentages were greater: 5.09%
with AP-2, 41.40% with AP-3, and 76.44% with AP-4.
In simpler terms, here’s what this means:
Heating energy use:
If the thermostat is very precise (AP-2, accurate to 0.1°C), the extra energy used for heating is very small—just 1.02% more compared to an ideal thermostat.
If the thermostat is less precise (AP-3, accurate to 0.5°C), heating energy use increases by 10.47%.
With the least precise thermostat (AP-4, accurate to 1°C), heating energy use jumps by 22.44%.
So again, if your heating source (whether it’s boiler or heat pump), cannot work down to 0.1 precision, then your property might be missing on about 20% energy savings
Let’s not look at the paper and instead start with the basic physics and a quick worst-case estimate. Let’s say we have to heat for 220 days a year and during that heating period accumulate 2500 degree days (should be somewhat representative of London) with an internal setpoint of 20°C. My crappy thermostat however delivers 21°C all the time (very precise, but not accurate). This means that every day I accumulate one extra degree day, ending up with 2720. Thanks to linearity of the underling physics, this translates to an 8.8% increase heating energy use; with heat pumps the electrical energy use increase will be slightly higher because of the reduced COP at higher flow temperatures.
One thing to note here: The added degree days scale with the number of days where I use my heating per year and have to be put in relation to the total accumulated degree days. For colder climates, like in Germany, we get closer to 3800 degree days per year and assuming the same number of days for heating the increased energy use already drops to 5.8%. The article you cite is for Spain, which is much warmer and 1°C inaccuracy will have a higher impact. But they are also probably heating for less days during the year.
In reality things will be much different. If I feel too warm after setting to 20°C and getting 21°C, I will reduce the setpoint and the problem is solved. Real thermostats will however not simply systematically over- or underestimate but rather oscillate around the setpoint with varying amplitude - let’s use 1°C again. So the temperature will overshoot, but also undershoot. The nice thing about the linearity is that we just have to care about the average temperature. When it’s 21°C, we use slightly more energy, when it’s 19°C we use slighly less. Over a year (or even shorter timeframes like a day), it takes the same energy to keep the house at exactly 20°C compared to having it oscillate by ±1°C, provided the average temperature is 20°C.
Finally, let’s quickly look at the paper. They are analyzing an adaptive setpoint technique where (for the heating part) they reduce indoor temperature when it’s colder and increase it when it’s warmer. This of course leads to savings. If the adaptive model calls for 22.268 °C but my thermostat can only be set to 23°C, then of course I will use more energy. This is a discretization error, and if their adaptive energy savings model is built based on continuous temperature adjustability then it is not surprising that quantization/discretization errors can lead to large deviations from the desired result - this is a well-known issue in a number of fields. So what they are saying is that for their adaptive setpoint model, a thermostat adjustability of only ±1°C leads to increased energy use - probably also because they seem to always round towards the next highest integer and never down. This has exactly nothing to do with what most people here are doing: Keeping their house constantly at a temperature they find comfortable and affordable.
Thank you André! I respect your important points raised and I also politely disagree In general, I encourage that we promote for our heating controls to become more open source and more configurable, not less
Which points do you disagree with? You can disagree all you want with the physics, but it’s not going to change reality.
At no point did I advocate for less or closed source controls. I just stated that the benefits of these high accuracy controls in terms of energy savings was severely overstated by you.
With open source, we could swiftly test the algorithm on heat pumps and then celebrate our enhanced efficiency at a cozy pub with excellent German beer and Wurst
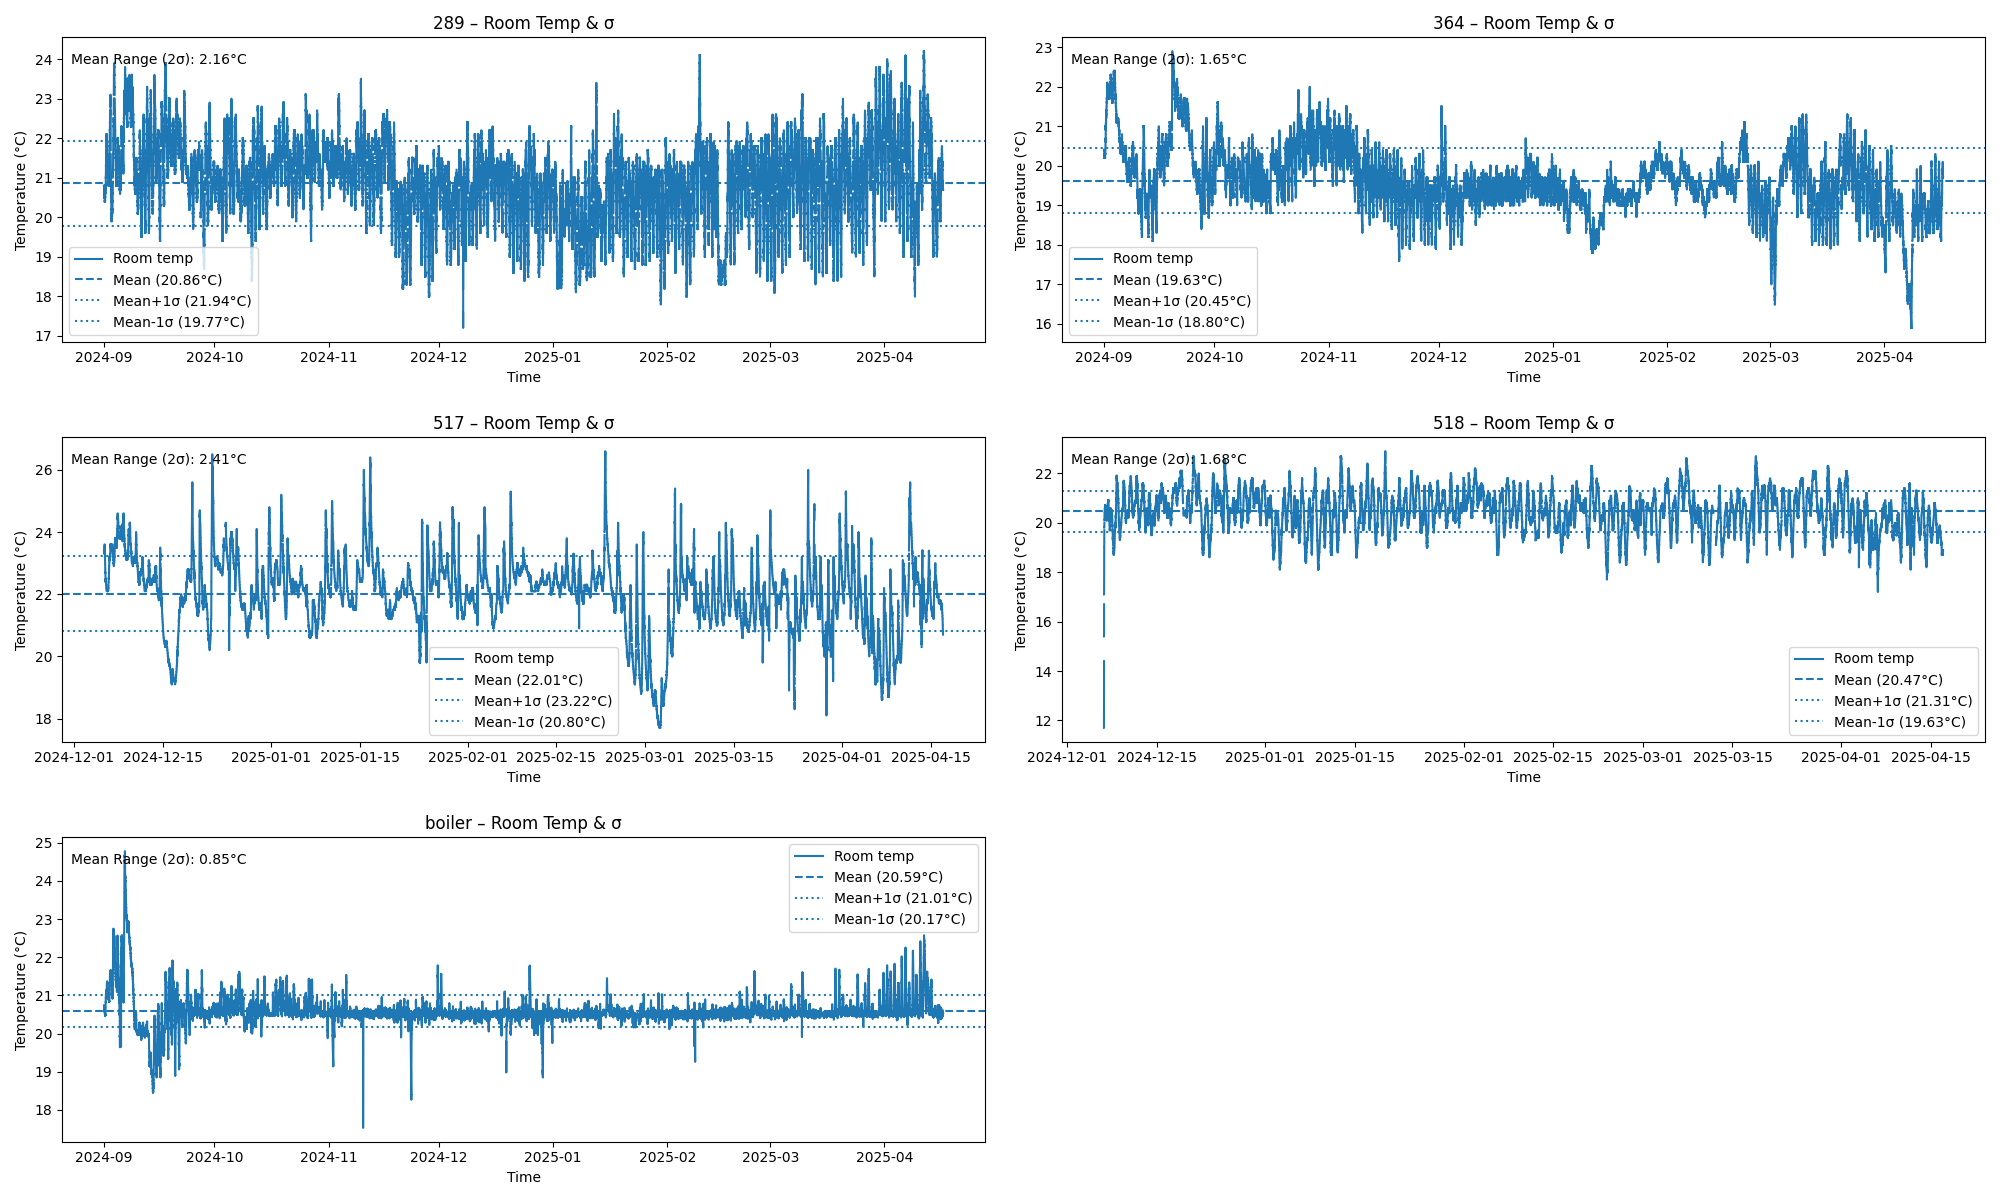
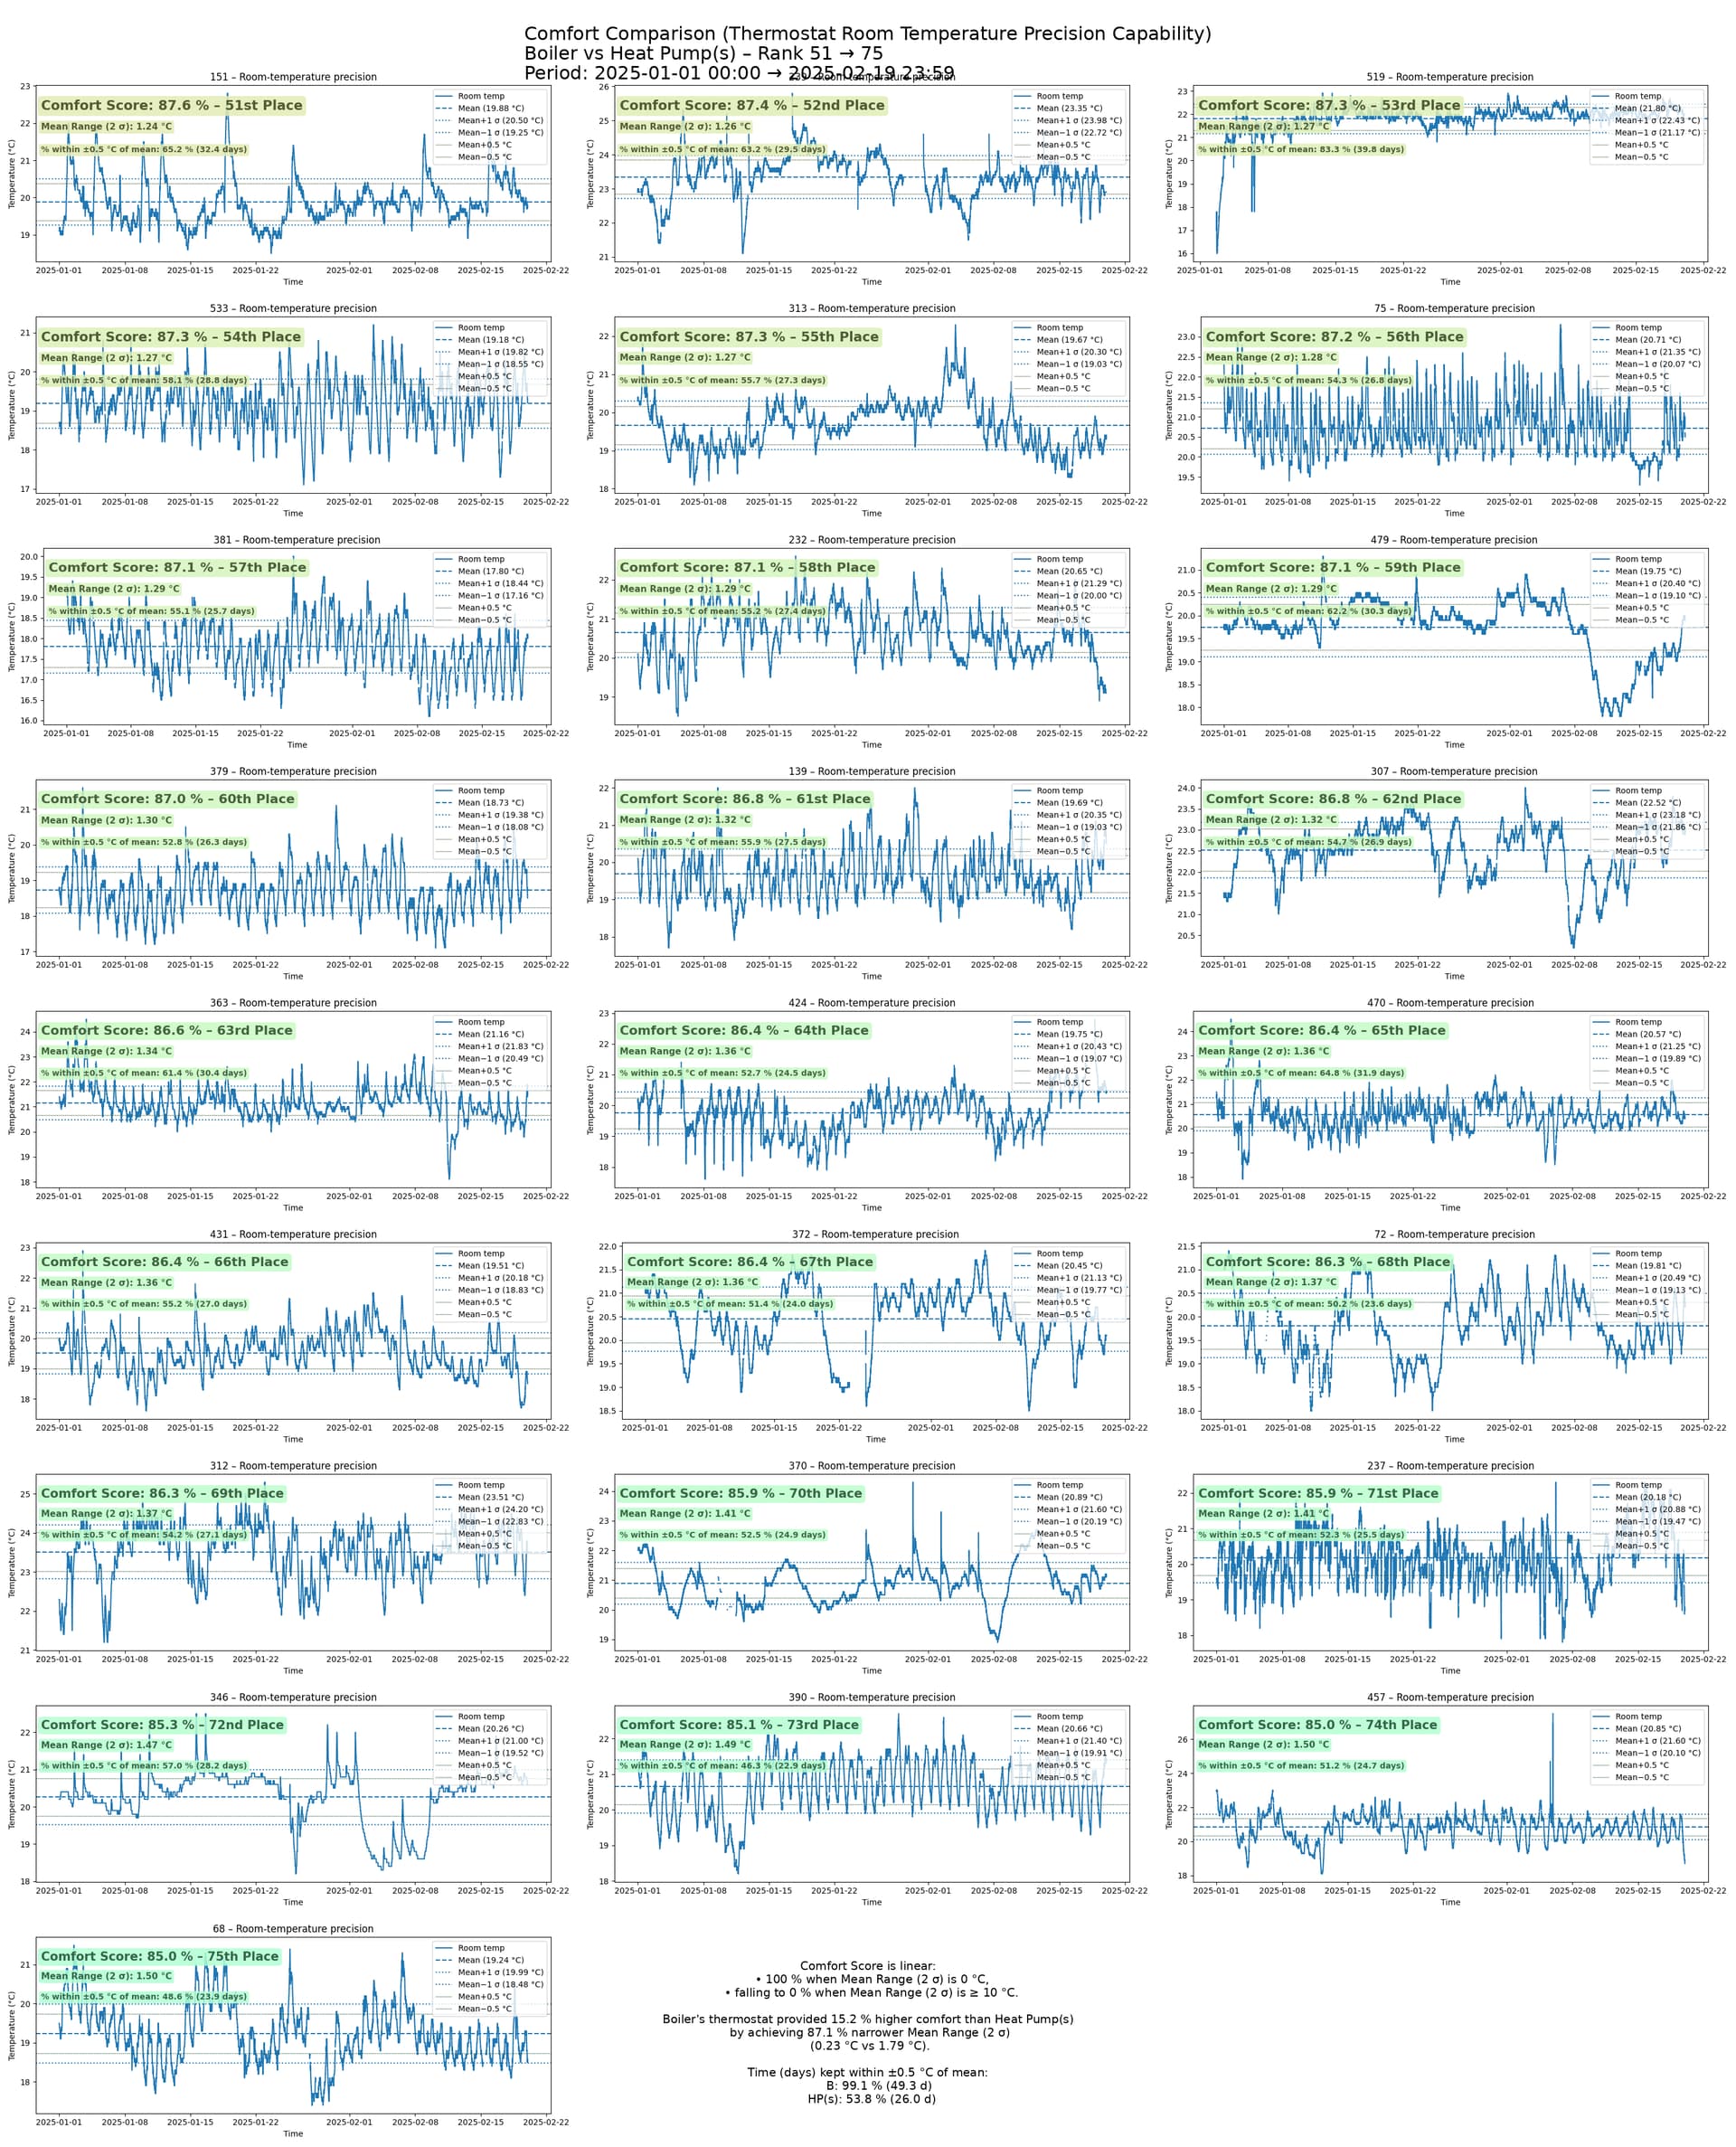
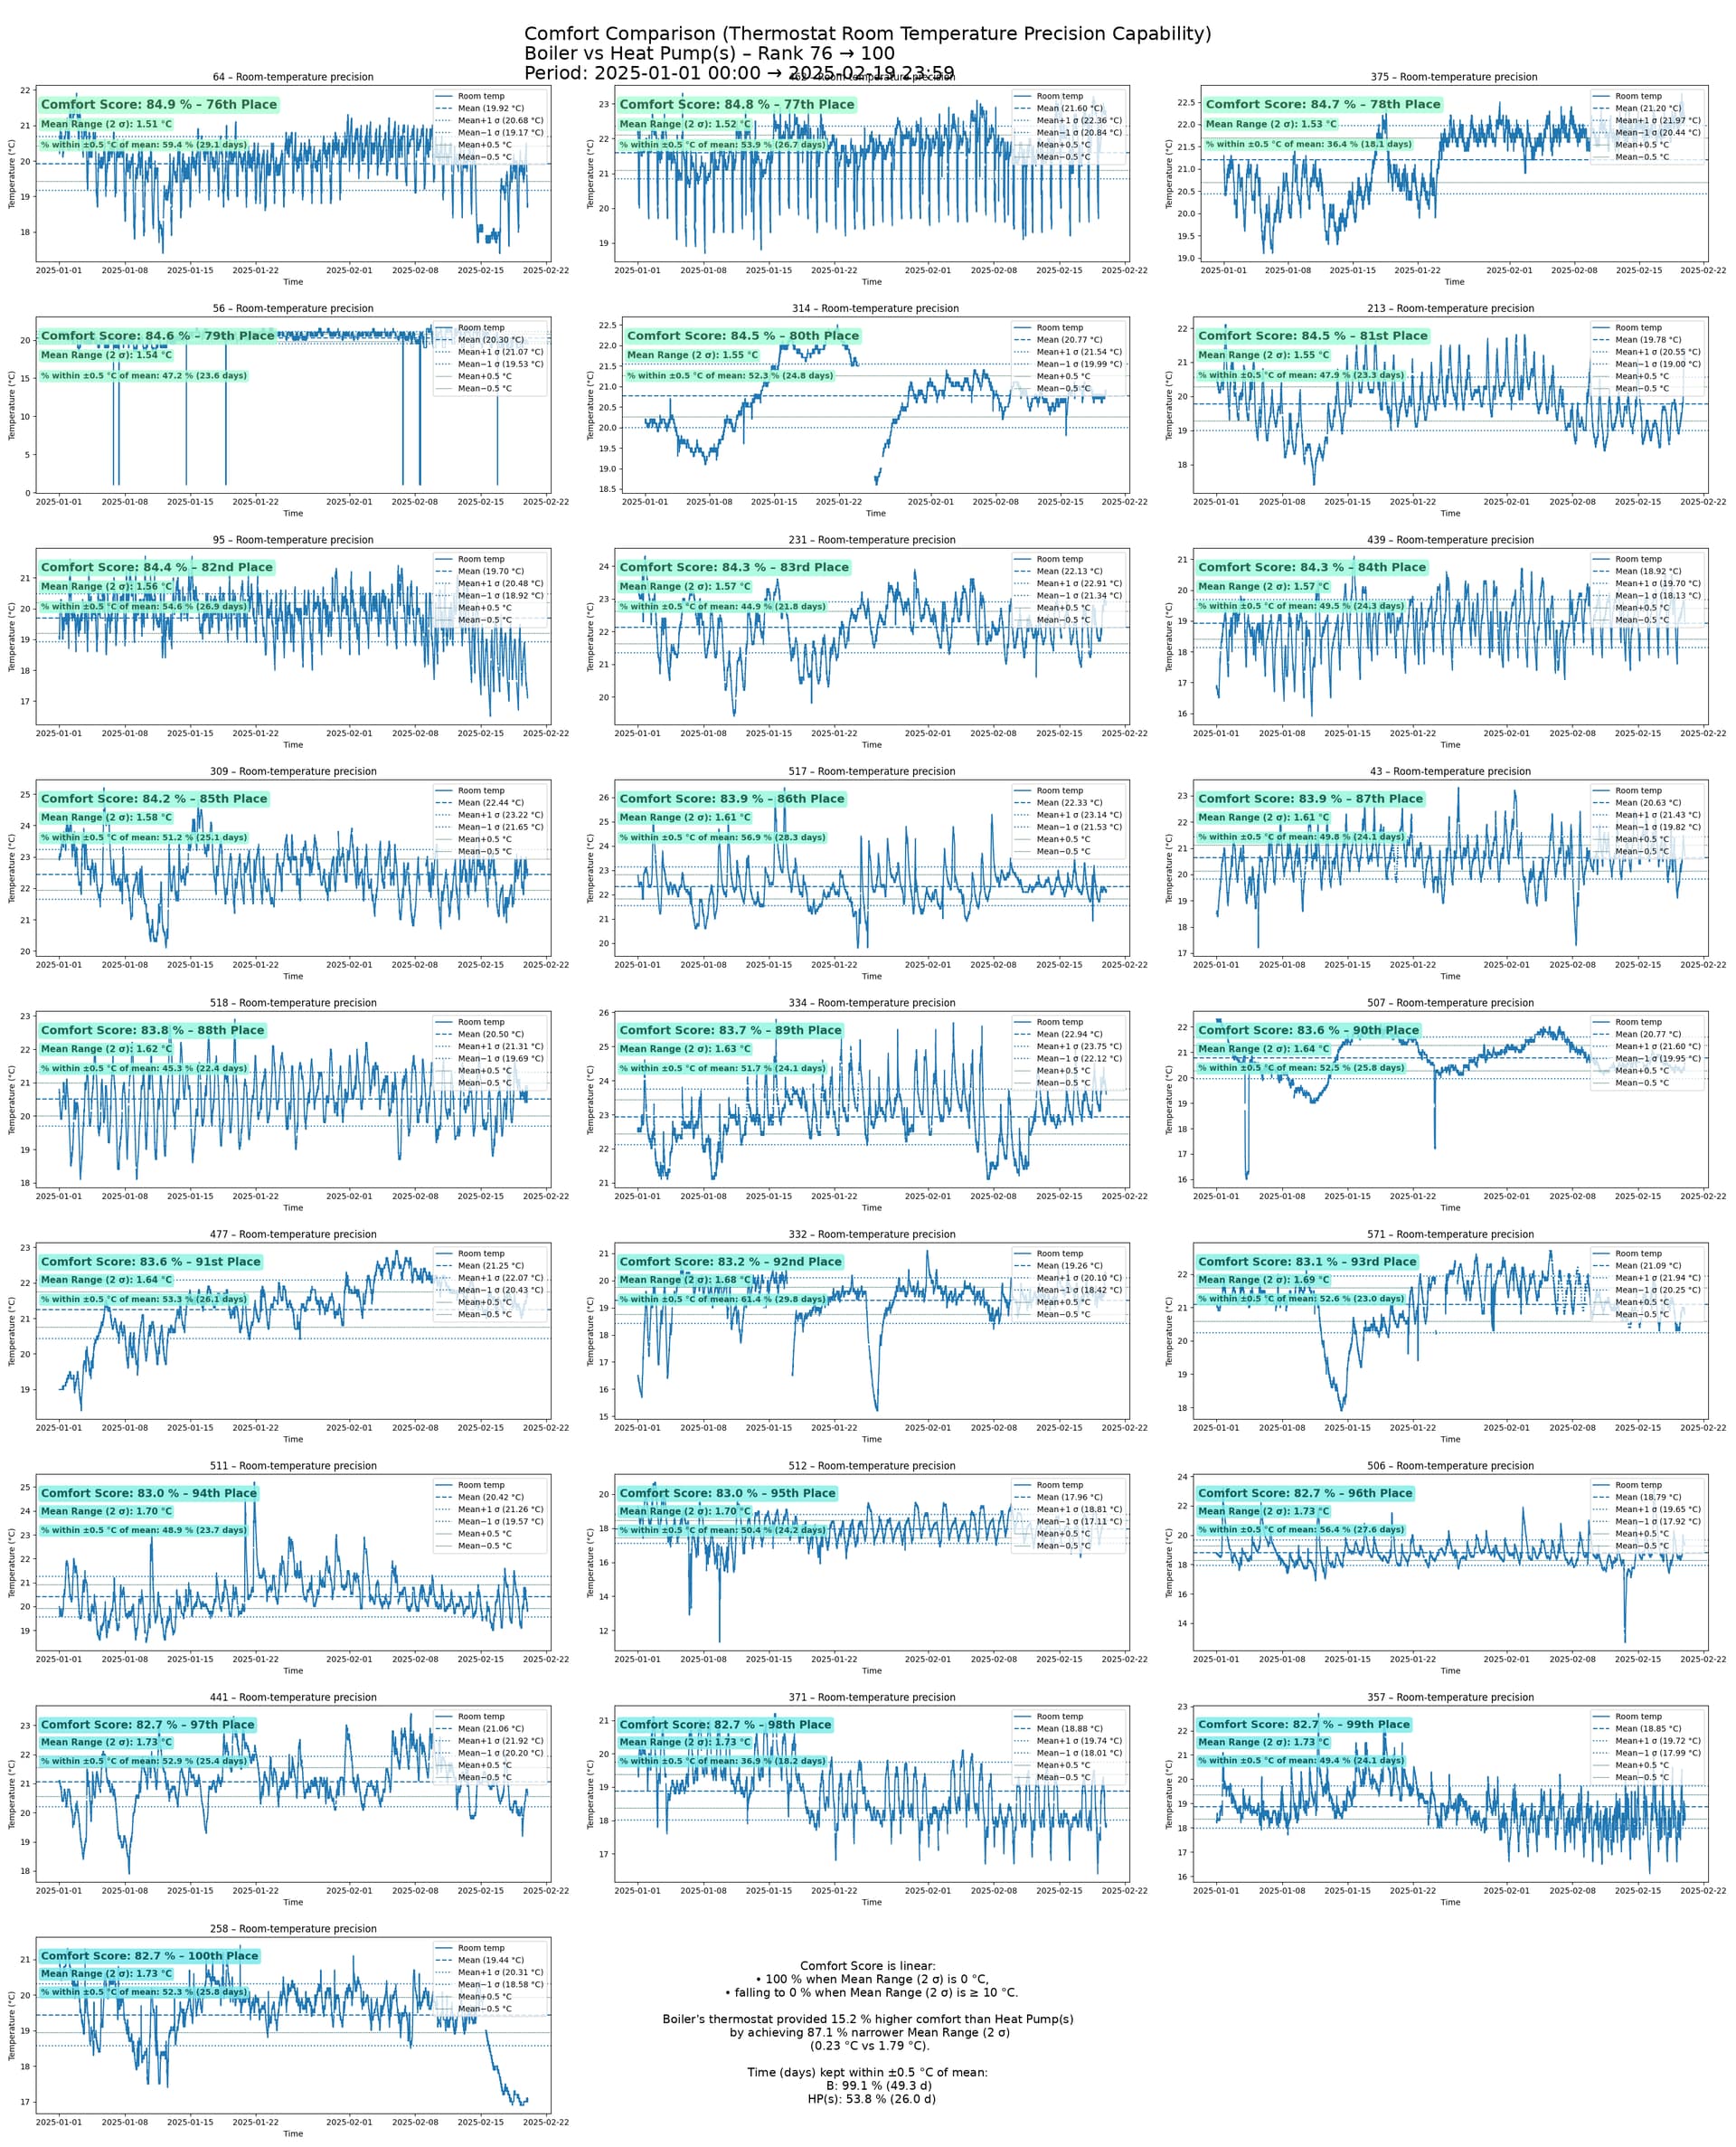
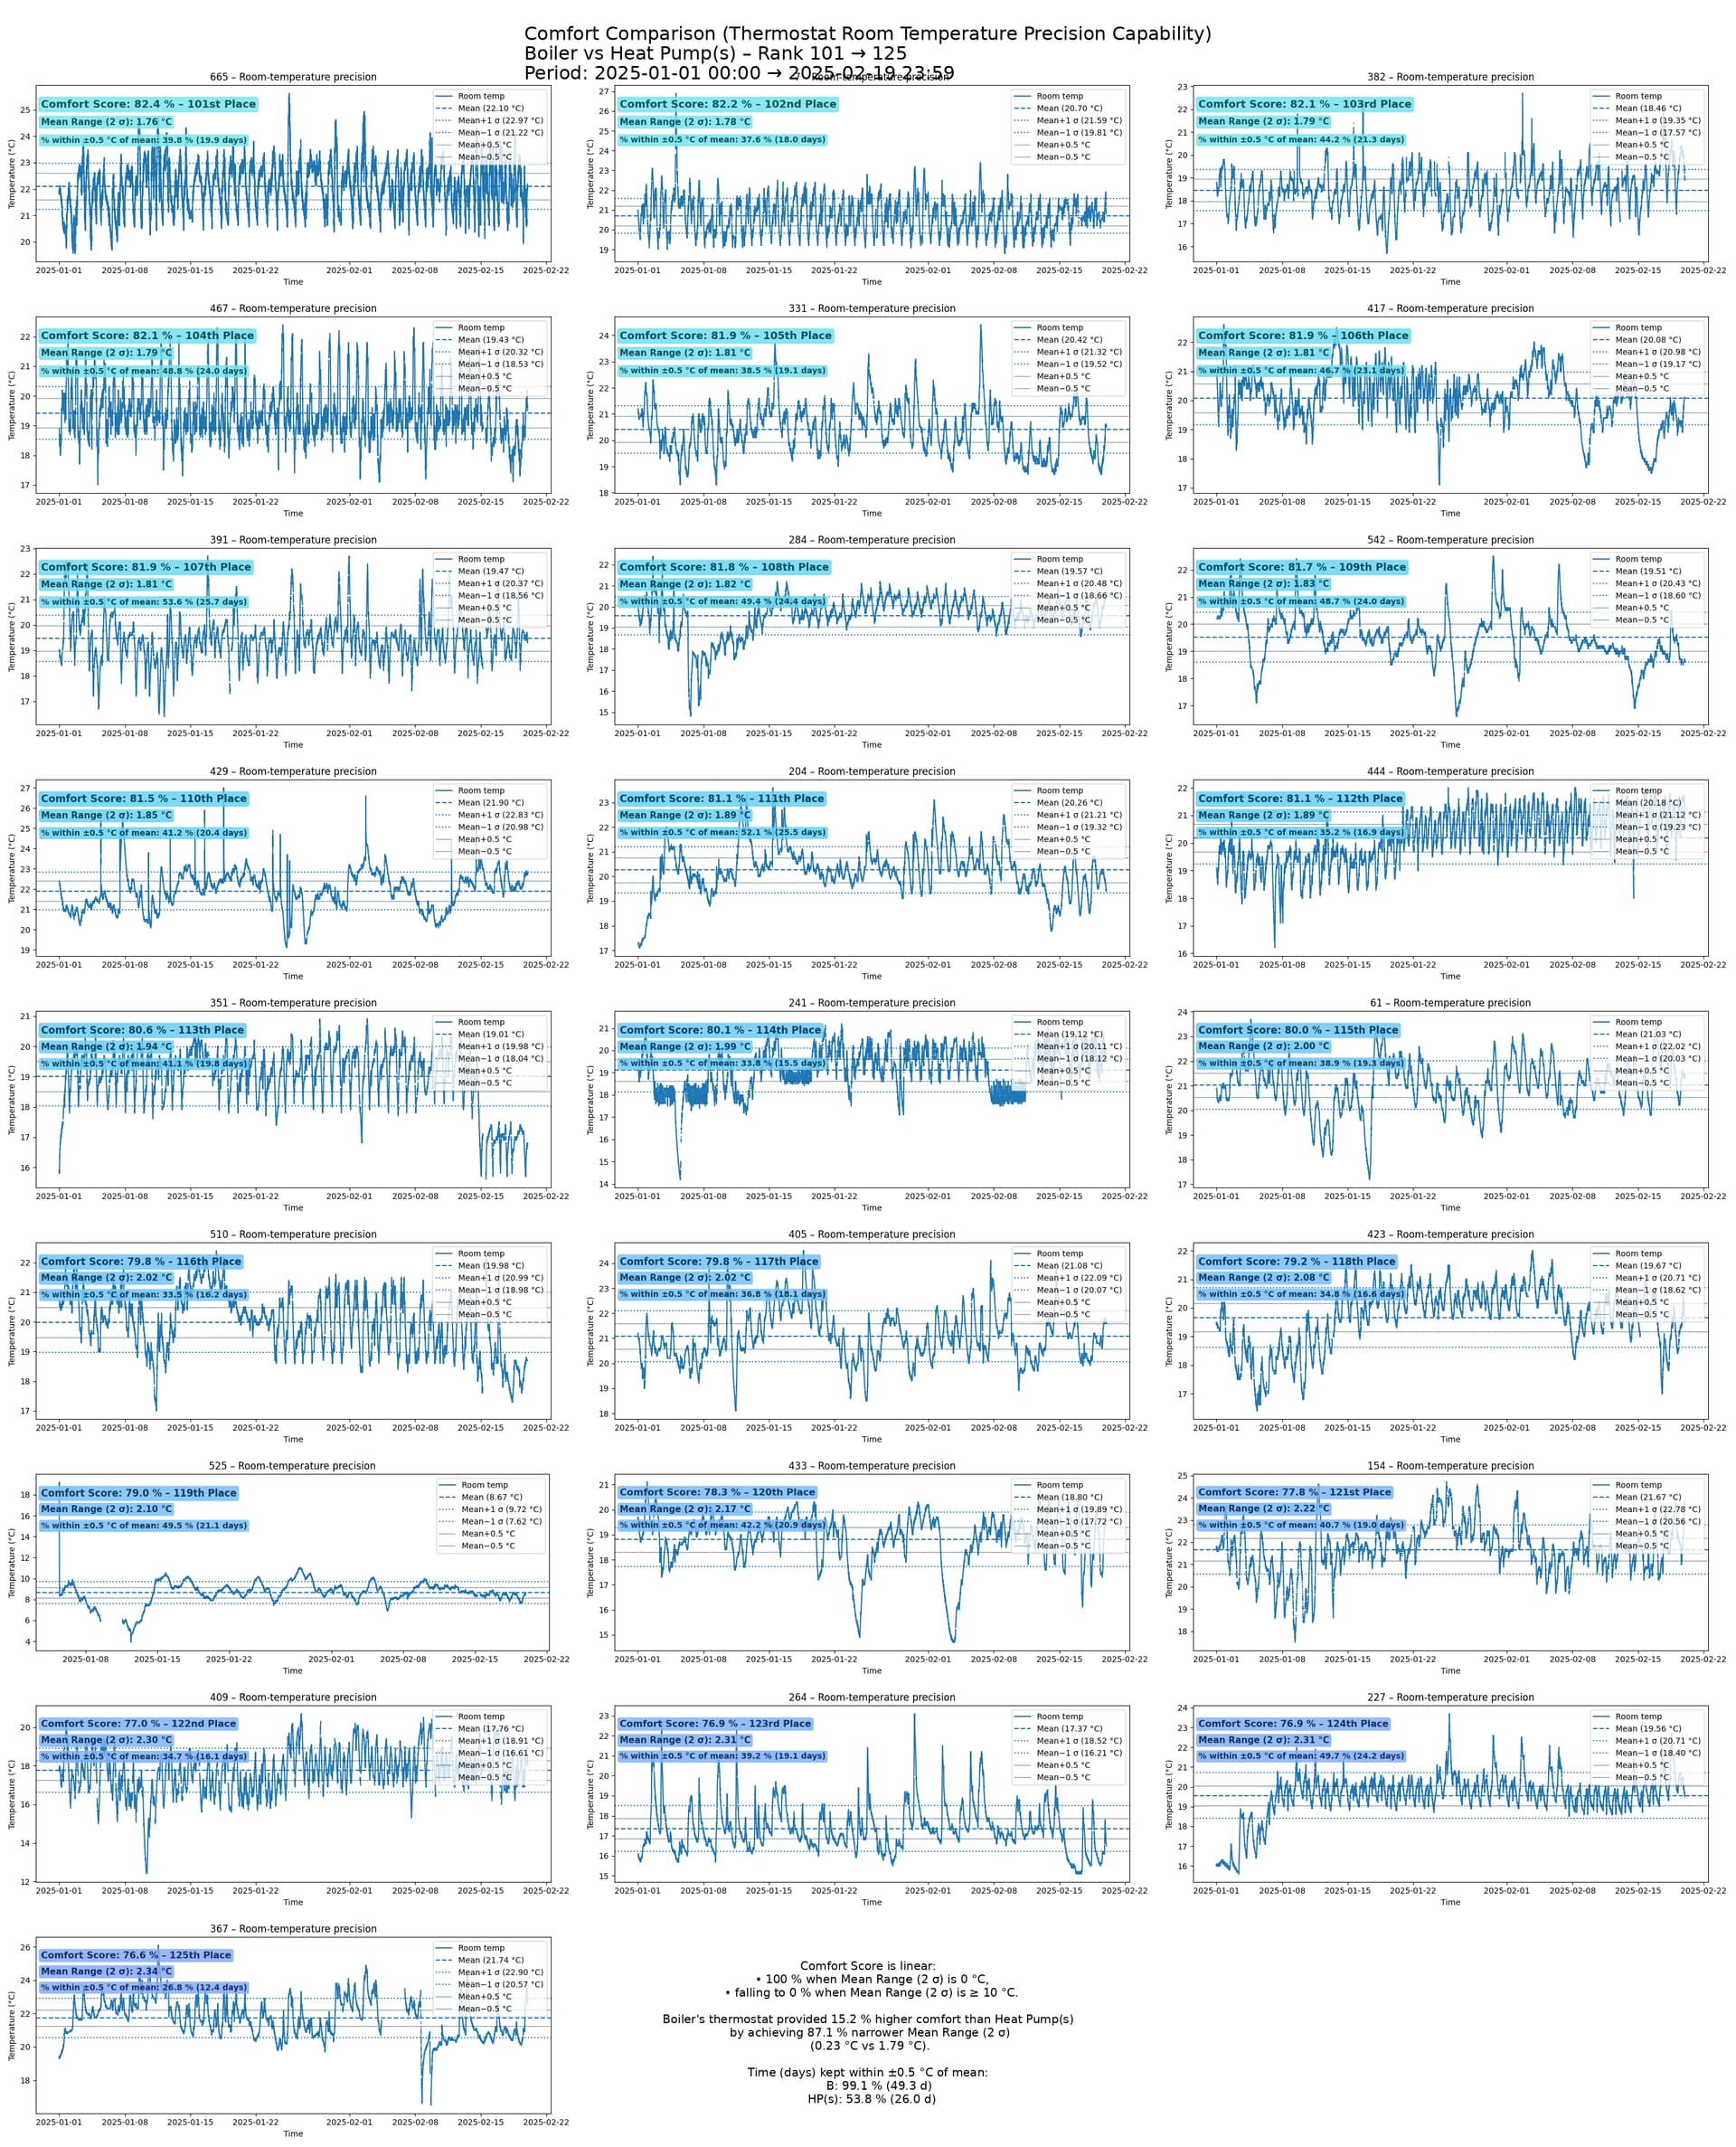
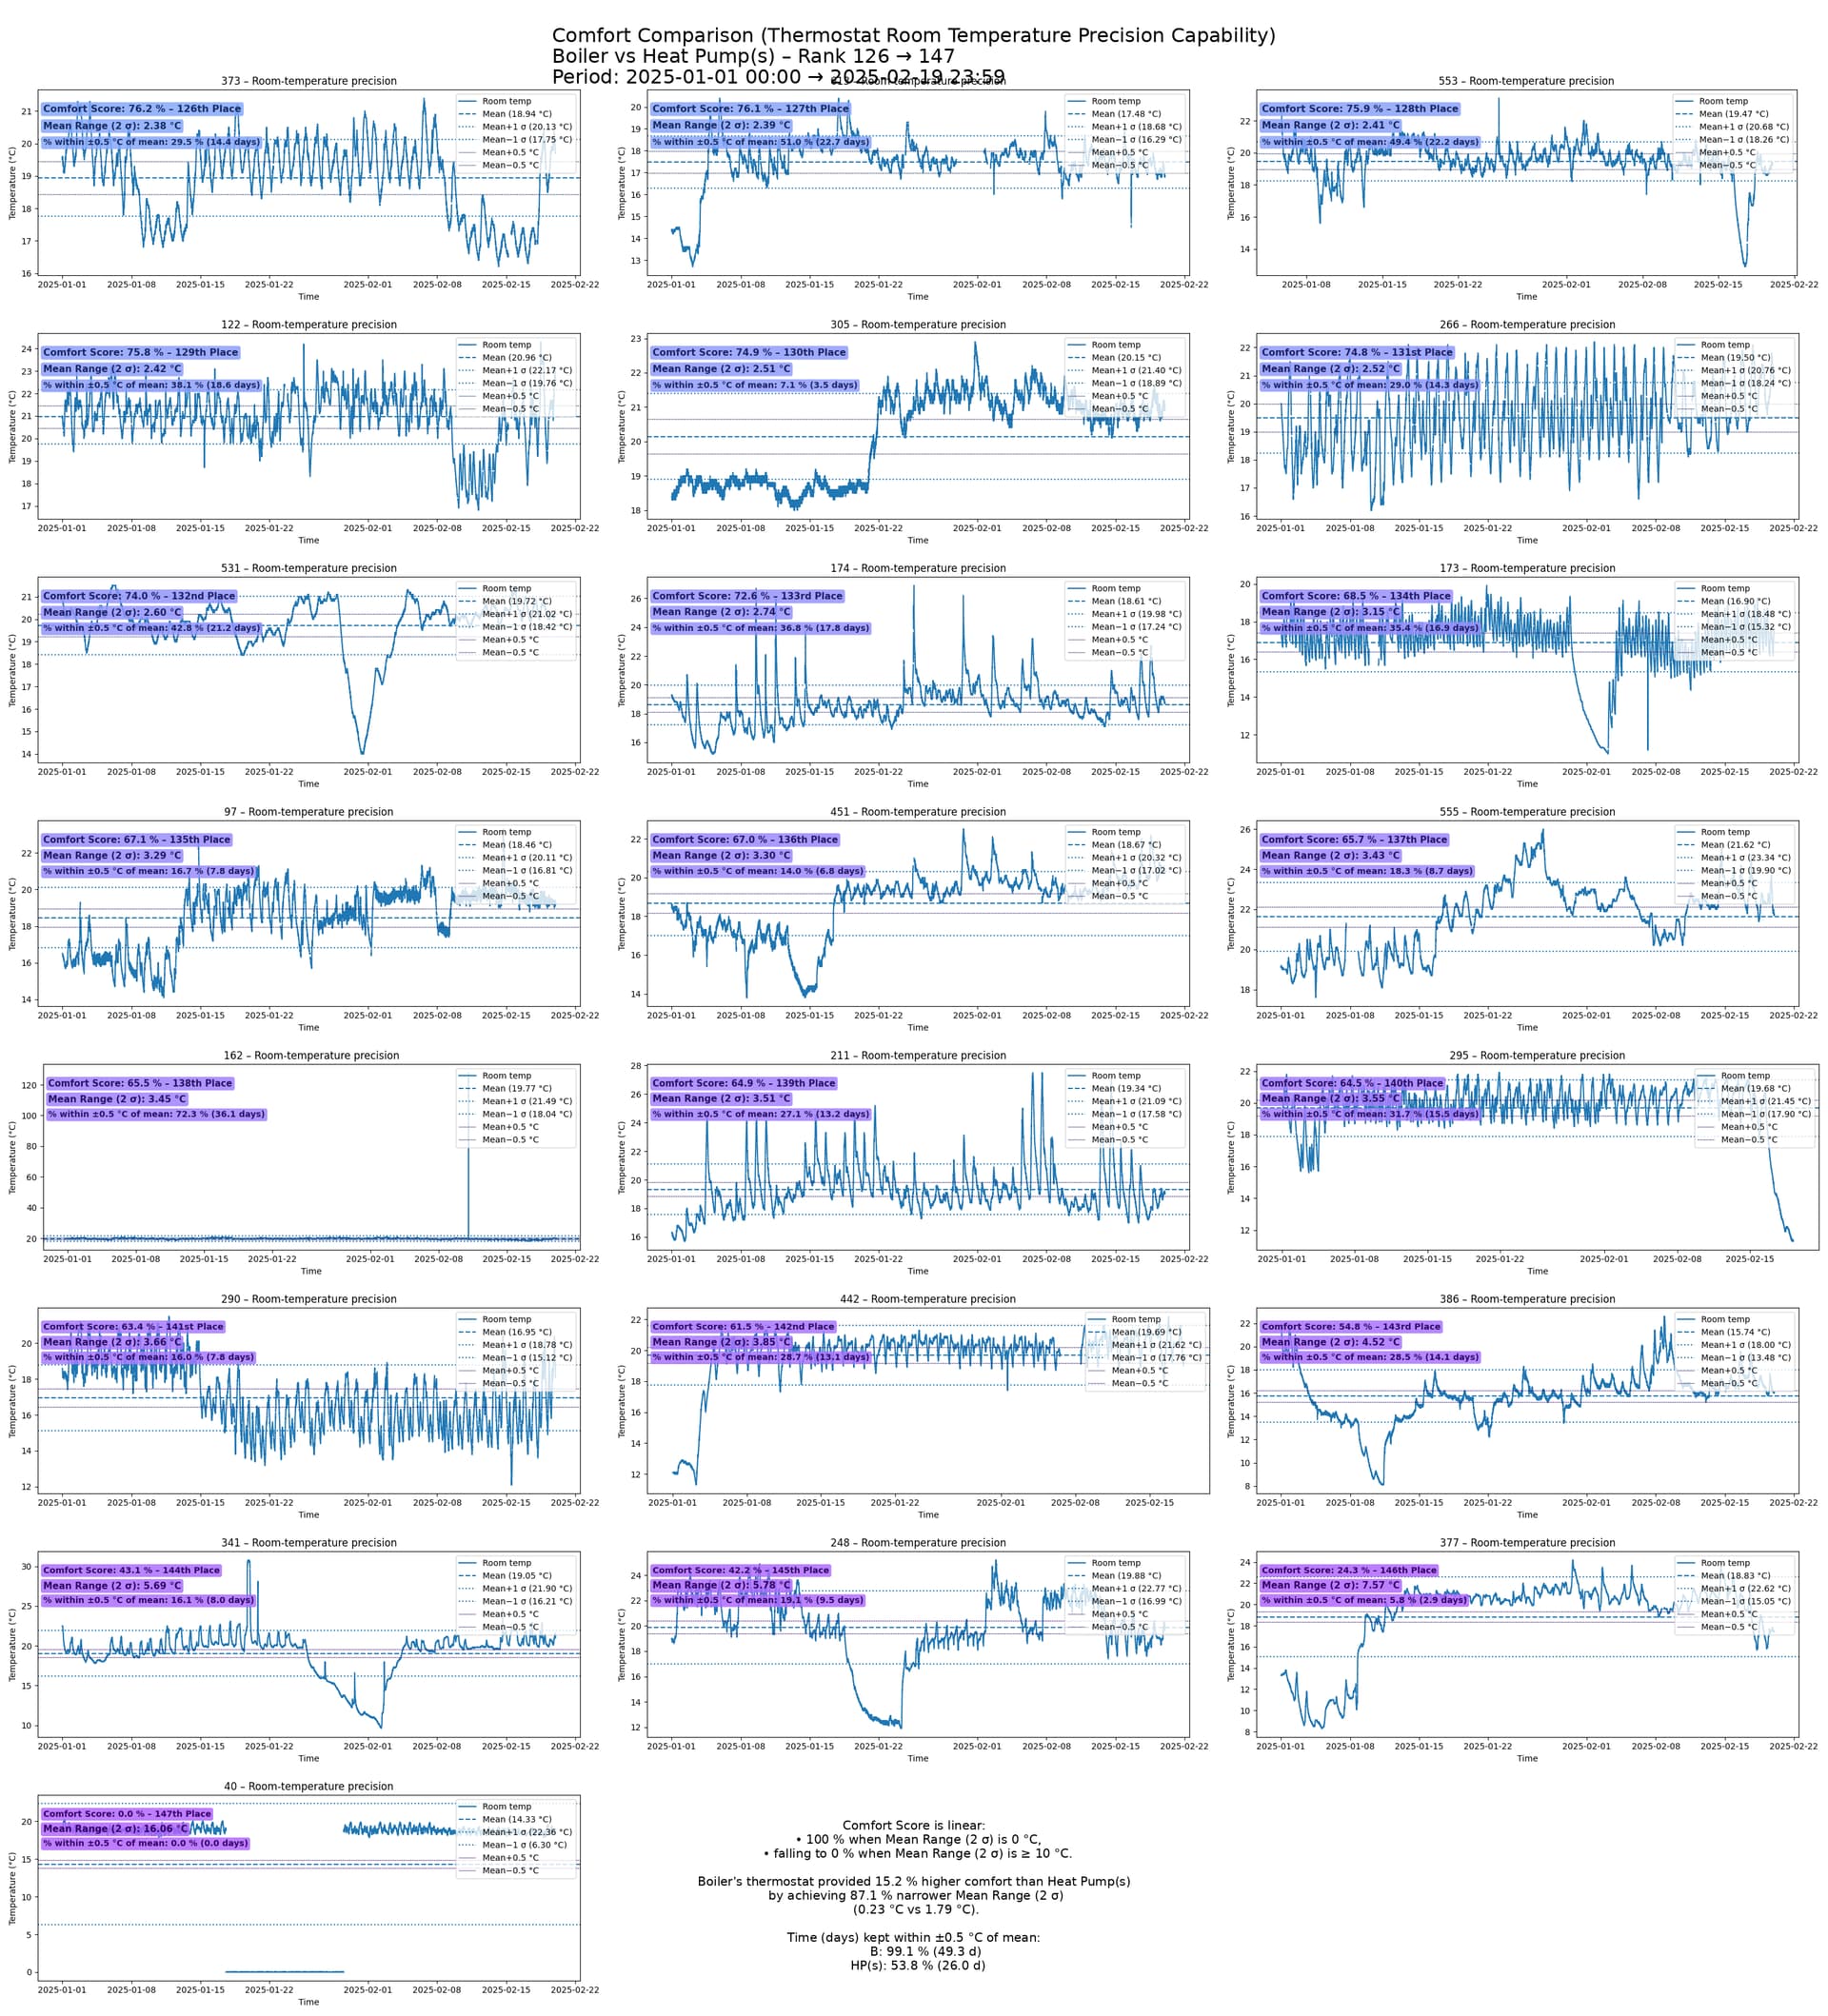
How about using standard deviation to calculate the comfort score for any selected period of time? 2σ as shown in the image gives a way to calculate a value without having to know what the target room temperature is. A value of 2σ = 0°C would be 100%, and let’s say 2σ = 10°C would be 0%. Then, anything between would give us an actual score?
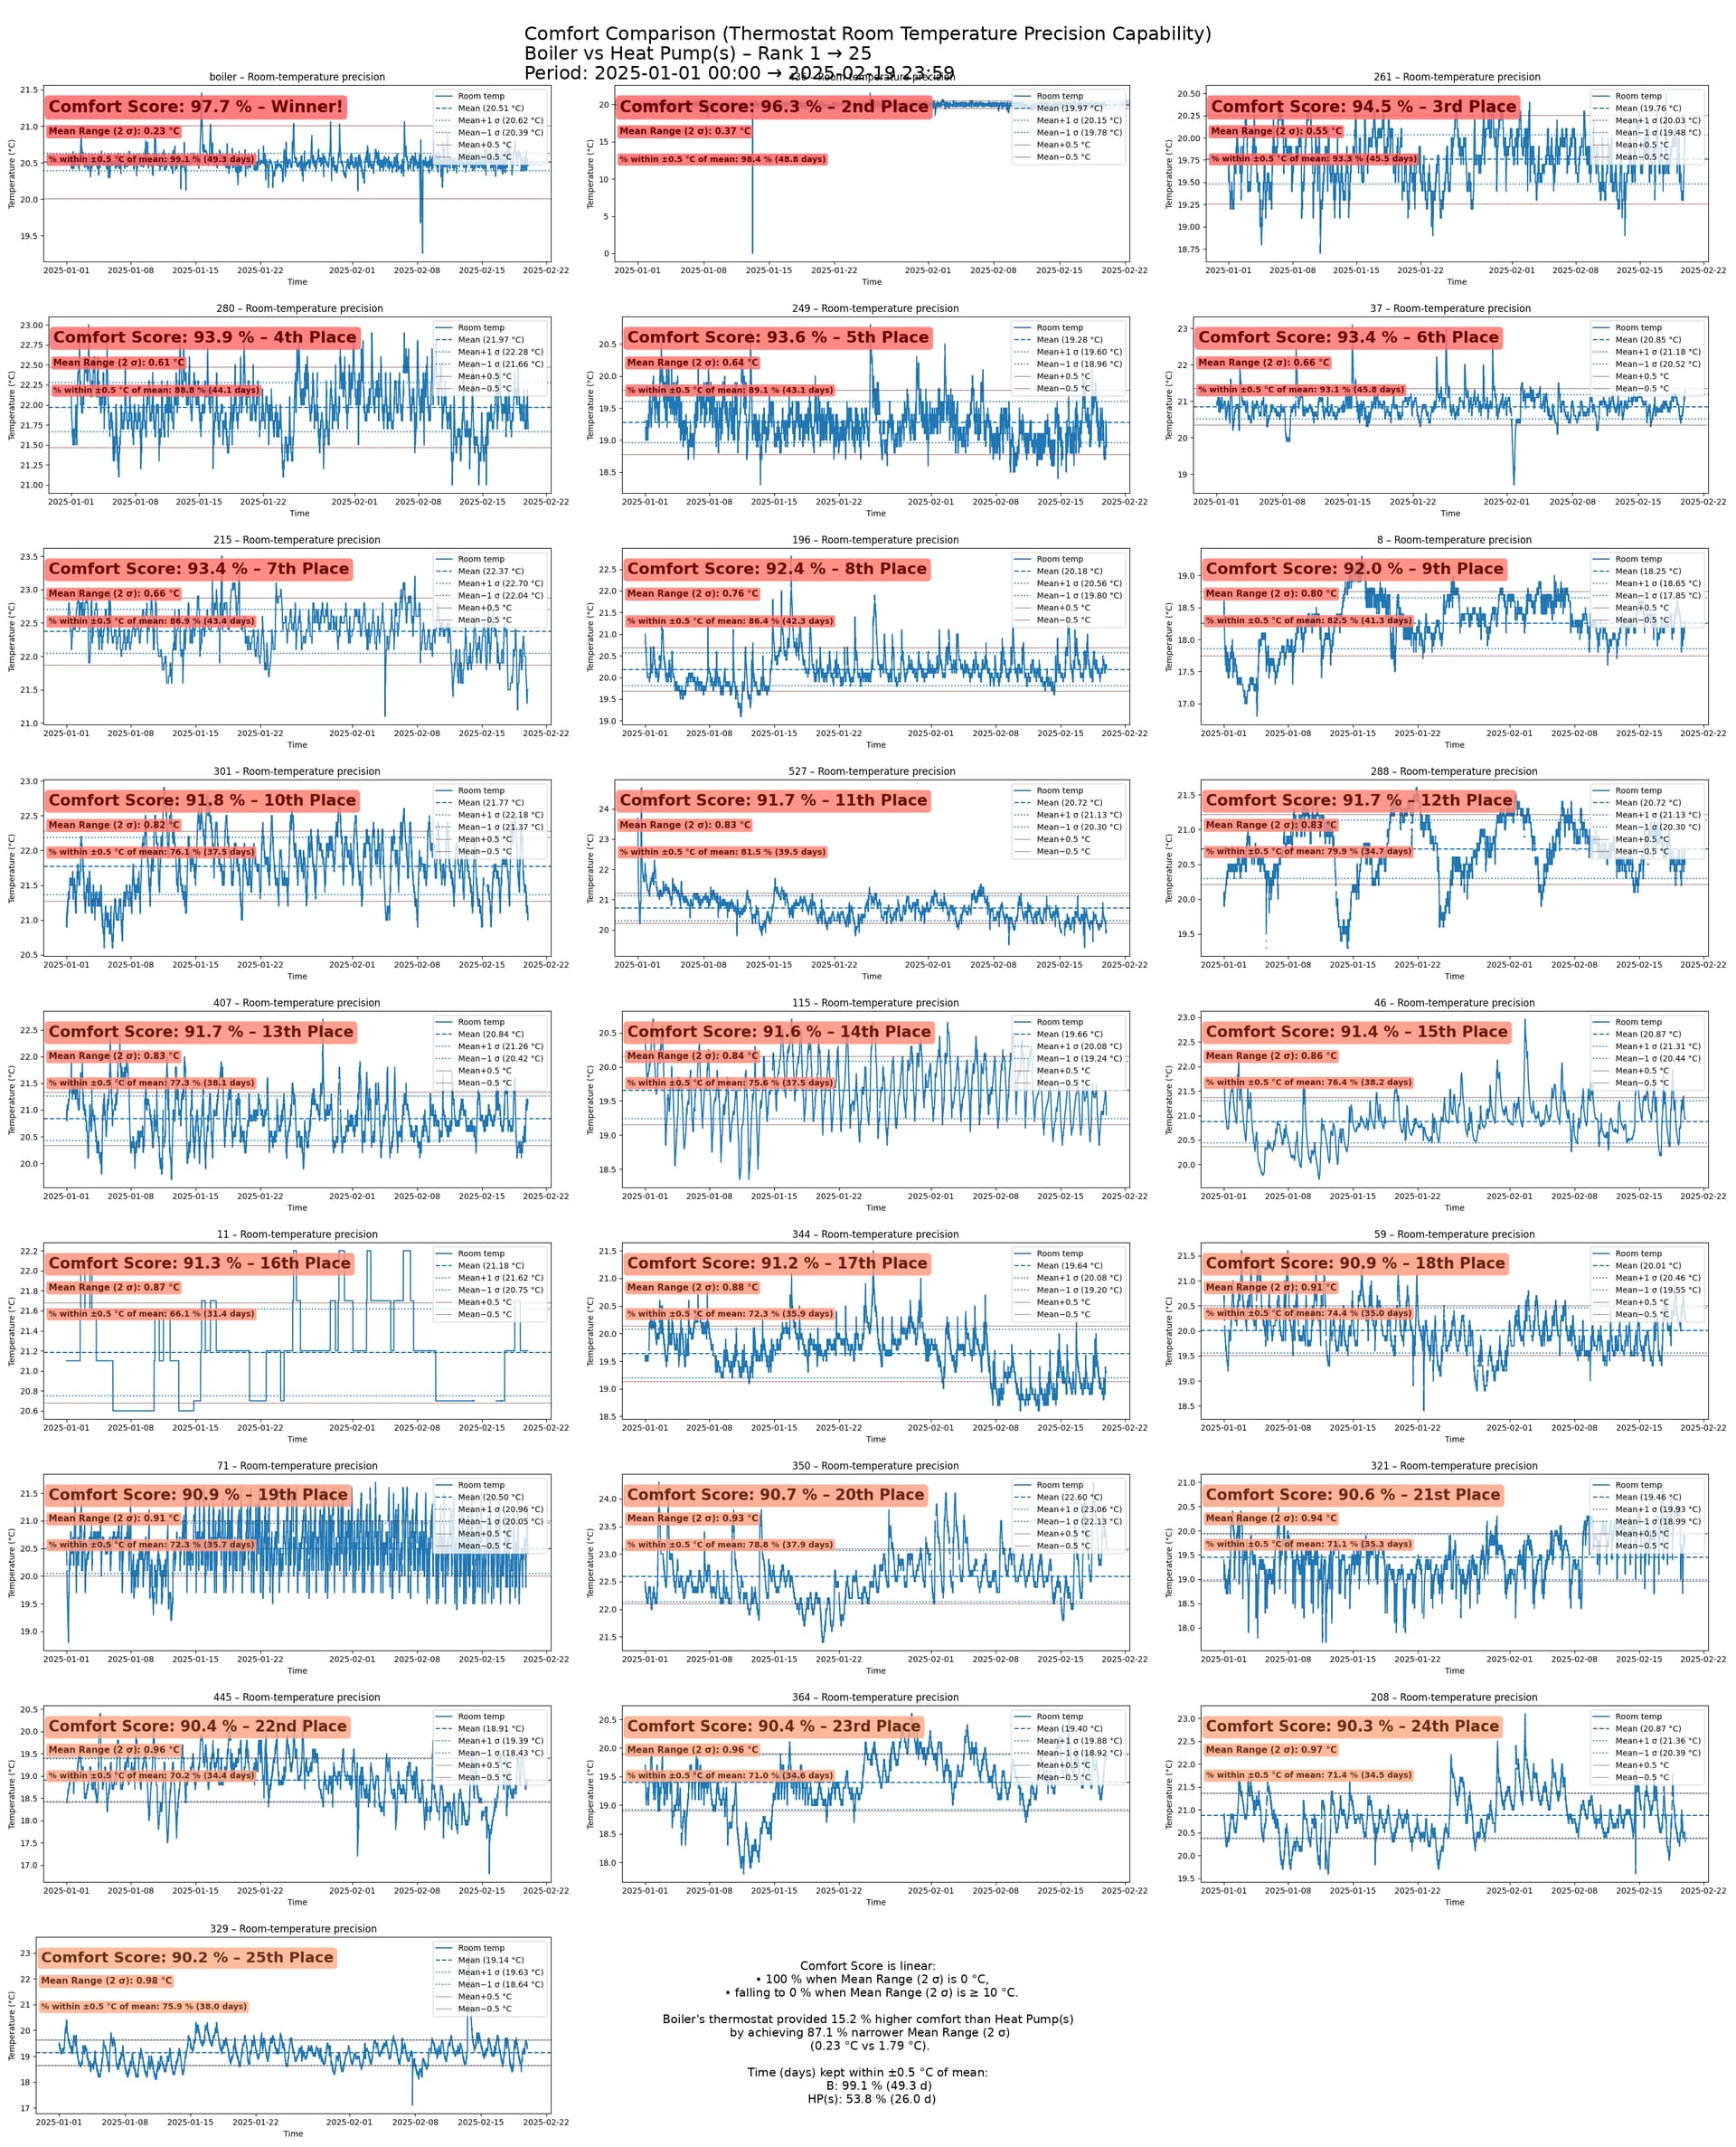
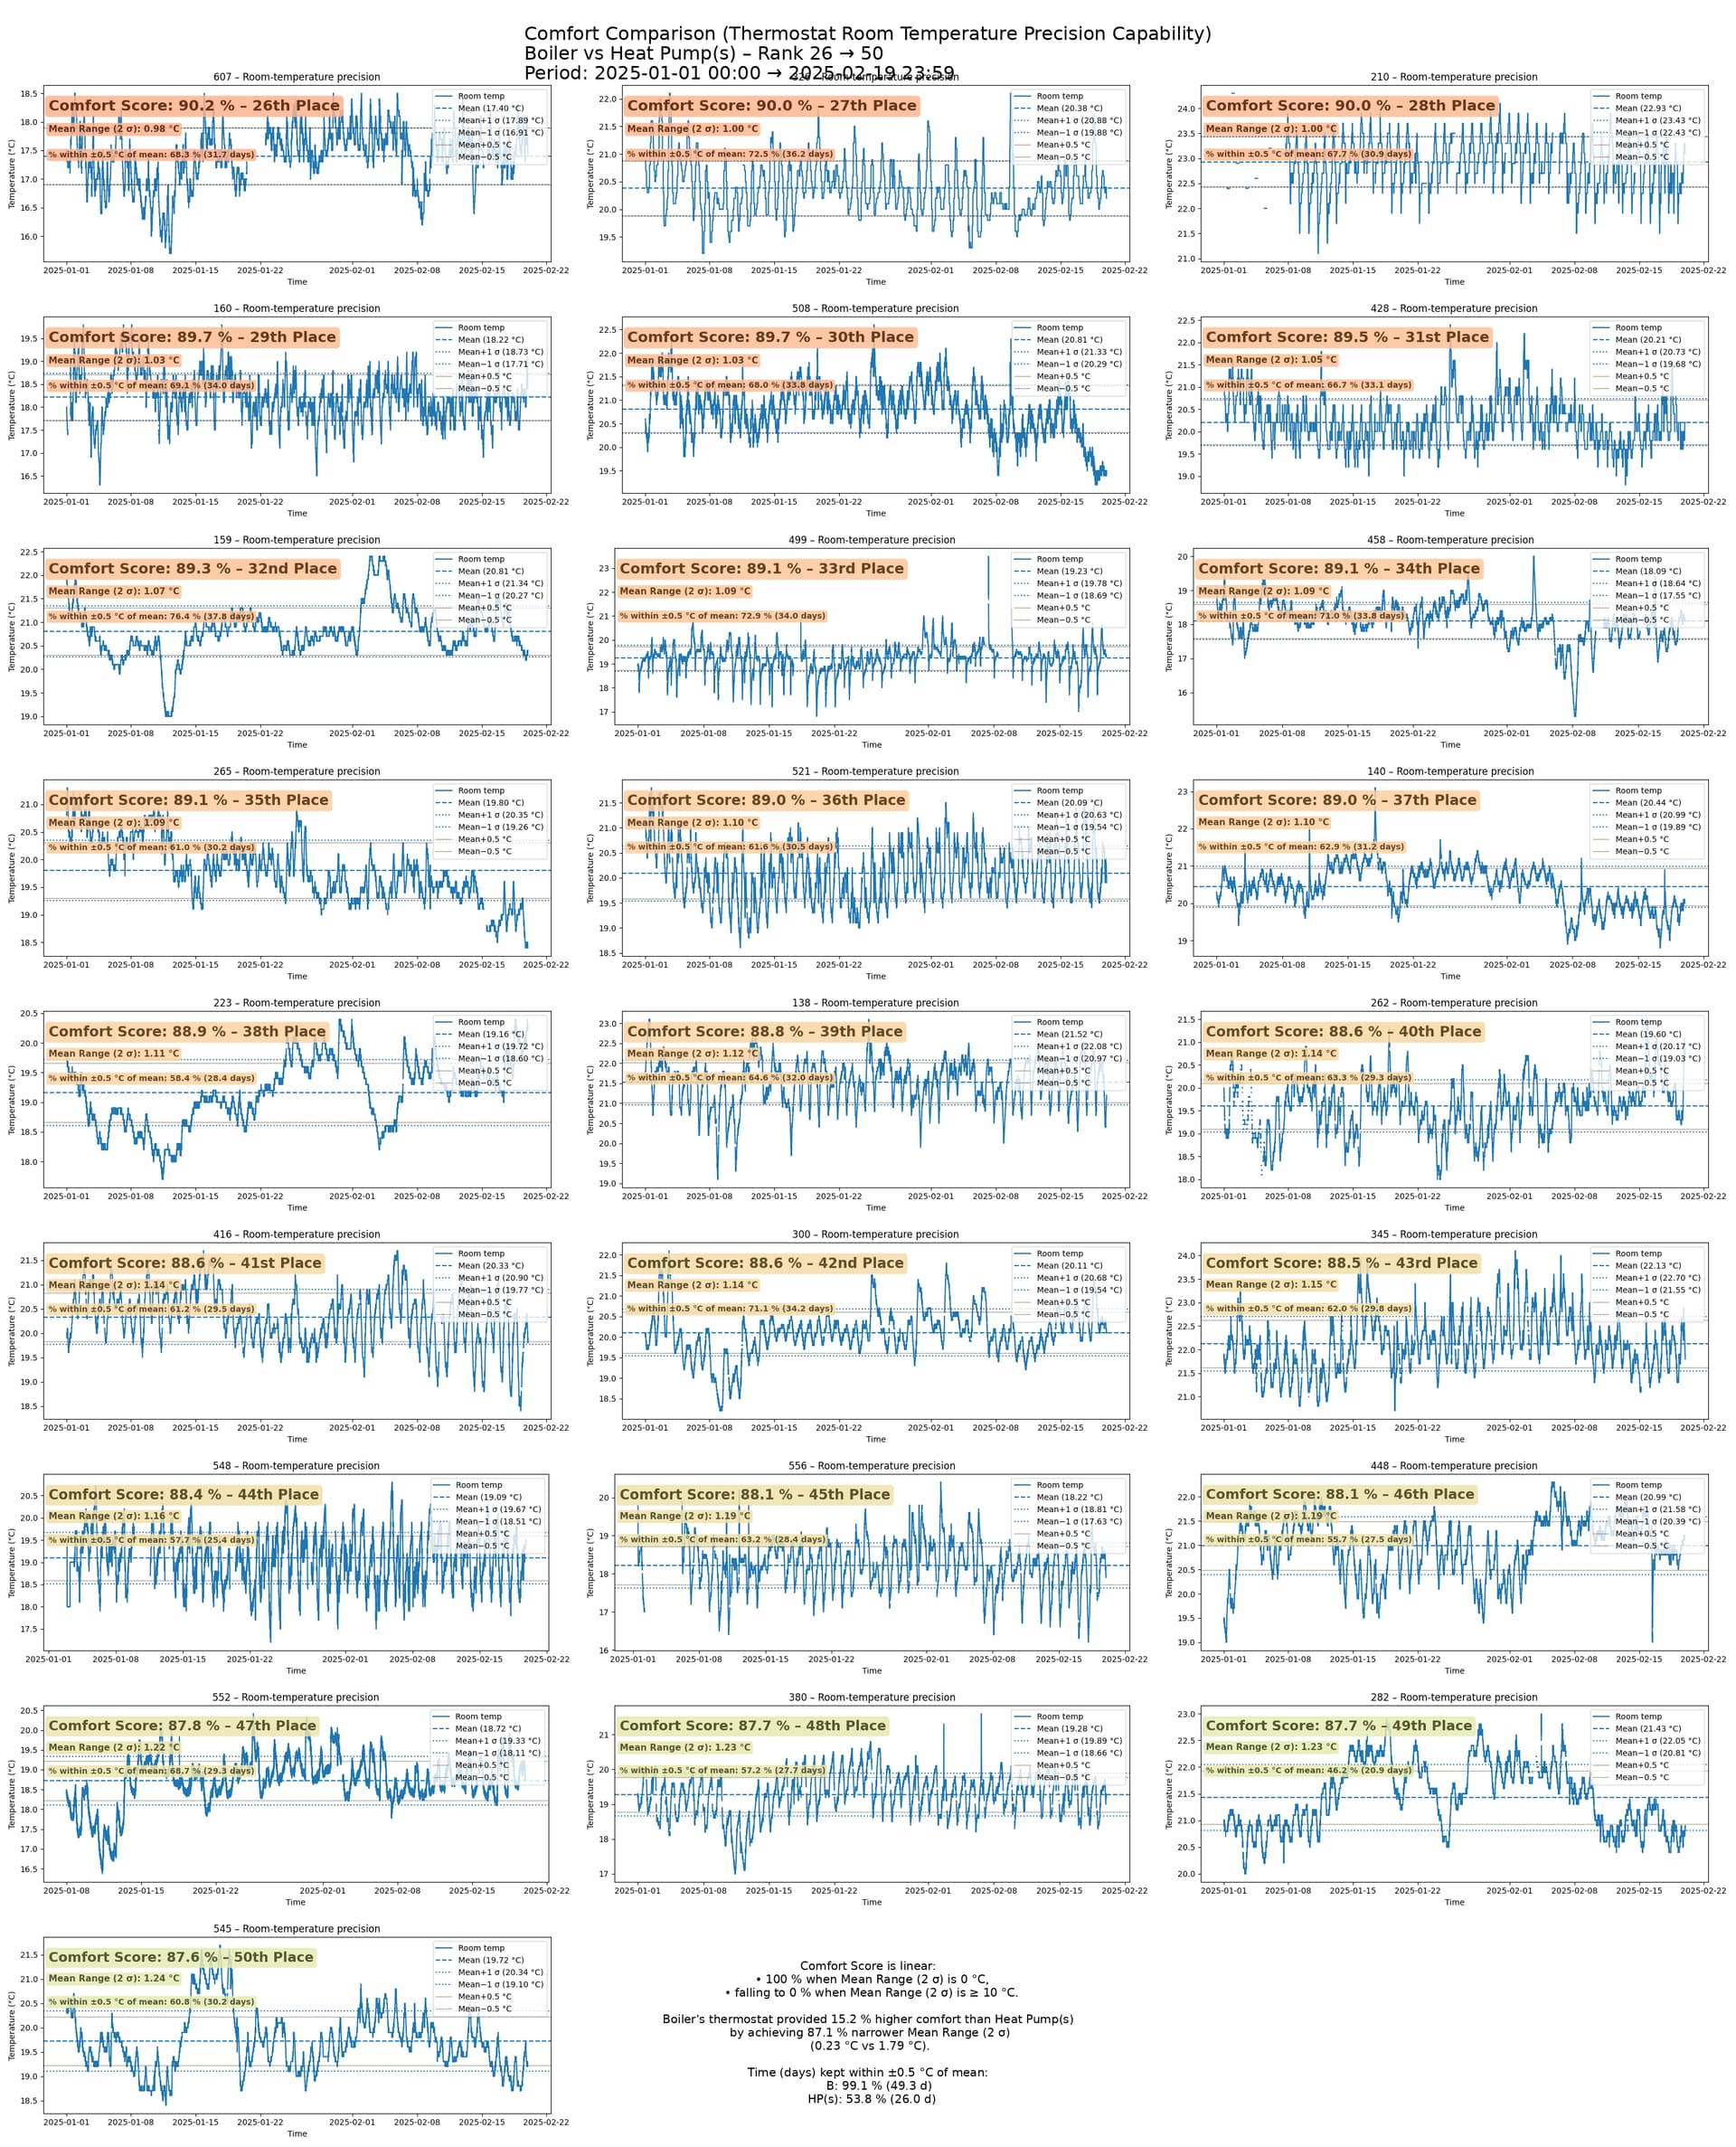
Here’s the full Comfort Score ranking. The data below is for the period “2025-Jan-01 00:00” --end “2025-Feb-19 23:59” which was the coldest period for many. Some heat pumps are missing as they didn’t have > 85% roomT data available for the selected period.
I must say though that I’m not convinced this is the right approach. Without knowing the target this is just the standard deviation. There are lots of people using setback overnight or might warm the house up for specific times. That’s for their comfort but gets “punished” in the model. Different sensor locations, outliers, solar gain, intermittent ventilation boosts (German Stoßlüften ) all enter here. An RMS deviation from a target value would be a start as I mentioned previously; after careful outlier filtering (look at the 2nd place) and gating for periods where the occupants care about the temperature. With thermal inertia being as it is, the heat pump has zero control over the cooldown period and the ramp-up can only be accelerated by increasing power and reducing COP. It would be very very tough to get anything truly comparable.
Thanks! You are right, there are many factors. It took me weeks to find a sensor location that minimises stray heat from the TV, kettle, or people passing by. However, I’d like to install MVHR in the future and even that spot would get affected then. Stoßlüften is ingenious
The beauty of this approach is its simplicity: no extra user configuration is required
Maybe instead of calling it Comfort Score which implies that all these factors are weighed and accounted for (maybe in the future), we could give this metric a more general name, e.g.
Thermal Steadiness Index
Room Temperature Stability Score
That way, users can compare their system with another and answer the kind of questions you raised as complexity factors! e.g. “By how much do room‑temperature swings increase under a variable‑rate electricity tariff—where the setpoint is raised during certain hours to maximise savings—compared with a flat‑tariff system?”
I’ve been monitoring whole house room-by-room temperatures for over a year now using 11 sensors logging to Home Assistant.
The heat pump was installed last June, with the Vaillant SensoComfort controls in a central location internal wall downstairs, and an emonTH on an internal wall in the N facing bedroom above. The weather compensation sensor is on a N facing wall. I’ve been running my heat pump purely on weather compensation so far, so the SensoComfort thermostat is not being used to control the heat pump.
It’s been really interesting watching temperature variation day by day and room by room. Solar gain is really obvious from the graphs, far more than any wind effect.
I much prefer the term Room Temperature Stability Score to Comfort Score because using just one temperature sensor only indicates the temperature stability of, as you say, one carefully chosen room, which may or may not be a room you spend much time in.
Some rooms in my house suffer from a big temperature range mainly due to fabric/airtightness and solar gain, whereas the SensoComfort and emonTH were carefully located to avoid solar gain, and both are in rooms the original house with similar heat losses. A full set of room sensors in a certified Passivhaus would I’m sure tell a different story!
Well… Still a big influence from solar gain in my Passivhaus. There’s fixed shading to keep out the summer sun but the winter sun (intentionally) gets in under the shading and heats the south-facing rooms, some of which have a lot of (triple) glazing. Obviously the free heating is A Good Thing but it does lead to temperature variations; probably more than you’d expect.
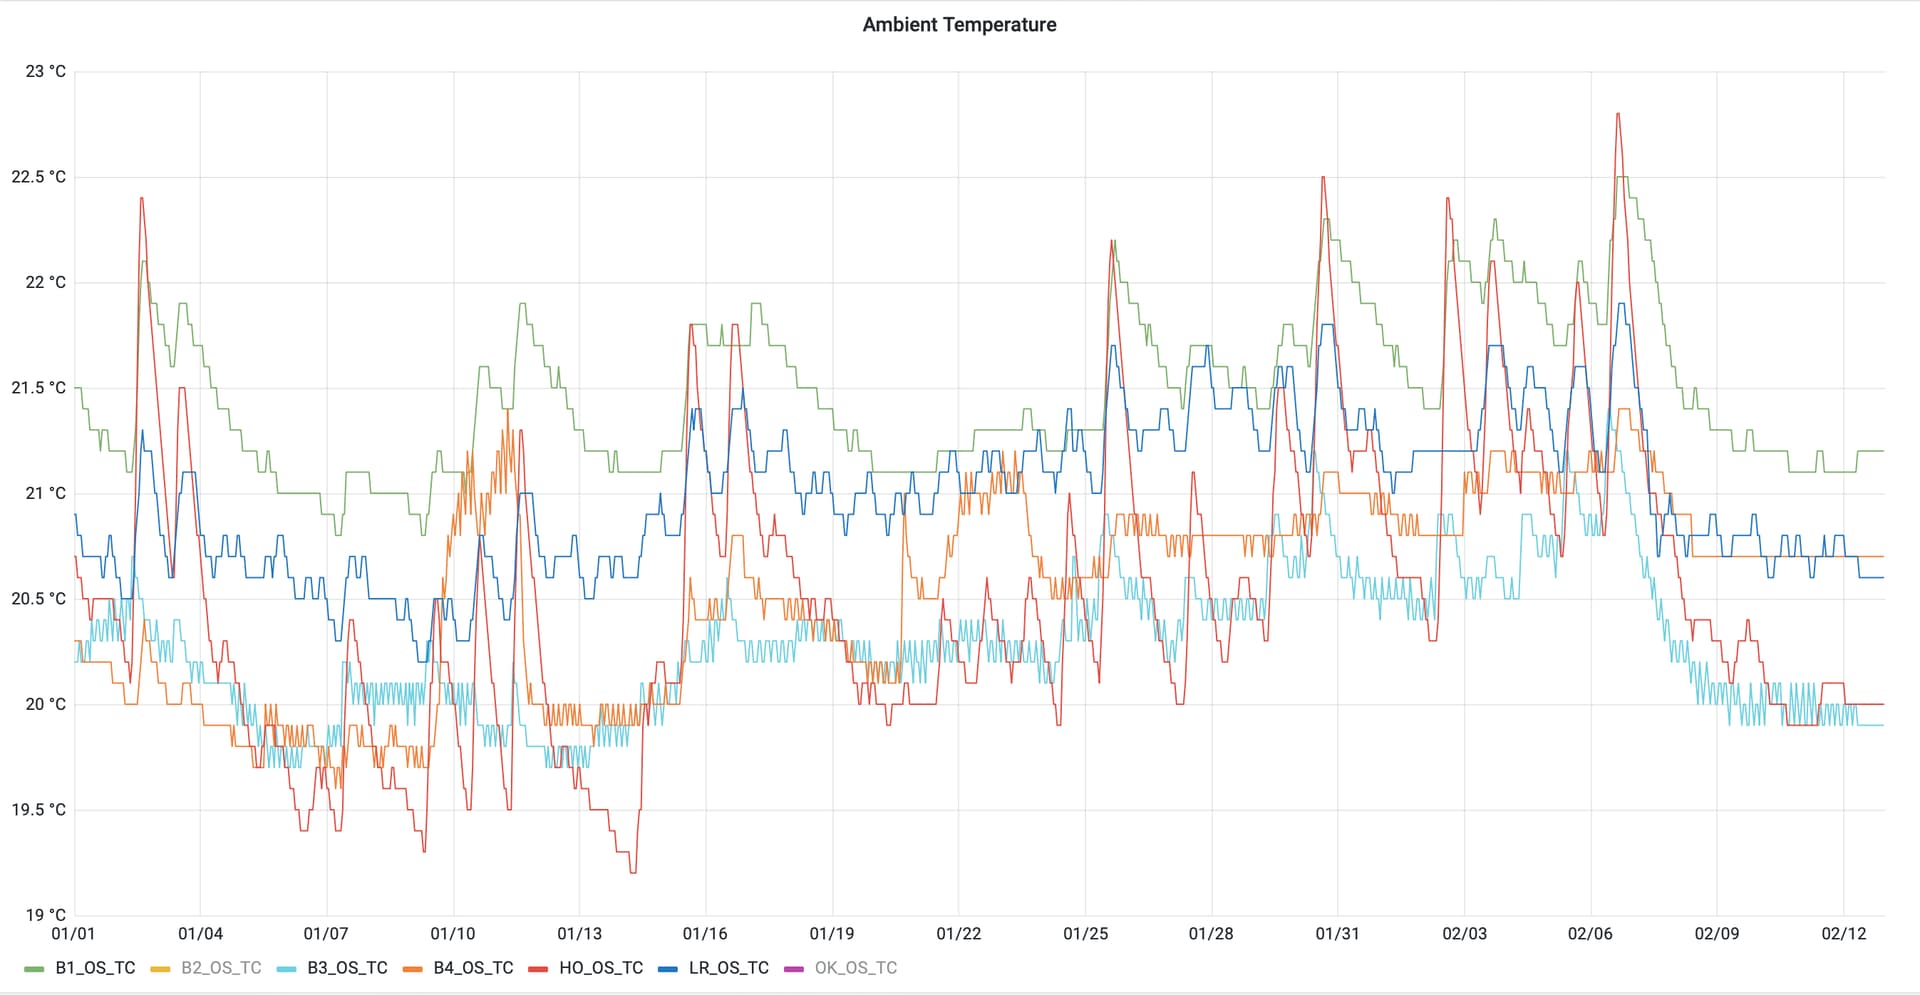
The MVHR system tends to even out the temperatures but there remains a distinct north-south split:
B1 (Bedroom 1; Green line) is on the south-west corner, has a lot of glazing and is the warmest of the bedrooms; also has the highest occupancy
B3 (Bedroom 3; Cyan line) is on the north-east corner and is the coolest of the bedrooms
B4 (Bedroom 4; Orange line) is on the north-west corner, directly above LR (Living Room; Blue line)
HO (Home Office; Red line) is in the ‘attic’, facing west, with less thermal mass than the rest of the house (SIP construction rather than brick-and-block) and has the greatest temperature swings
If the heat pump was to run purely on WC control, the house would overheat in cold-but-sunny conditions, so a centrally-located room temperature sensor acts to dial-back the WC algorithm when that sensor exceeds the target temperature.
I presume the last few days on this graph weren’t very sunny, so they’re showing decent temperature regulation from the NIBE heat pump, compared with the much greater swings on the sunny days.
I’d expect the solar gain to be greater in a passivhaus if anything. It certainly is in my house. At present when there’s no heating, the average temperature starts at around 22.5°C between 08:00 and 09:00 and climbs to around 23.5°C by about 16:00 and then falls back over the rest of the time.
During the heating season, the temperature varies about 1.5 K, because I just run heating overnight on an E7 tariff. So it peaks about 08:00 and is at its lowest about midnight.
We’re quite happy with the reversed temperature profile and comparatively large temperature changes. It’s definitely the most comforatble house we’ve lived in.
Solar influence is huge for me as well. I’m currently in process building an addon for the MyHeatpump app to perform heat demand estimation including solar gains from official meteorological sources. Have a look here: