A local heat demand tool for the myheatpump app

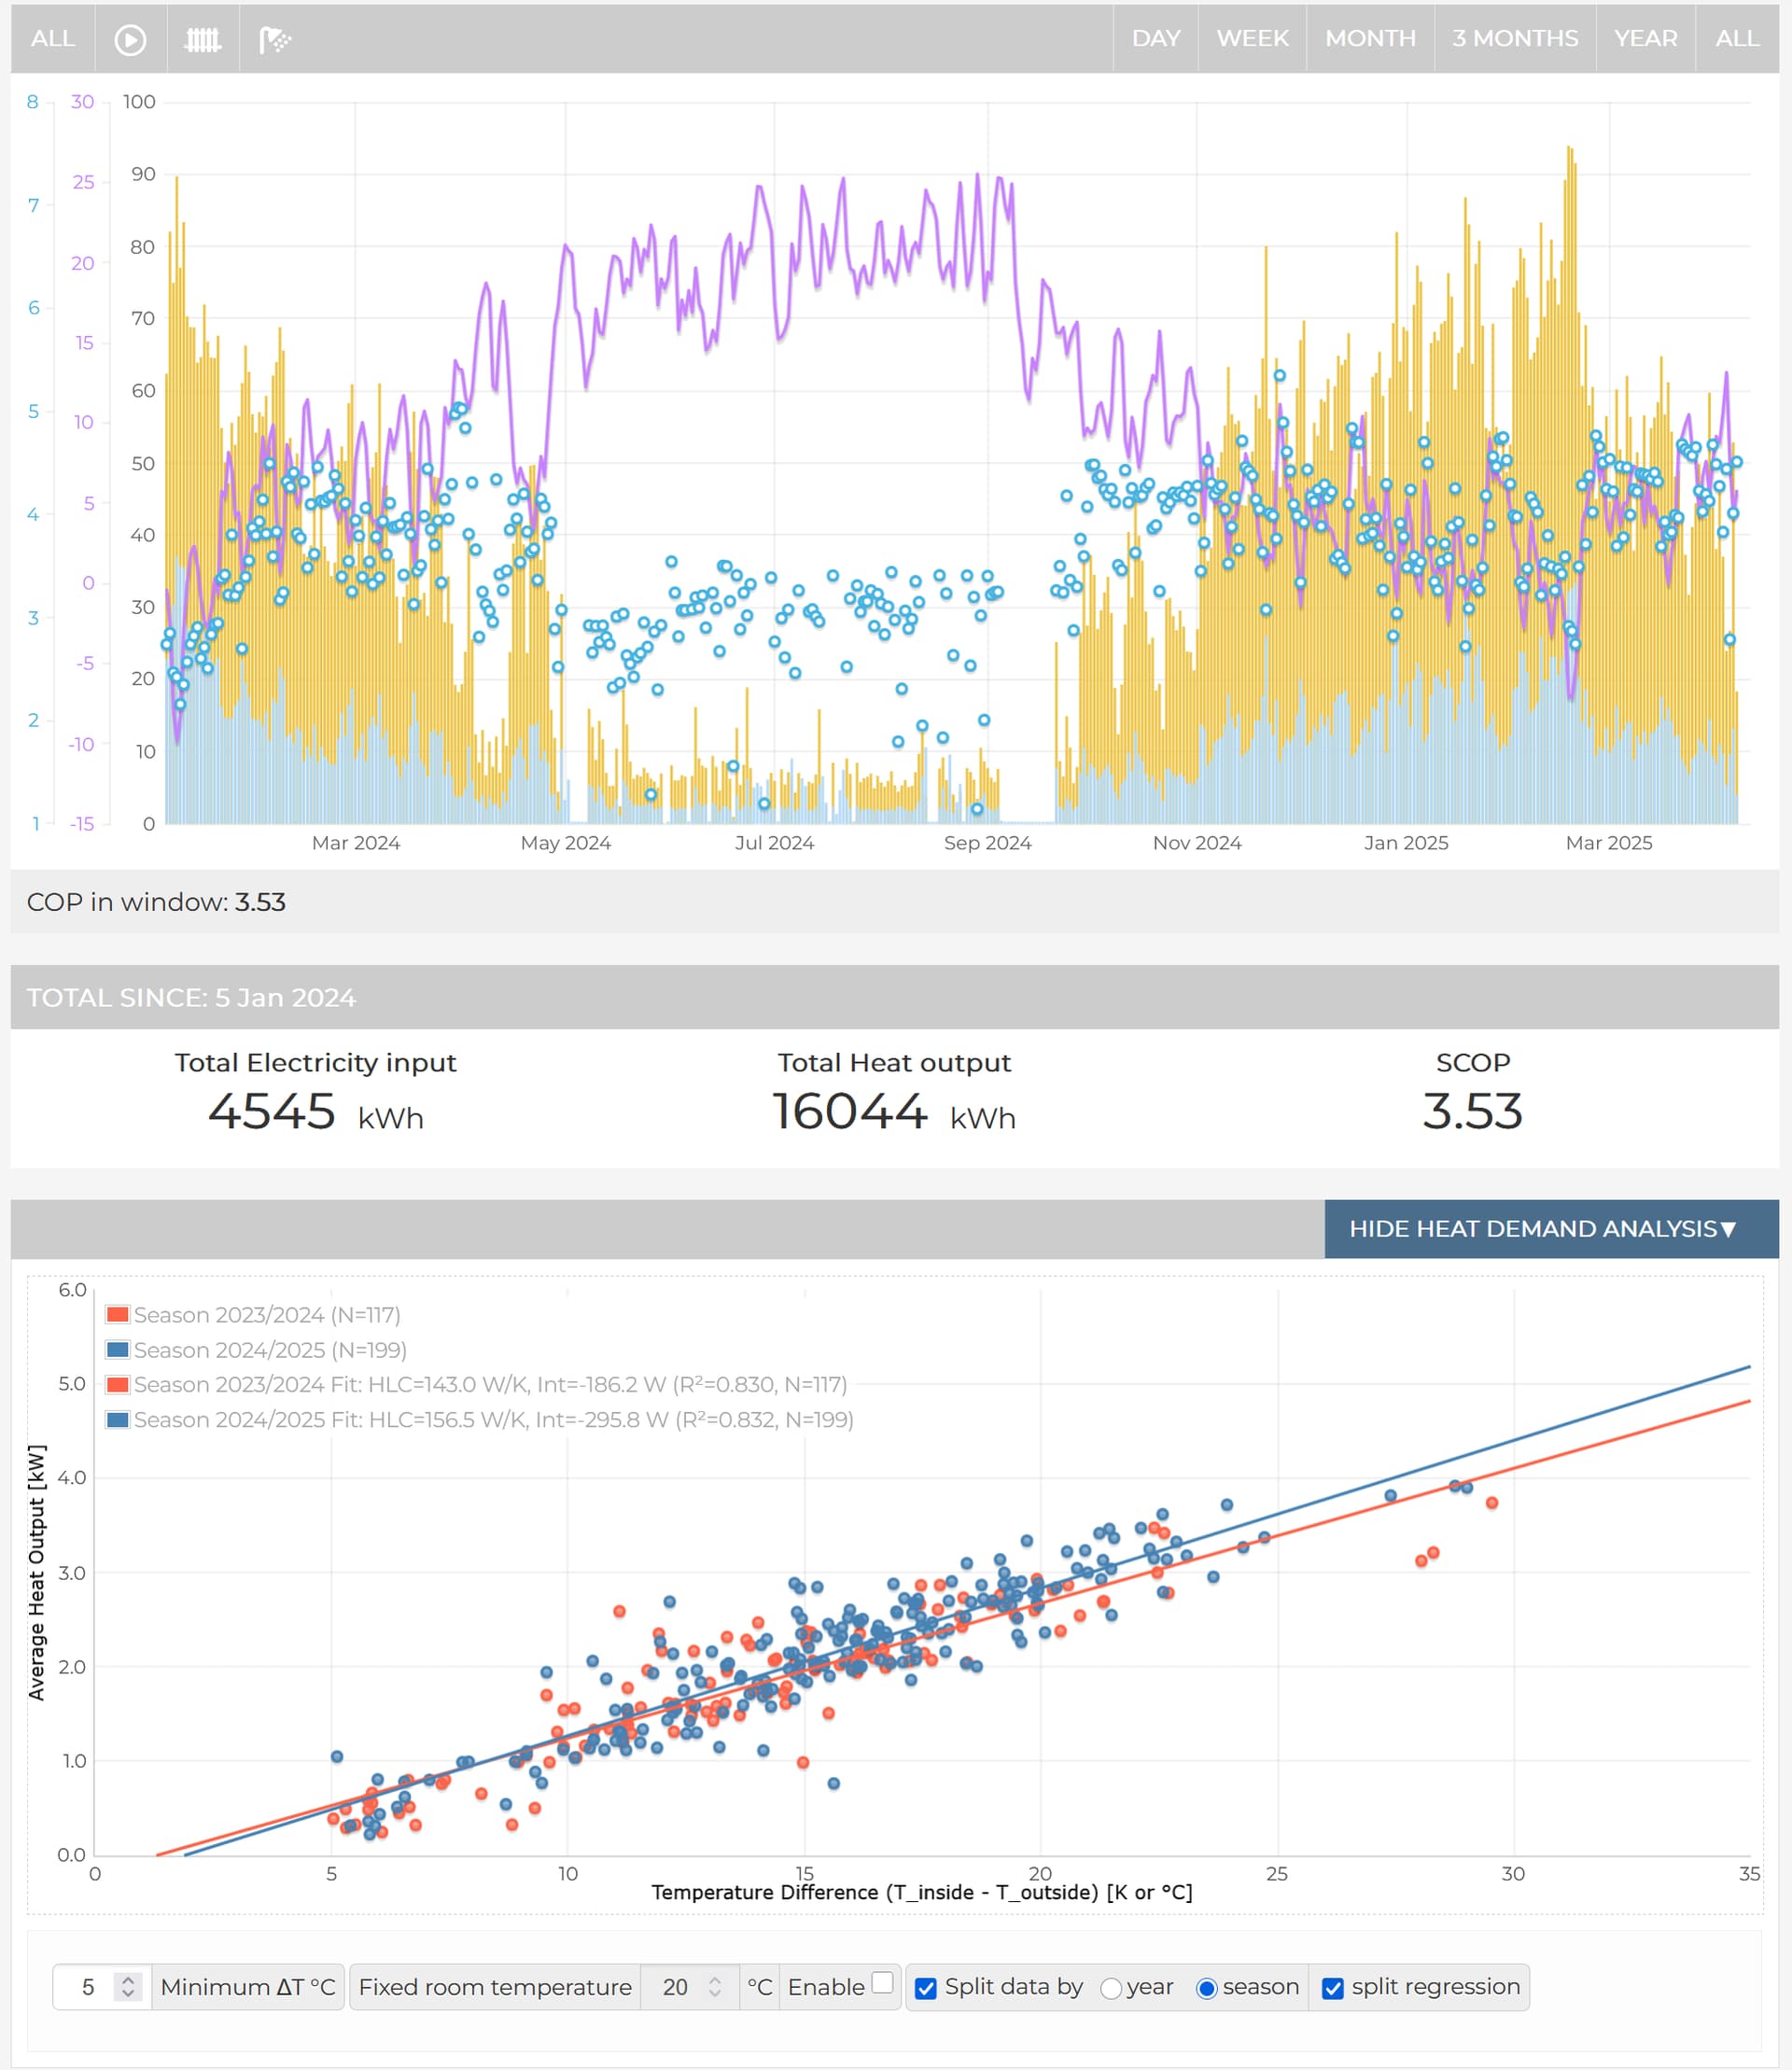
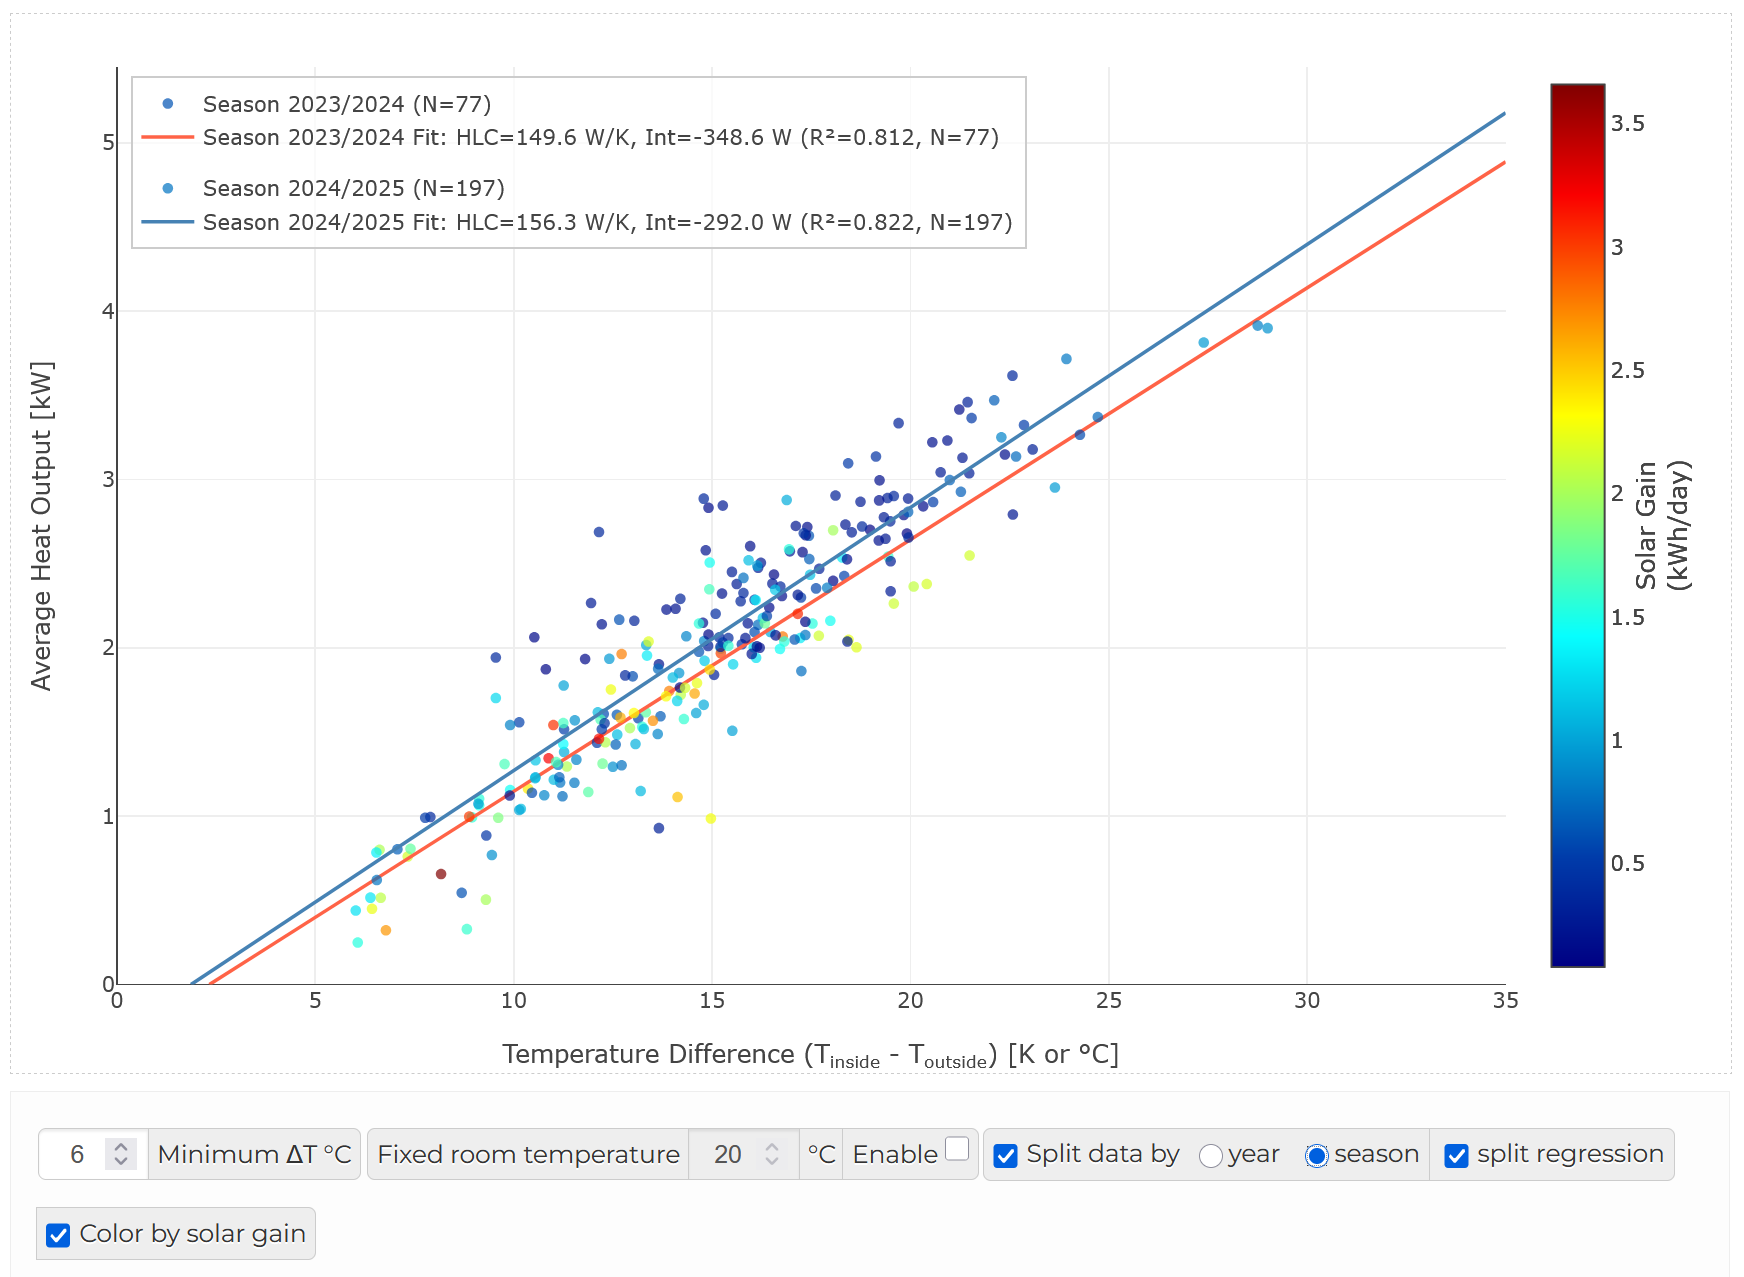
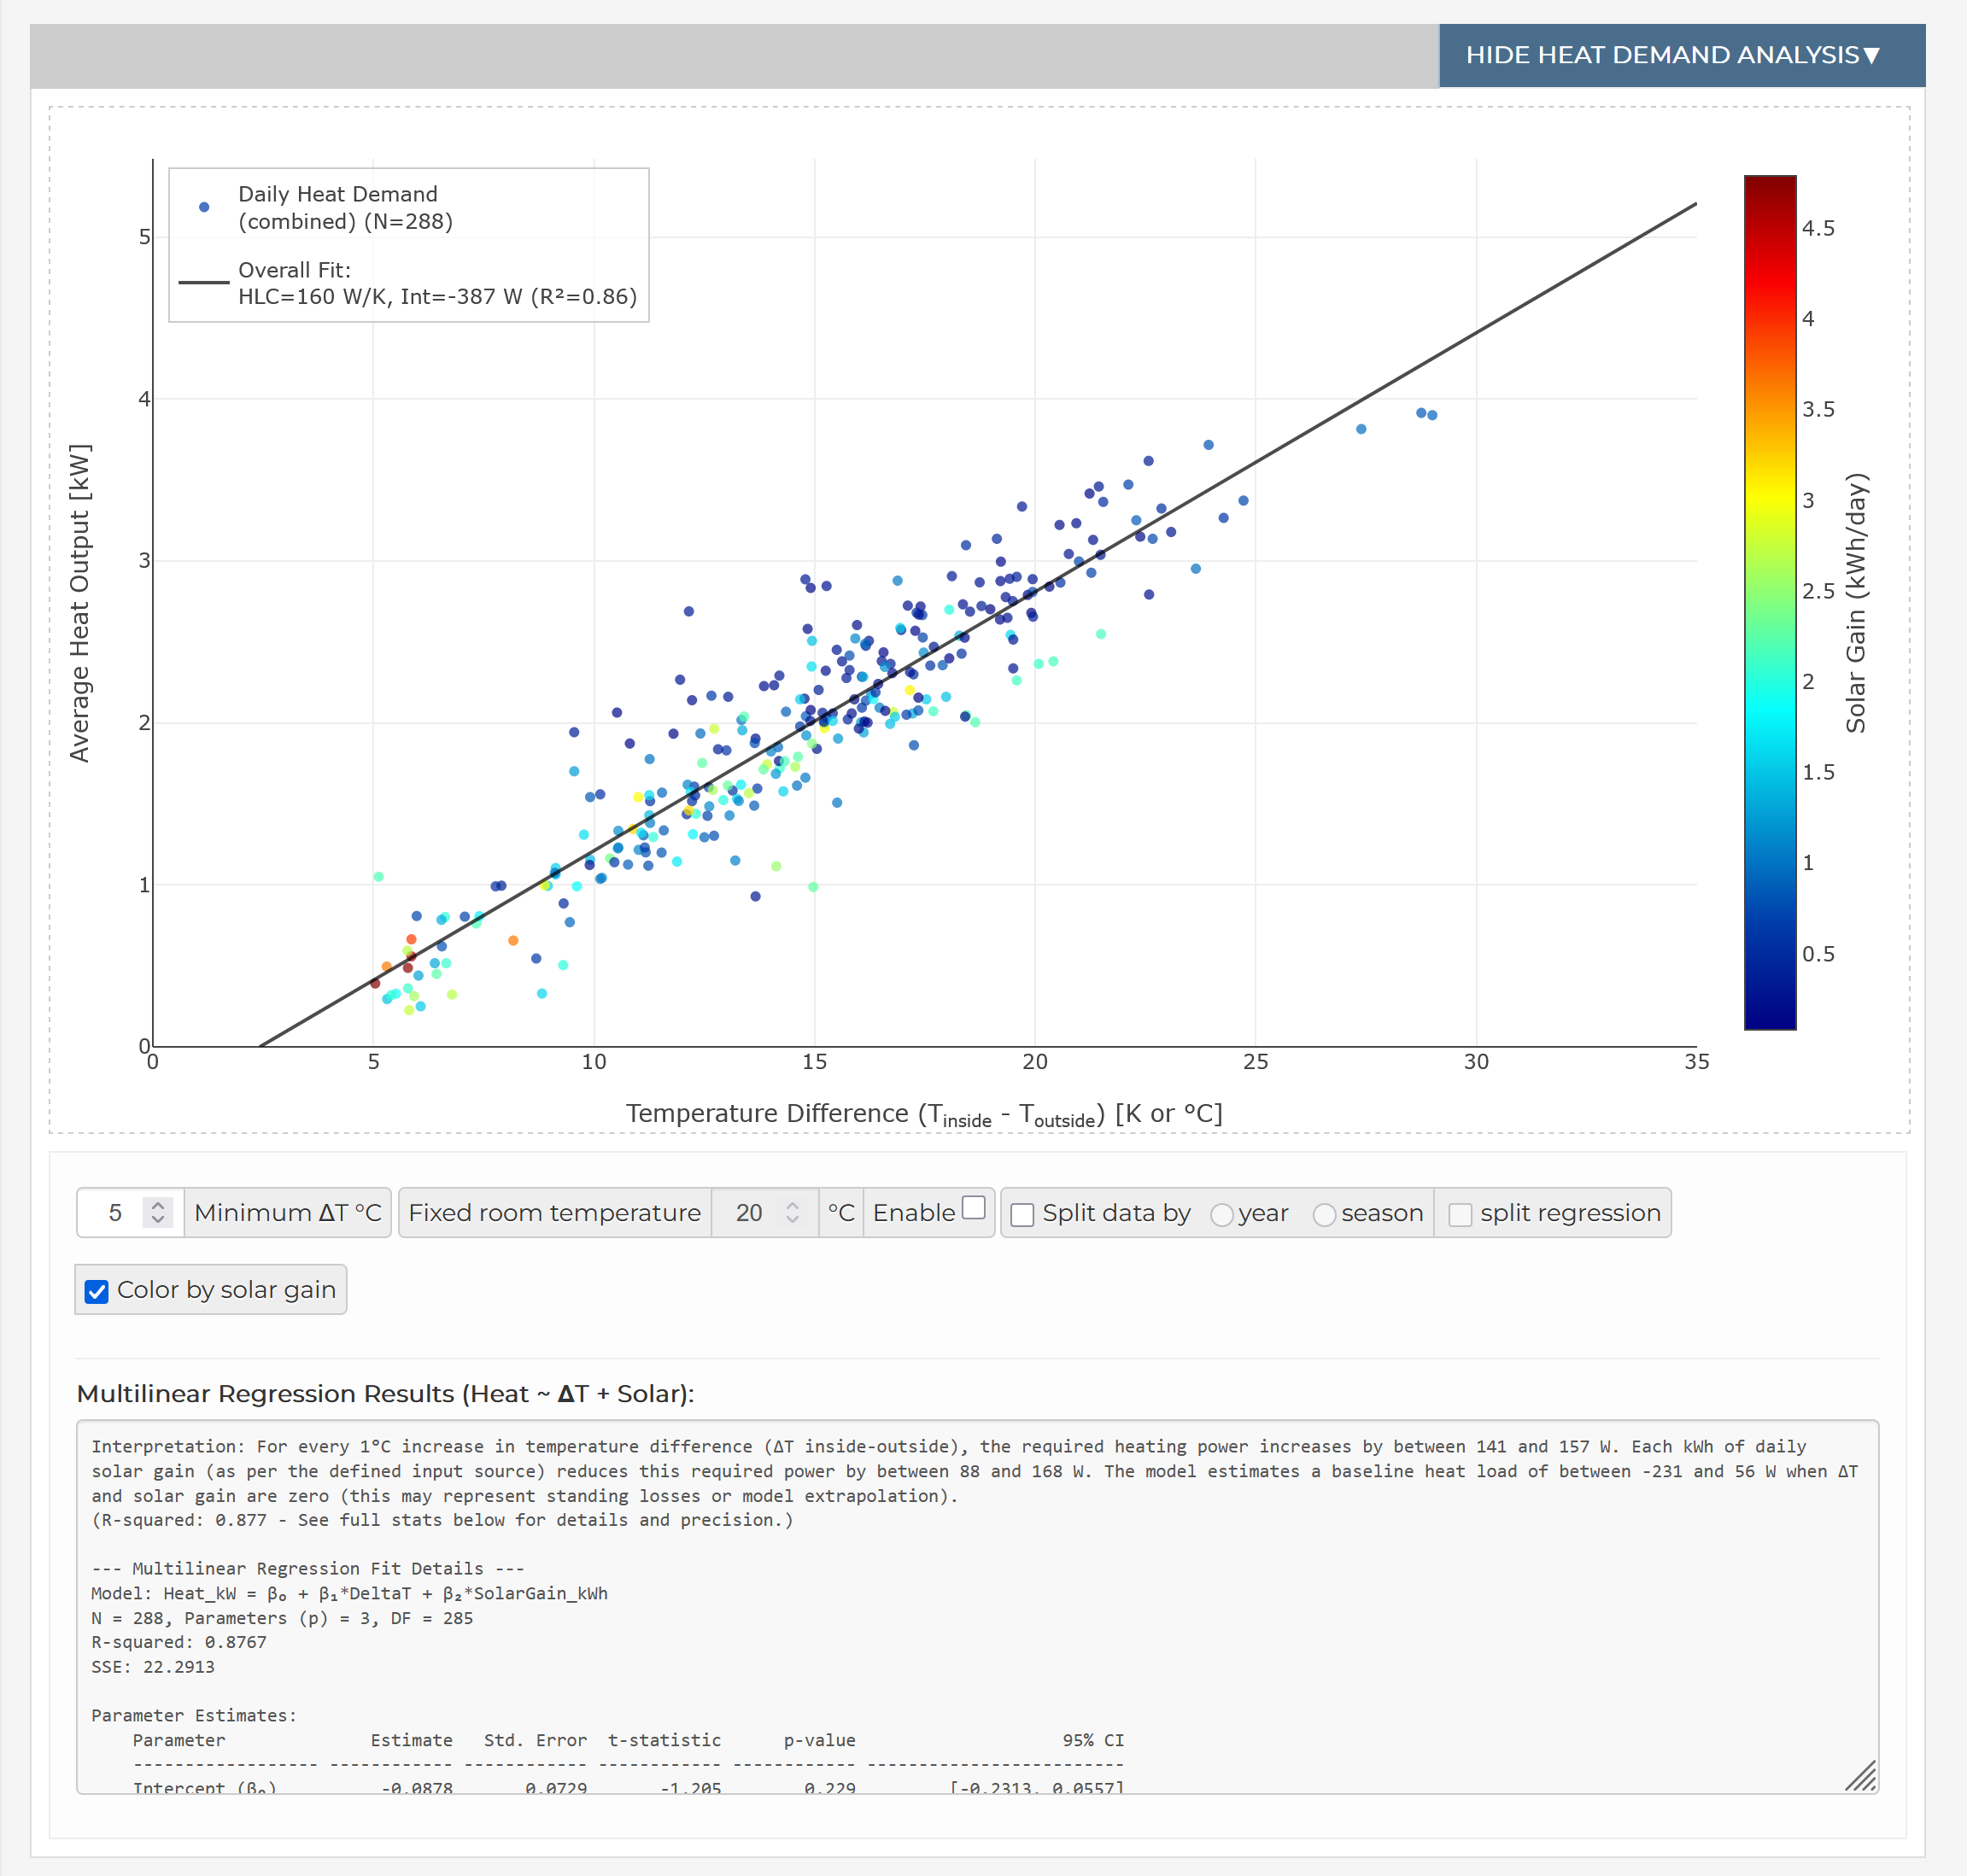
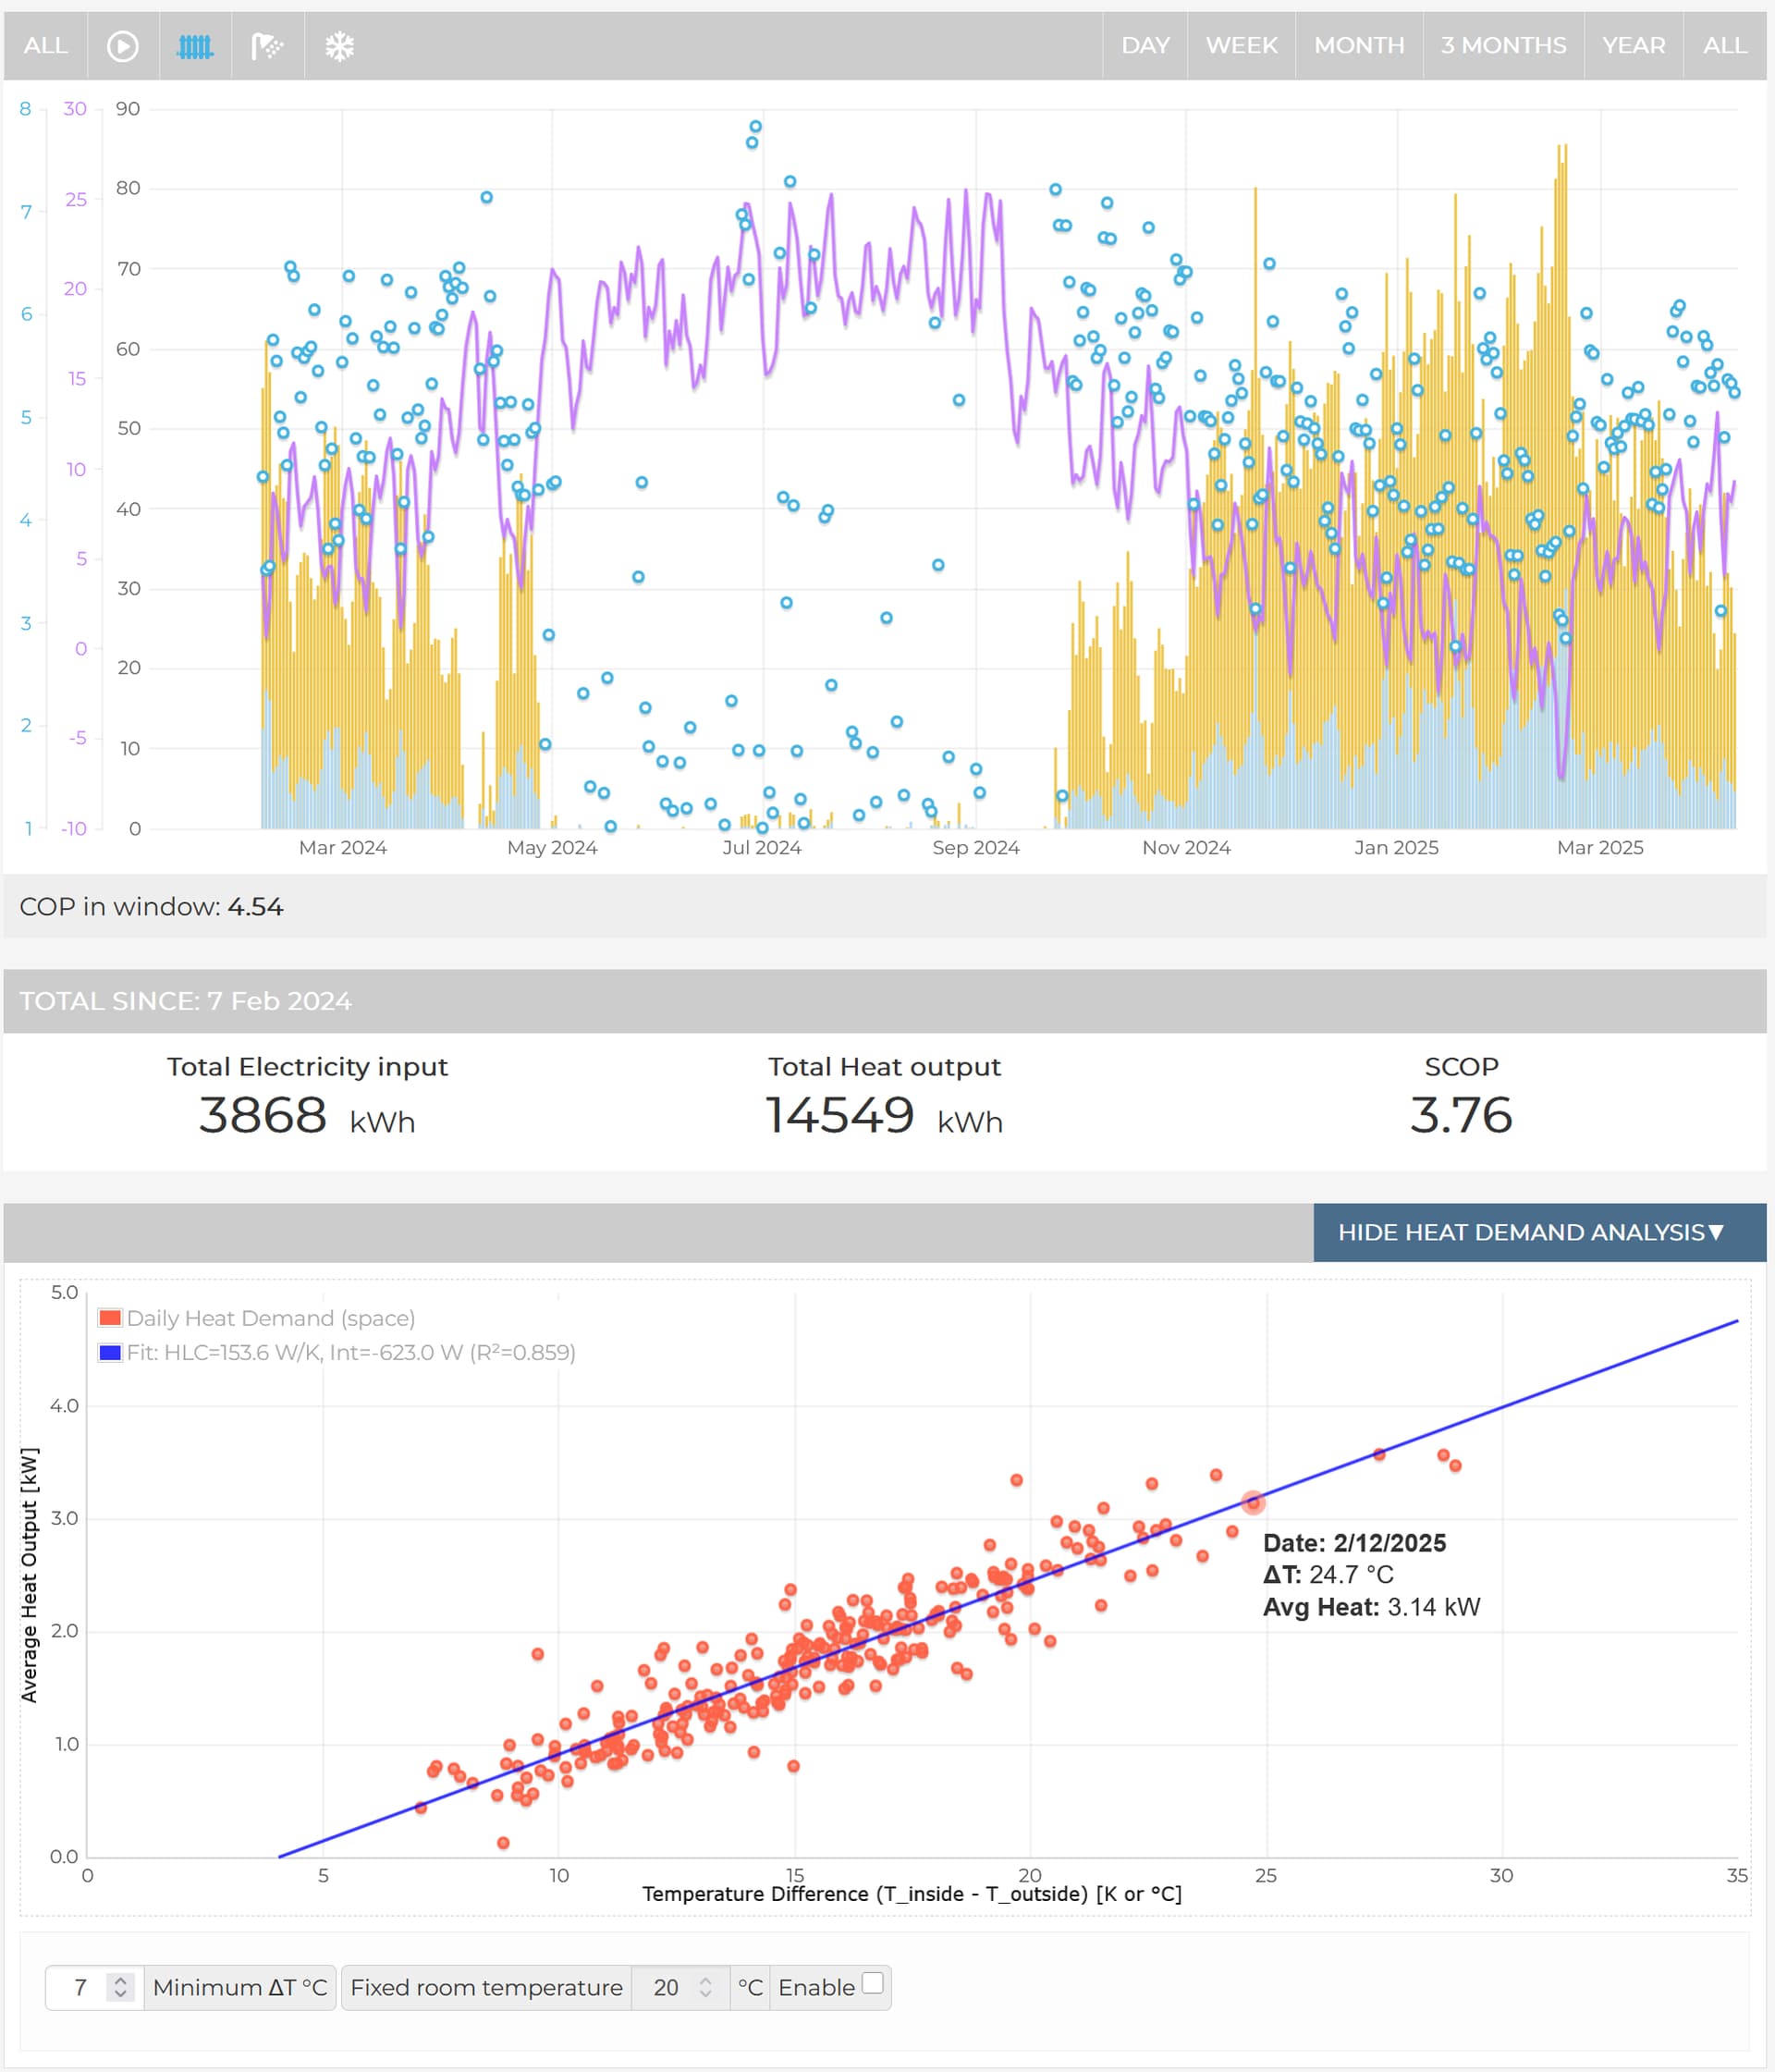
We’ve got a really great heat demand tool at heatpumpmonitor.org, but I’ve always wanted something similar running locally. I have built a small addon to the bargraph view that does a heat demand plot & regression analysis based on the data window shown - if you select only the last 3 months, this data will be plotted and a regression analysis performed. Similarly, if you select space heating, only the heat for space heating will be used for the analysis.

It’s not finished yet, but I’d love to see it become part of the official app and wanted to gather feedback early on. It’s in the heat-loss-view branch of my emoncms app fork if anyone wants to try it out.

A big shoutout to @alexandrecuer who was extremely helpful in getting my local development environment set up!

Here’s how to get it installed on your local emonpi for testing. I’m typically merging changes into the dev branch that I use productively on my local emoncms setup for my heat pump.

Note that this version currently fetches plotly, mathjs and jstat from a CDN. It hence does not work when you’re completely offline. This will be fixed as soon as dependencies are stable and we decide where those reside within the emoncms folder structure.

SSH into your emonpi and clone the repo into /opt/emoncms/modules:

cd /opt/emoncms/modules
mkdir app
git clone https://github.com/andrekuehne/emoncms_app app/
cd app
git checkout --track origin/dev

Backup the original app directory and link the cloned repo from /opt to the expected location:

cd /var/www/emoncms/Modules
mv app/ app_backup/
ln -s /opt/emoncms/modules/app/ ./app

In the Admin / Components view of the emoncms web interface, you will now see the App module pointing to my repo (the dev branch):

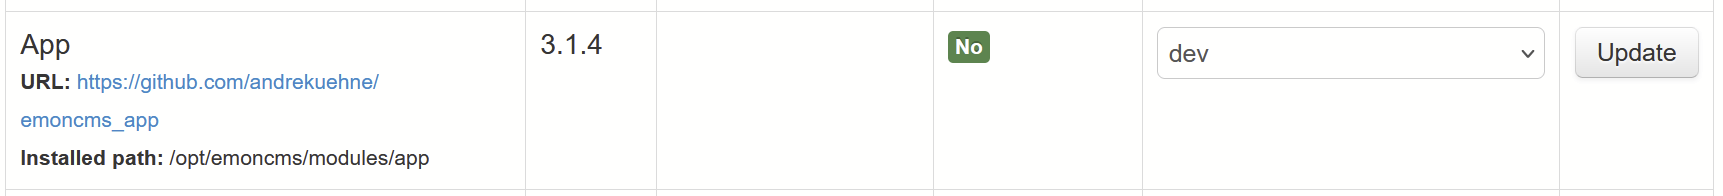
Updates work as expected. You can also switch to master or stable, I haven’t touched them.

There will be an additional entry in the component view for the app backup, you can ignore this.

If you want to include solar data, you will need to add the respective column to the daily stats database:

mysql -h localhost -u emoncms -p emoncms

Login with the password (default is “emonpiemoncmsmysql2016”)

Add the db column to the daily_stats database:

ALTER TABLE myheatpump_daily_stats ADD COLUMN combined_solar_kwh FLOAT NULL;
exit;

You will have to define a valid feed for accumulated solar energy in kWh in the app config and click the button to reload daily data.

5 Likes

This looks awesome Andre

Here’s my little wish for the Heat Demand Tool

Some way of colour coding the data points by year (or by winter season).

Reason: i’ve now got 3 winters of data in mine, but i’ve made fabric / radiator changes between heating seasons. So i’d love to see the plots of each heating season in different colours, to track progress.

If that makes sense?

I raised this as a item in git a while ago. :smiley:

1 Like

Amazing, yes please! This has been on my wish list /must develop list too, so thank you for taking the initiative!

2 Likes

That’s an excellent idea. What do you think about this? Splitting by season just cuts the year in the middle. The optionally split regression should help seeing whether your fabric improvements did their job. It’s already pushed to GitHub.

@TrystanLea Glad you like it! I’m really happy to contribute to this great project.

One thing I want to add is the ability to utilize solar gain and wind data to explore these dimensions and let people see what the impact of these two - probably most important besides temperature - environmental factors are. This requires that the daily processing be run on appropriate feeds, and if I understand correctly, this requires the database to be updated. How would I best go about doing this in a way that’s compatible with your approach?

1 Like

That sounds perfect!!

What are everyones’ thoughts on migrating plots to plotly.js? You can make such nice plots so easily with it. :slight_smile:

1 Like

I think I’m more or less done with a version I’m happy with. Features:

  • Performs simple linear regression on heat demand vs \Delta T
  • Splitting by year or season
  • linked to window of bar graph plot

I also have implemented the inclusion of solar gain. In an optional feed, you can supply a proxy for solar gain as generated solar energy in kWh. This can come either from you locally (roof PV setup), or you could create it via other data sources on current solar irradiation and integrate it. The latter would be preferable as it would allow different houses to be compared.

On one side, this data is used to color the scatter points with the solar gain of that day. This way it’s nicely visible that days with solar gain typically end up below the regression line and days without end up above.

On the other side, I’m performing an actual 2D regression to fit heat demand to both \Delta T and solar gain. While tough to visualize, I show all the nerdy stats and - more importantly I think - a comprehensible summary sentence, which for my house currently reads:

Interpretation: For every 1°C increase in temperature difference (ΔT inside-outside), the required heating power increases by between 141 and 157 W. Each kWh of daily solar gain (as per the defined input source) reduces this required power by between 88 and 168 W. The model estimates a baseline heat load of between -231 and 56 W when ΔT and solar gain are zero (this may represent standing losses or model extrapolation).
(R-squared: 0.877 - See full stats below for details and precision.)

My local Ecowitt weather station measures solar irradiation in W/m² and is very close to the official measurements at a closeby official weather station. The accumulated energy I’m using is hence kWh/m² of actual solar irradiation, not usable PV energy.

I am using plotly, mathjs and jstat as external libraries. I’m currently loading them from a cdn but of course they could reside locally on the emonsd.

The latest branch can be found here.. I’d be happy about any feedback!

2 Likes

Would be cool to see this on the web version of EmonCMS.

I’ve also got an Ecowitt, so if it does make it onto web, I’d love to hear how you integrate it. I have the readings in Home Assistant and already send internal temps from HA to Emon, so assume it should be quite easy to get the data in there.

I’ve noticed in the last couple of weeks that solar gain is having quite an impact on my heat demand, more than I realised. My SCOP is likely to be lower than I thought, because even when its 10C outside - and heating should be on - the solar gain it knocking the ASHP off so not getting any increases in SCOP from it when it would be nice and high :face_with_peeking_eye:

1 Like

This is obviously not my decision, but since all this is done locally in your browser I don’t see why this couldn’t be done. The only required change on the host is that an additional column is needed in the daily stats MariaDB table.

Since this is really getting into taking more environmental data into account, I’m also looking into adding wind and internal/external humidity data into account. This could then be leveraged to also extract ventilation losses, including the impact of latent heat. (Edit: Latent heat impact should be basically none here)

I’ve seen a highly significant influence of solar gain in my data, so I looked into reliable data sources to get comparable data for arbitrary locations. It seems the Climate Data Store (https://cds.climate.copernicus.eu/) has exactly what’s needed. When registered for a free account, you can use the API to download historical data for arbitrary locations. I did just that for my home location. The absolute numbers (in kWh/day) are significantly higher on the official source, but they include both direct and diffuse solar radiation whereas my data comes from a simple PV cell integrated into the Ecowitt weather station I use. Both results are highly comparable, apart from the magnitude of the solar term due to the different registered energy.

Using my Ecowitt data:

--- Multilinear Regression Fit Details ---
Model: Heat_kW = β₀ + β₁*DeltaT + β₂*SolarGain_kWh
N = 274, Parameters (p) = 3, DF = 271
R-squared: 0.9013
SSE: 12.6461

Parameter Estimates:
    Parameter              Estimate   Std. Error  t-statistic      p-value                    95% CI
    ------------------ ------------ ------------ ------------ ------------ -------------------------
    Intercept (β₀)          -0.3377       0.0589       -5.736       <0.001        [-0.4536, -0.2218]
    DeltaT (β₁)              0.1441       0.0033       43.876       <0.001          [0.1376, 0.1505]
    SolarGain (β₂)          -0.1416       0.0177       -8.005       <0.001        [-0.1764, -0.1067]
------------------------------------------------------------------------------------------

Using CDS era5-single-levels data:

--- Multilinear Regression Fit Details ---
Model: Heat_kW = β₀ + β₁*DeltaT + β₂*SolarGain_kWh
N = 272, Parameters (p) = 3, DF = 269
R-squared: 0.9028
SSE: 12.1933

Parameter Estimates:
    Parameter              Estimate   Std. Error  t-statistic      p-value                    95% CI
    ------------------ ------------ ------------ ------------ ------------ -------------------------
    Intercept (β₀)          -0.3552       0.0560       -6.346       <0.001        [-0.4654, -0.2450]
    DeltaT (β₁)              0.1459       0.0032       46.203       <0.001          [0.1397, 0.1521]
    SolarGain (β₂)          -0.0767       0.0094       -8.184       <0.001        [-0.0951, -0.0582]
------------------------------------------------------------------------------------------

The data from the CDS are a bit delayed so a few days are missing but overall the fit quality using truly local data or the CDS data is indistinguishable. I think it would be great to have this functionality within the app and also on myheatpumpmonitor.org as it would allow factoring out solar gain using ground truth measurement data that is comparable between different locations. I’m happy to contribute to a module loading and storing this data (I have it in Python for now). What do you think @TrystanLea?

1 Like

I have an Ecowitt too :grin: Mine uses a GW2000 gateway, and I just import the data straight from that to my emoncms system, using a little python program called ecowitt2mqtt that’s on github. No need for HA. I believe it works with other gateways etc.

1 Like

+1 for ecowitt2mqtt. Running it in docker as HA addon.

For anyone wanting to test this out, I have now added a howto to the first post of this thread.

1 Like