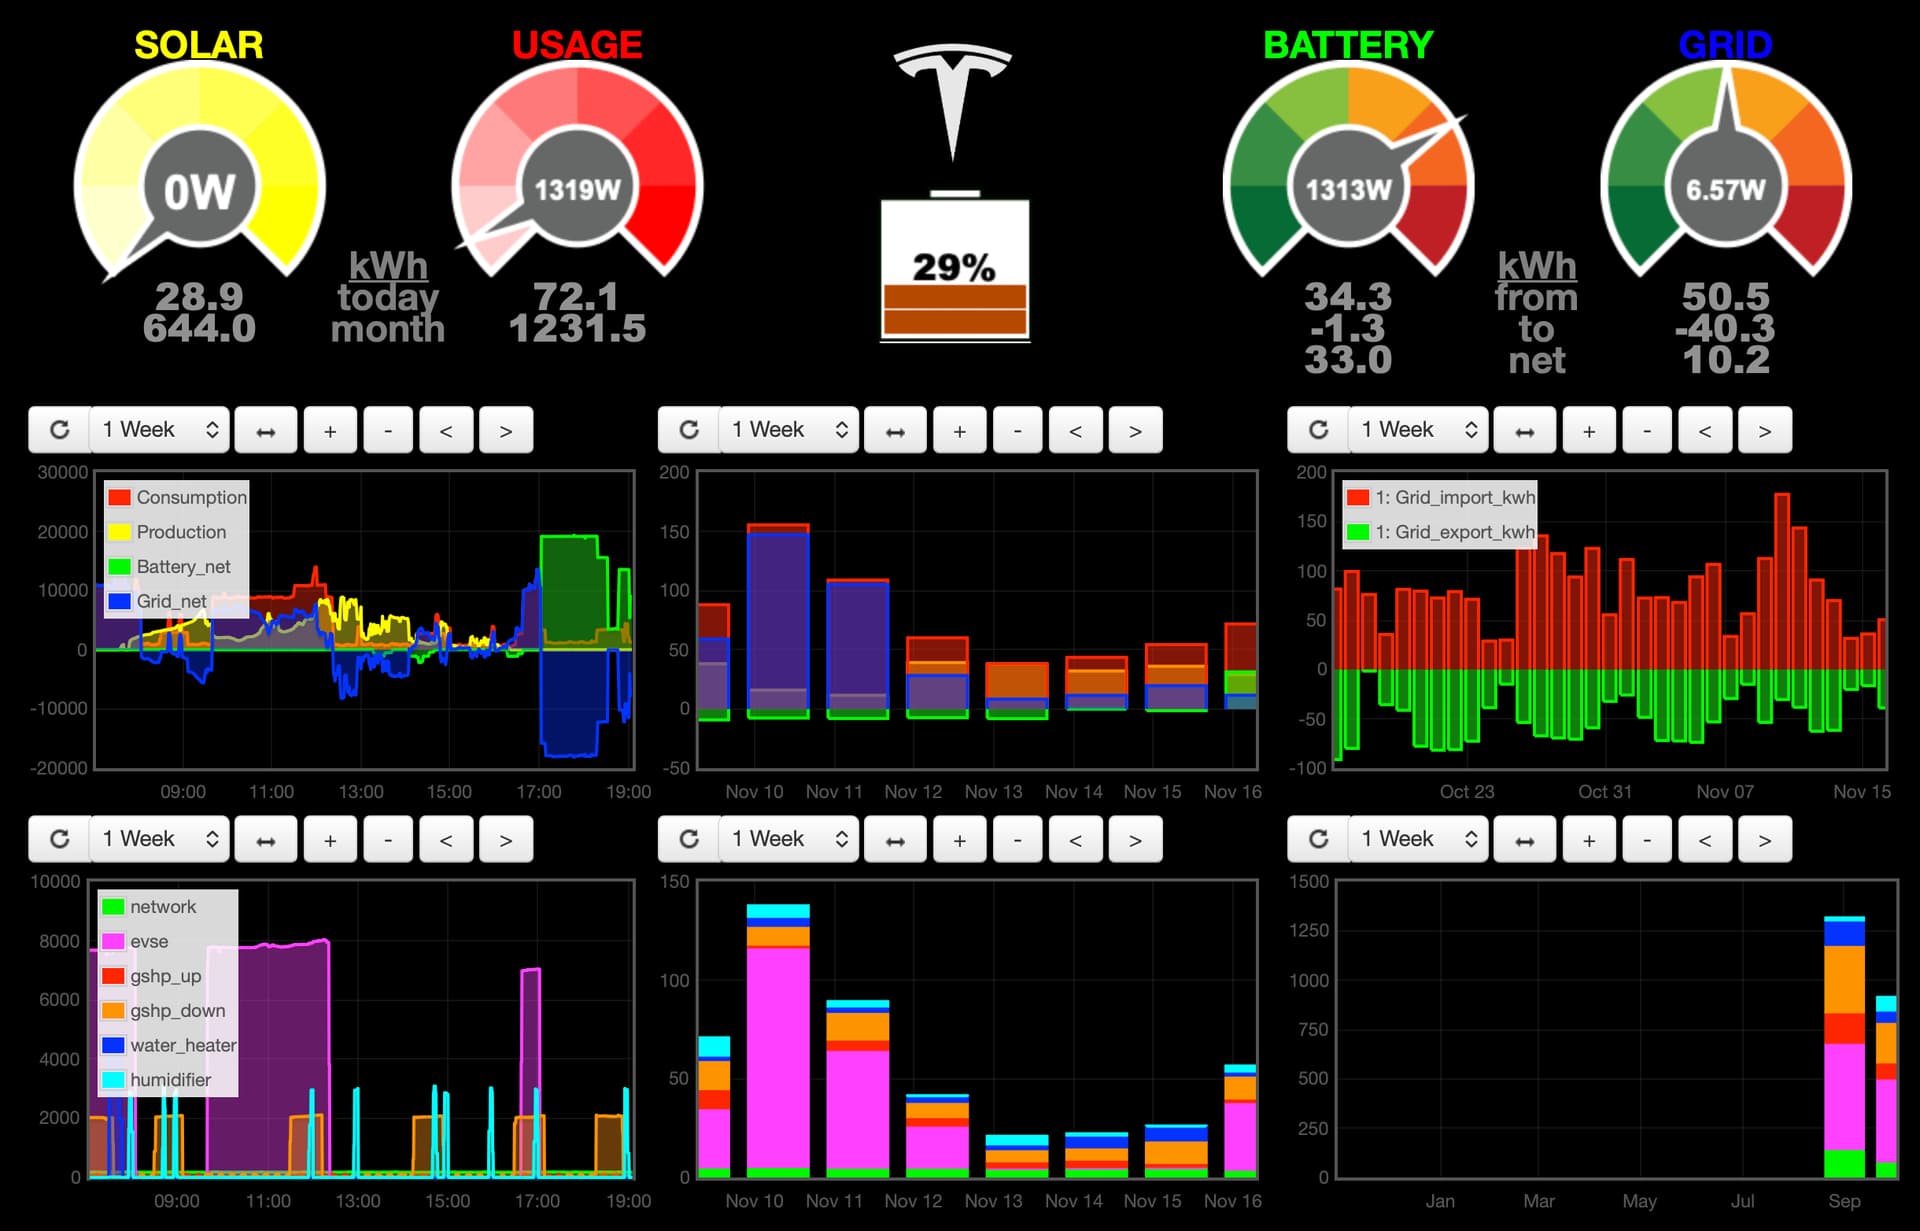
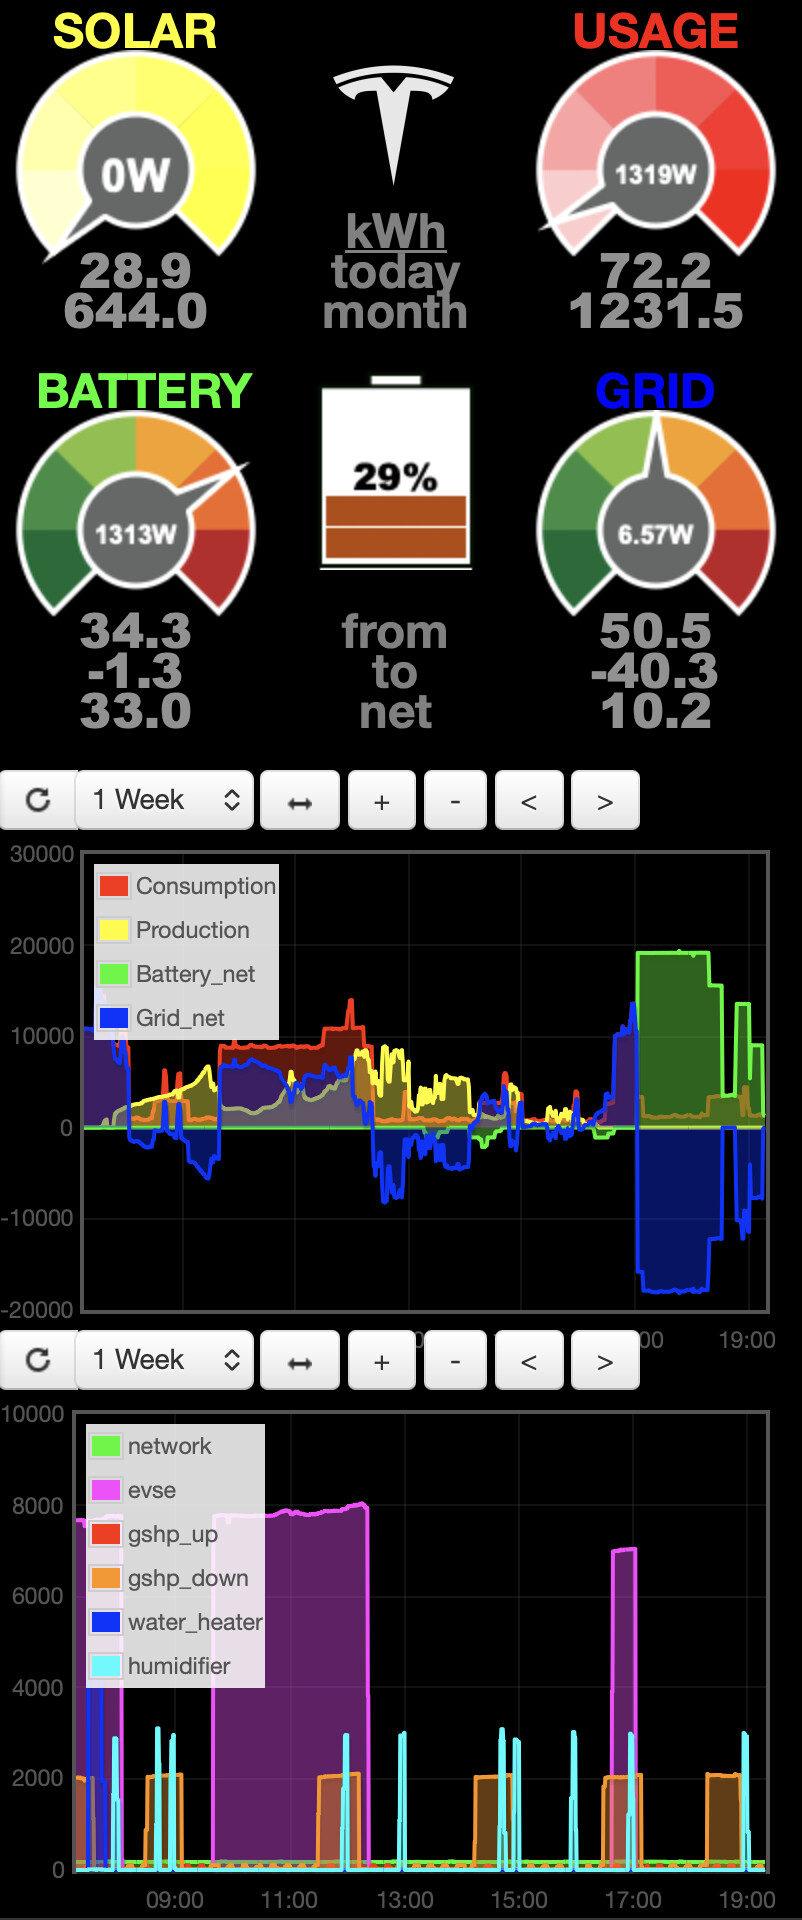
Not sure if anyone else is still using emoncms but attached is my Dashboard for Desktop (displays well on tablet and up) and Mobile (displays well on mobile). I wanted as information dense as possible. Dials above are fairly self explanatory, monitoring Solar production, Usage (consumption), Battery and Grid. Graphs are arranged with Macro on top and Micro (ie individual high wattage circuits as indicated) below. From left to right is hourly, daily, and monthly power/energy data. System is solar/battery with TOU billing and system configuration for maximal battery export during peak billing period. Would love to get rid of the headers on each graph (I never use them) if anyone knows how to do that in the Dashboard Editor.
1 Like