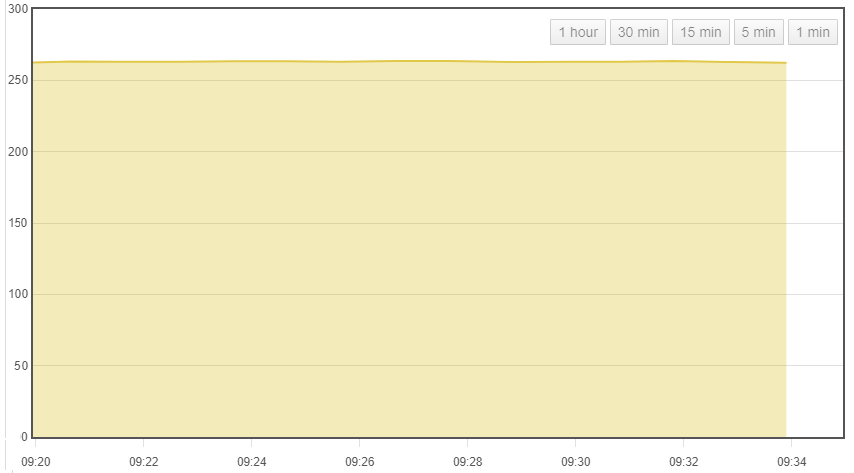
I need to be able to see small temperature changes happening in real time. The Extra->Visualizations graph in emoncms gives a nice real-time view of the temperature, but its fixed vertical axis means that changes have to be big before you can see them.
In the picture below, all the yellow space below the 250 level conveys no information at all. It would be wonderful to be able to set the minimum value on the Y axis, or to set the vertical zoom level, or to have automatic zoom that ensure that the highest value is somewhere in the top 1/4 of the graph and the lowest value is in the bottom quarter.
.
I don’t have the knowledge to make these changes, but I am hoping that some smarter person would consider this a worthwhile improvement to add to the code.
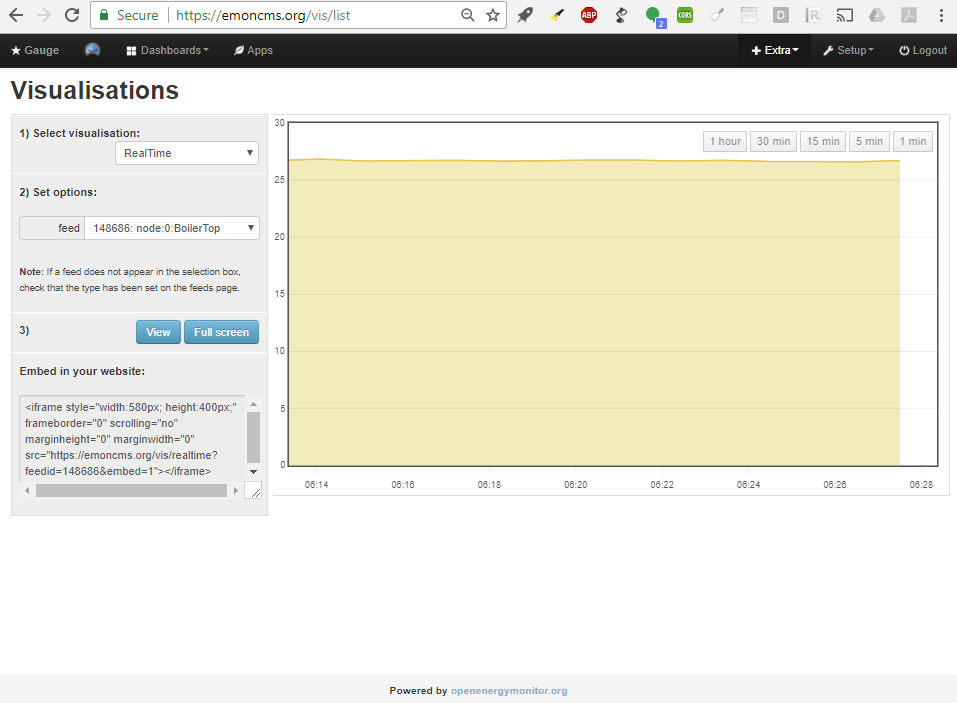
I think you can. Under the graph where the time and interval are displayed, there are inputs for Y-axis min and max. They default to auto, but you can set a value and hit Reload. If you get what you want, you can save that graph with those min and max parameters.
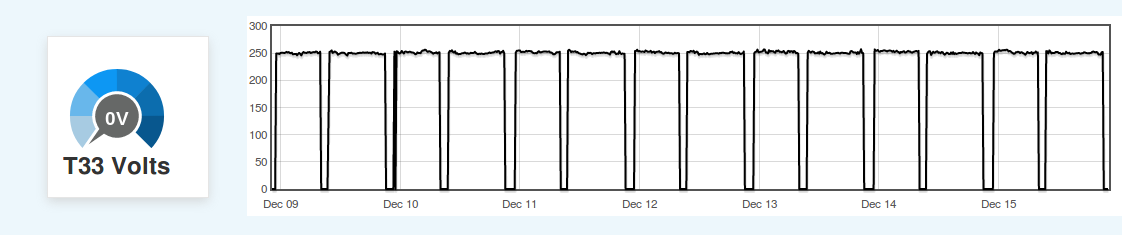
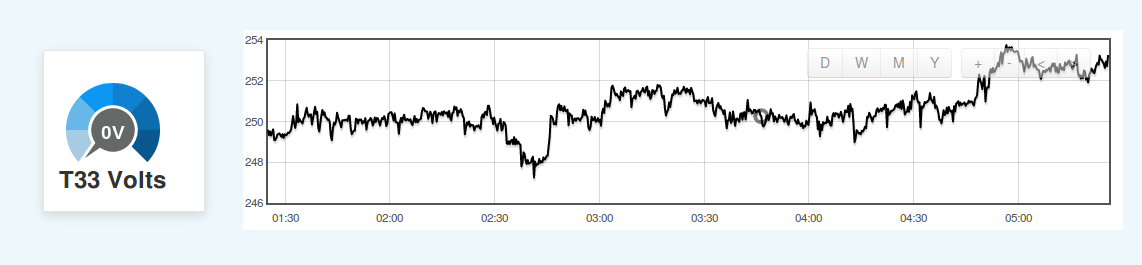
I tend to use the “rawdata” visualisation rather than “realtime”. It does have auto-scaling of the y-axis to match the dynamic range of the data being displayed. Here’s how it looks before I zoom:
Thanks dBC
Yes I use that too, but it has some disadvantages compared to the visualisation that I want to use:
It takes a bit of fiddling (especially on a phone) to see the last 5 minutes (which is the time span of interest).
It does not refresh automatically when new readings arrive.
.
The reading are the temperatures every minute of a boiler that must be heated at a predetermined slow rate. The operator needs a few minutes of history to check that he is firing the boiler at the correct rate.