I have two inputs + log feeds which provide me the power from my Dutch Smart Meter
There are two feeds used to measure: T1 (low, night/weekend, tariff, ) and T2 (normal tariff).
In emoncms I want to determine my total power usage per day.
This can be done by defining mutliple processes in the input feed process list setup.
In this way I created a seperate feed from the inputs which is the sum of T1 + T2 totals on a daily basis.
Lets call this feed ‘dailyPowerUsePlus’.
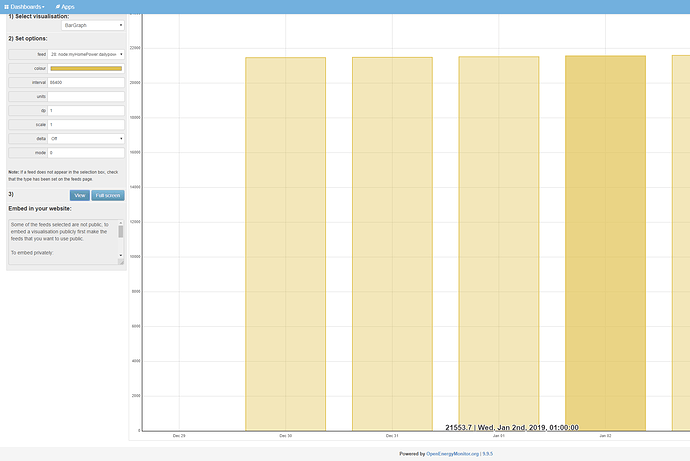
If in a visualisation a bargraph is created based on the dailyPowerUsePlus feed totals of T1+T2 per day are shown per day.
Emoncms defines on the X-axis a day layout with date (without time).
But if I hover on the bars the bar values (Y-axis values) are show including the date + time. For each day the time is set to 1:00AM when hovering.
(‘Jan 1’ has total of 21505.1 and ‘Jan 2’ has total of 21553.7)
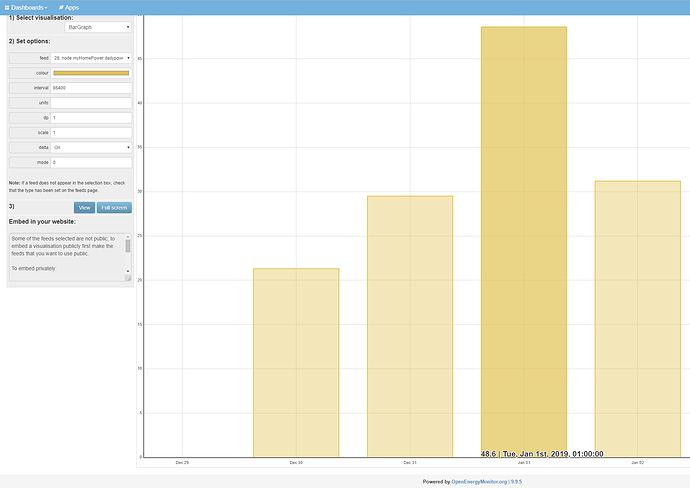
If I set ‘delta’ = ‘On’ in the visualisation the delta total value is shifted to the wrong day.
(in the image the ‘Jan 1’ delta value of 48.6 actually is related to ‘Jan 2’)
I think the reason for this is the wrong time part of the ‘daily date’.
Since the feed is a daily feed (update daily in setup) the visualisation shows correctly only the dates on the X-axis. But my guess is that actually a date is stored including a time part which is set to 1:00AM. This is the beginning of that day and not the end of that day.
For example the update daily value related to ‘2 January’ is actually related to ‘2 January 1:00AM’.
I think that is why the delta function results in wrong behaviour. So the delta is shifted one day earlier.
Why is this delta function behaviour happening?
Do I something wrong?
Or is this a bug?
EDIT:
I also have another daily update feed from an other input which doesn’t has an extra ‘+ input’ process step.
This feed shows the bar values to the corresponding dates correctly. So not shifted one day.
So may be the issue is related to the process steps in the input.


