After the virtual feed be available, I define the add of two variables.
In the feeds I can see the sum of the feeds correct, but in the graphical mode, the value of the virtual feed sum is incorrect when I chose the daily graph scale.
It’s possible tho exist an error in graph processing or I have incorrects parameters in virtual feed ?
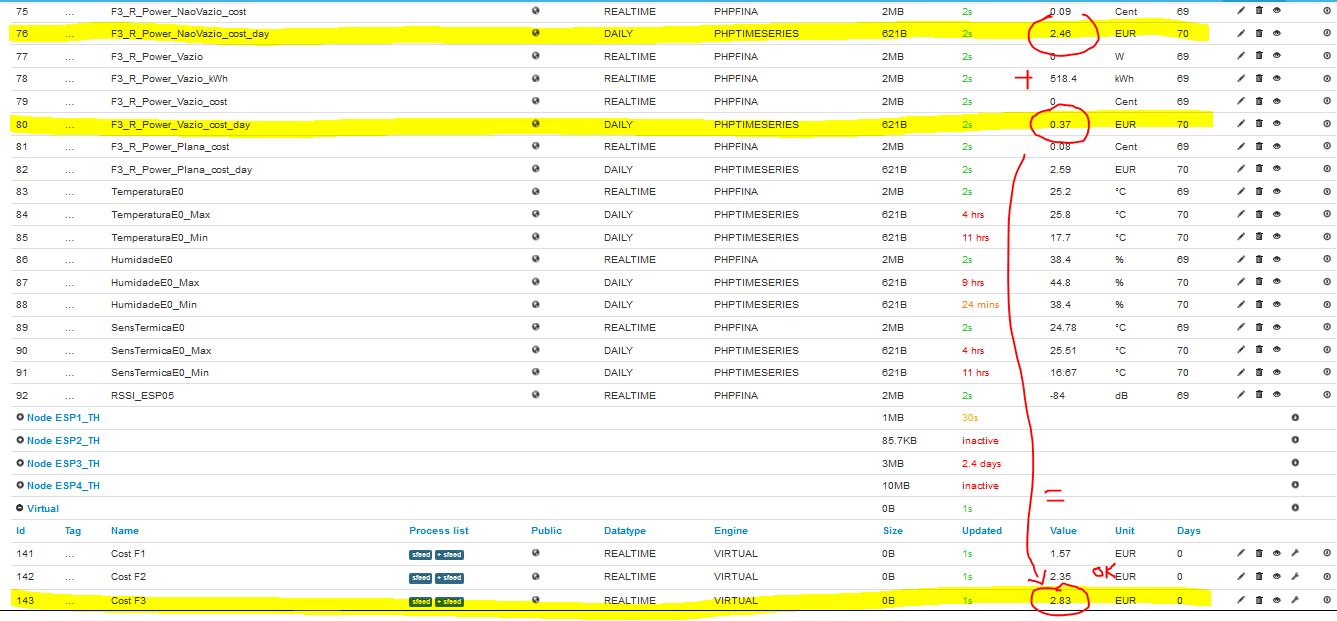
The following pictures show the variables used:
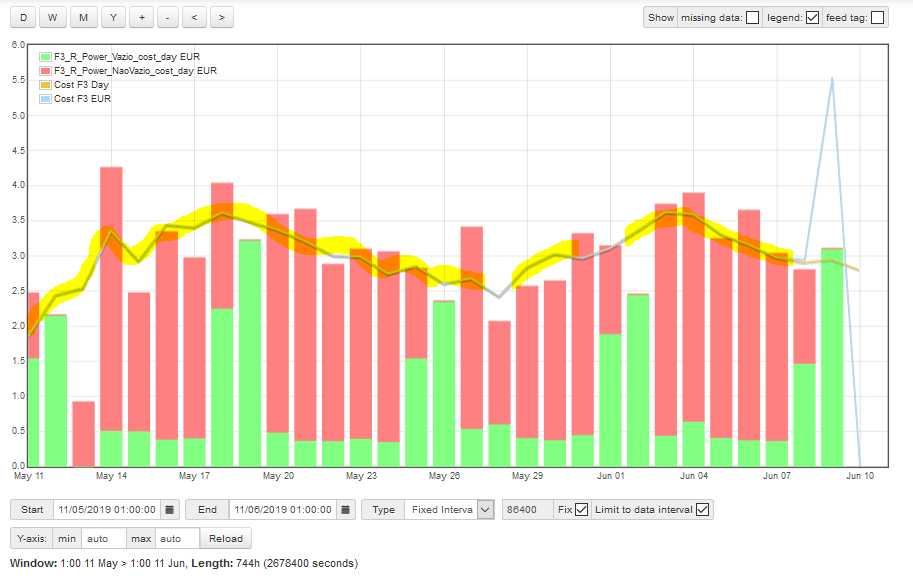
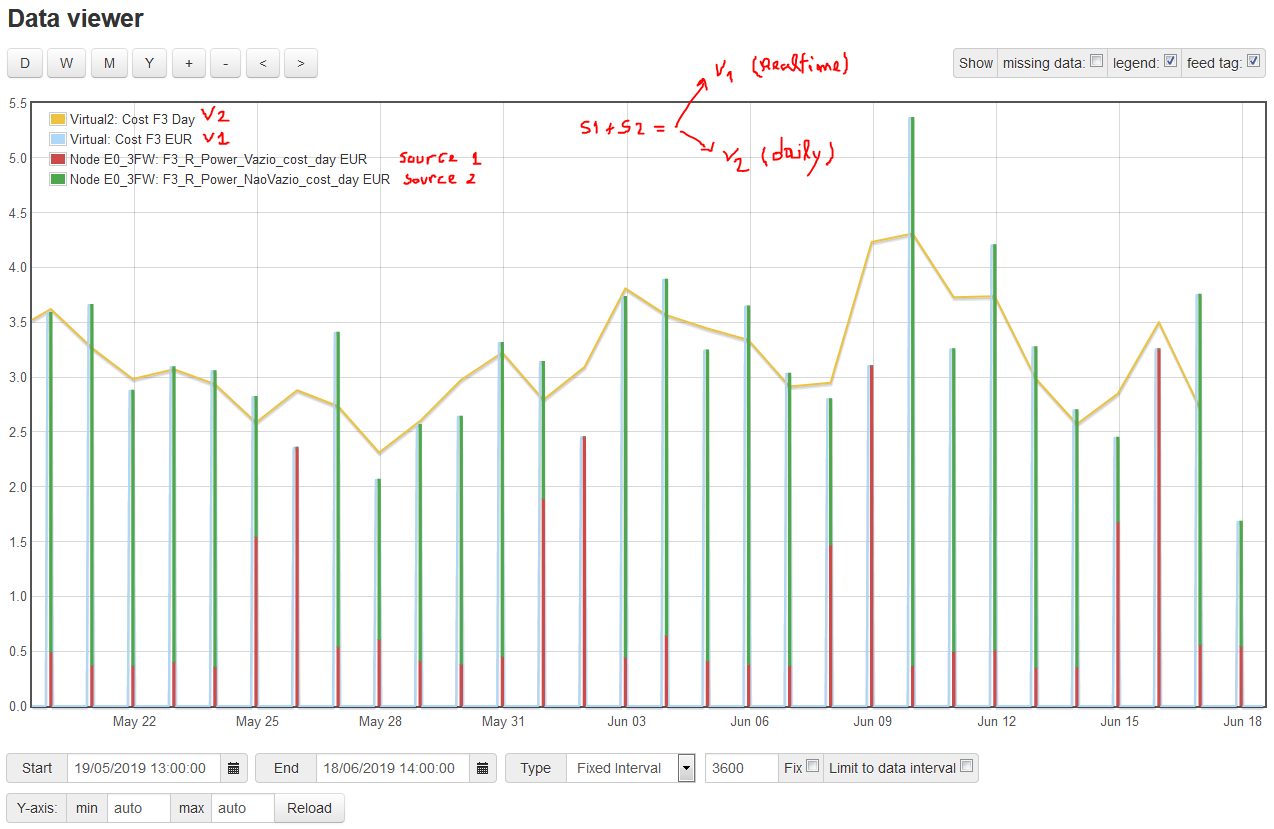
This graph represent the day cost of electricity based in multi-tariff. The stacked bars represent the cost of the two tarifs. The line is the sum of this two feeds. They are not identical!
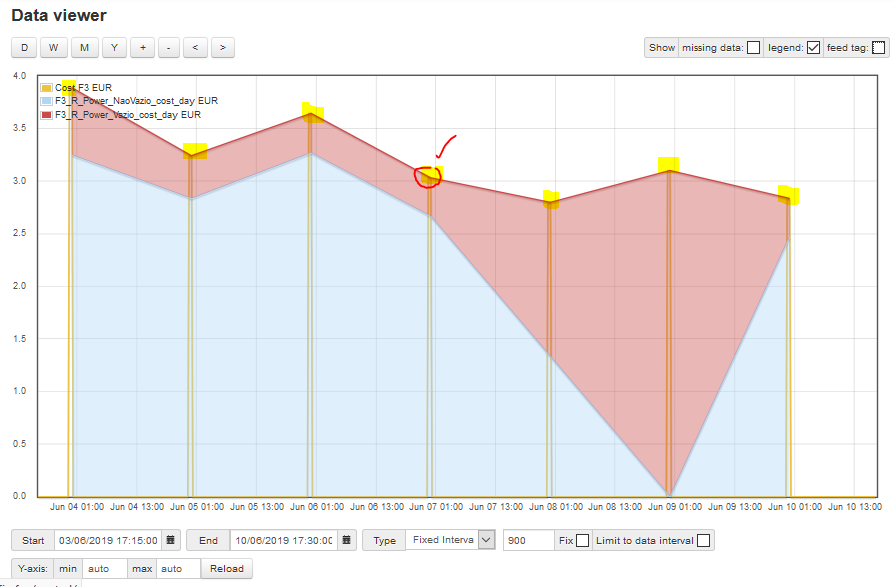
When use the graph interface without select daily scale, the values of virtual feed are ok. When chance the scale to daily, the virtual feed values change to something… strange.
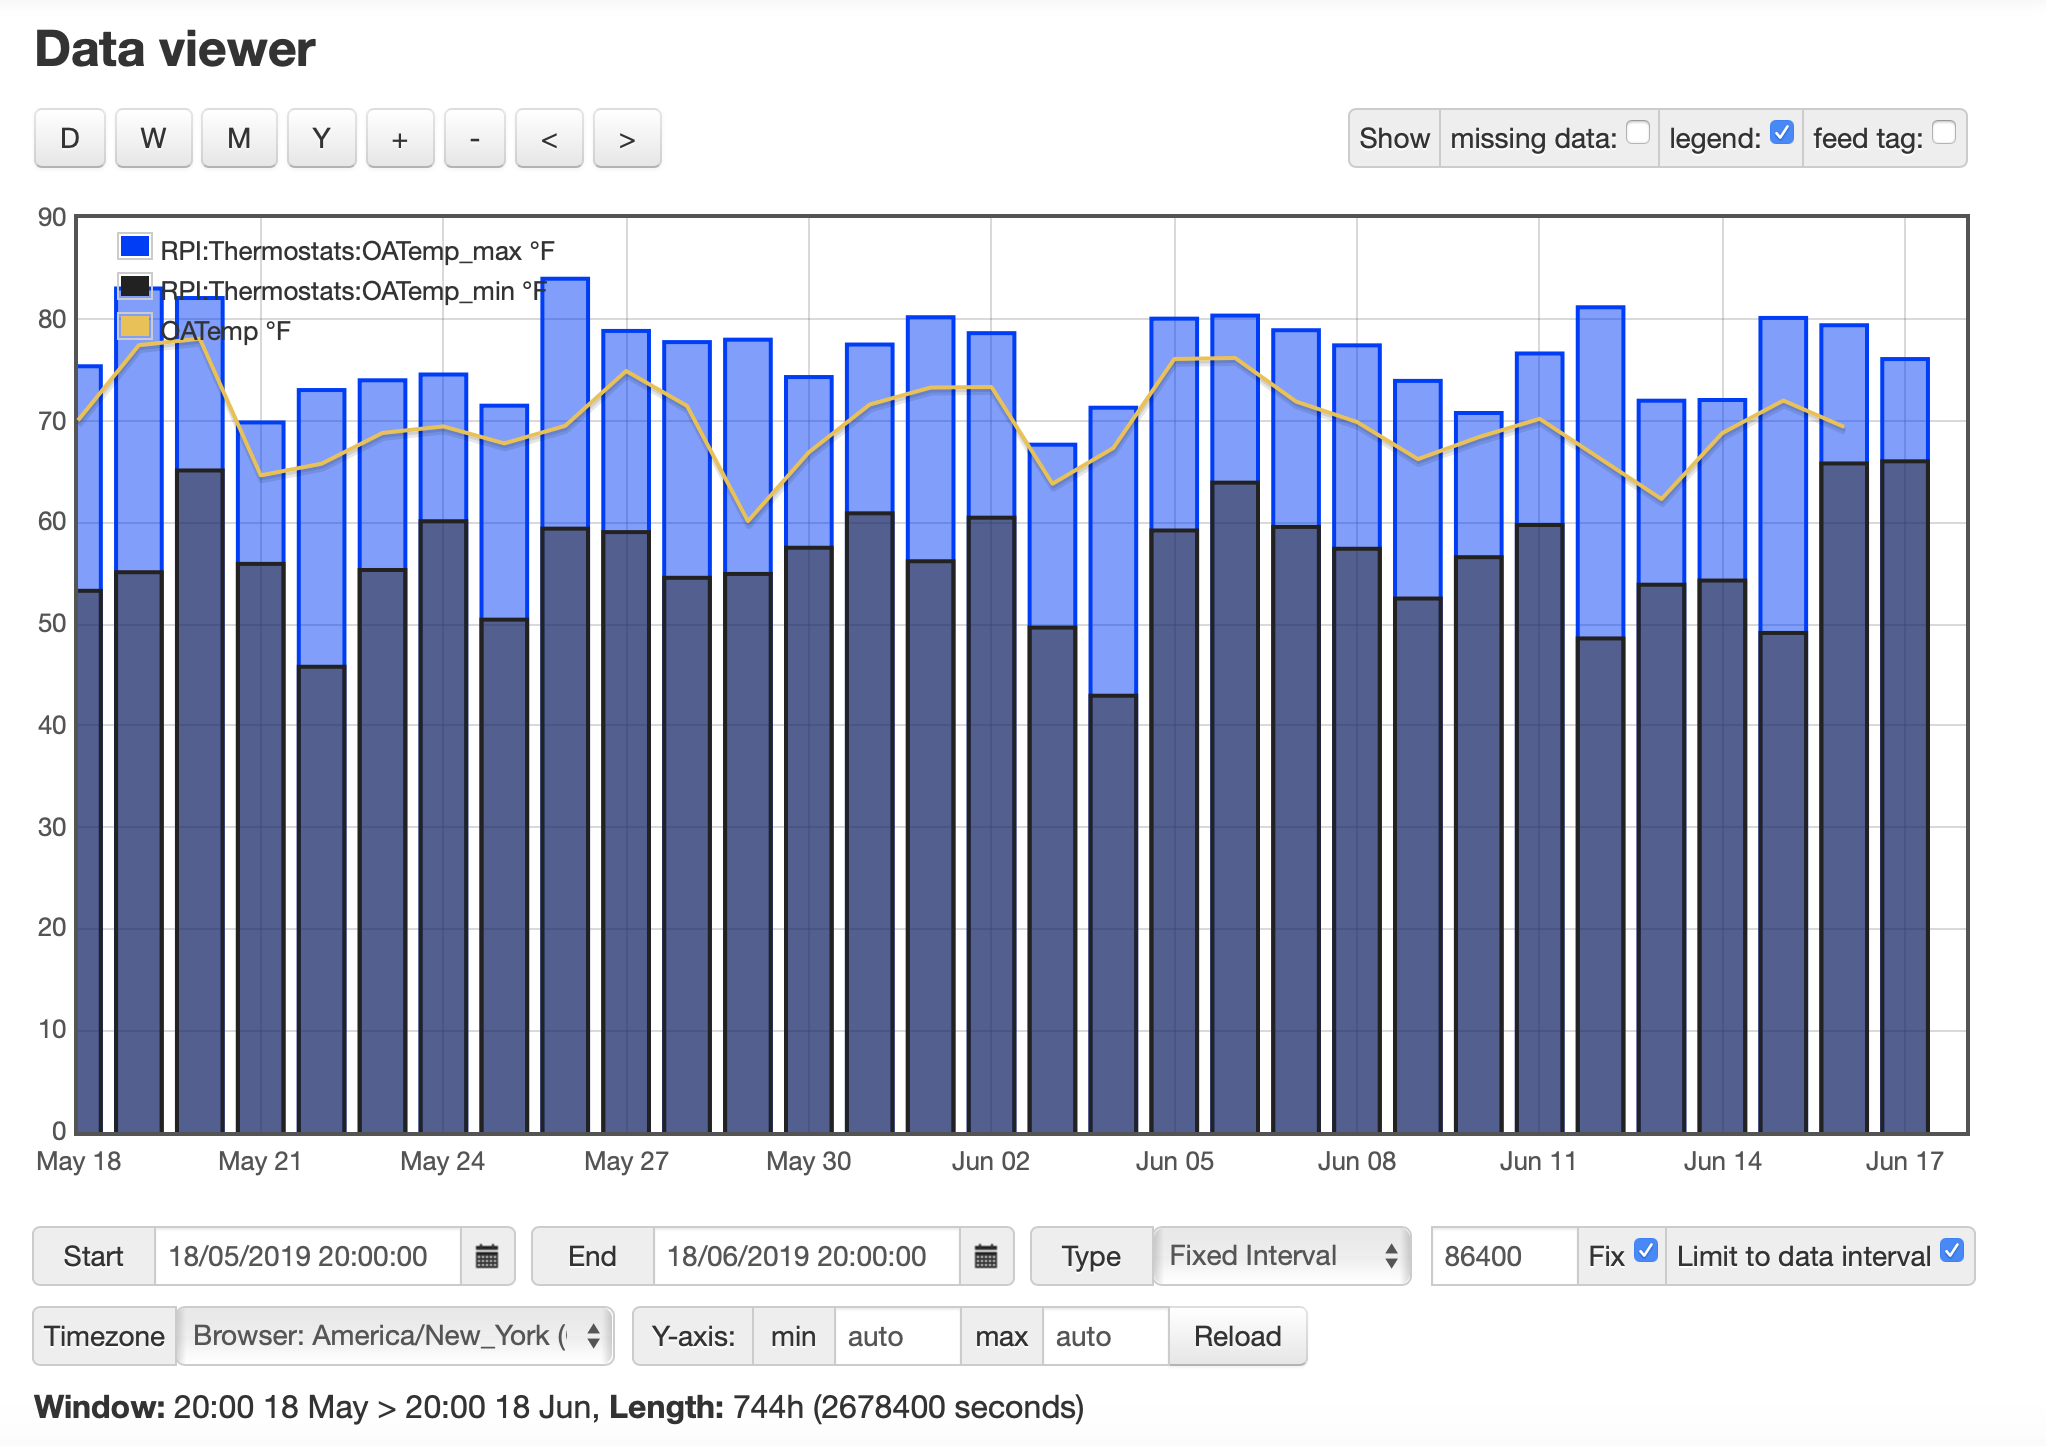
I’m sorry I cannot help, but this seems like a problem that should be fixed or explained by the appropriate expert. For a novice like me (in my ignorance) it brings into question the reliability of historical analysis. I think the issue might be related to ‘when’ the data points are recorded and how those data are then displayed. For the graph shown here the OA Temp line would have to have more resolution on the timeline in order to ‘match’ the mins and max’s.
Thanks for your attention.
In fact, I agree with you perspective about the point calculation of the graphic.
I generate two virtual feeds with the sum of the two costs (Source S1 + Source S2) → Virtual feed V1 in realtime and Virtual feed V2 in daily type.
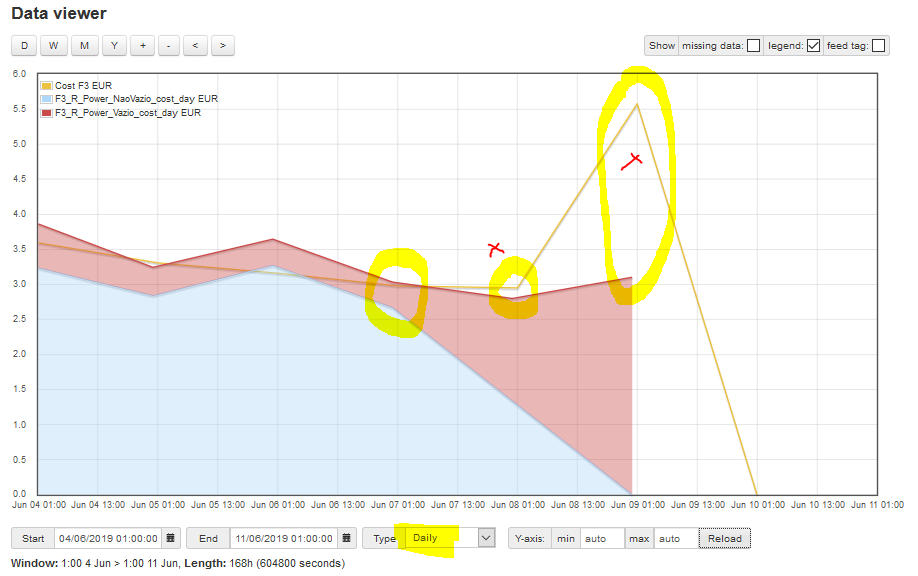
I can see in this new graphic projection the V2 is not sum well (maybe bad aplication of the virtual feed type).
We can verifiy the V1 in fact is sum correctly. The V1 values match with the sum of S1 + S2.
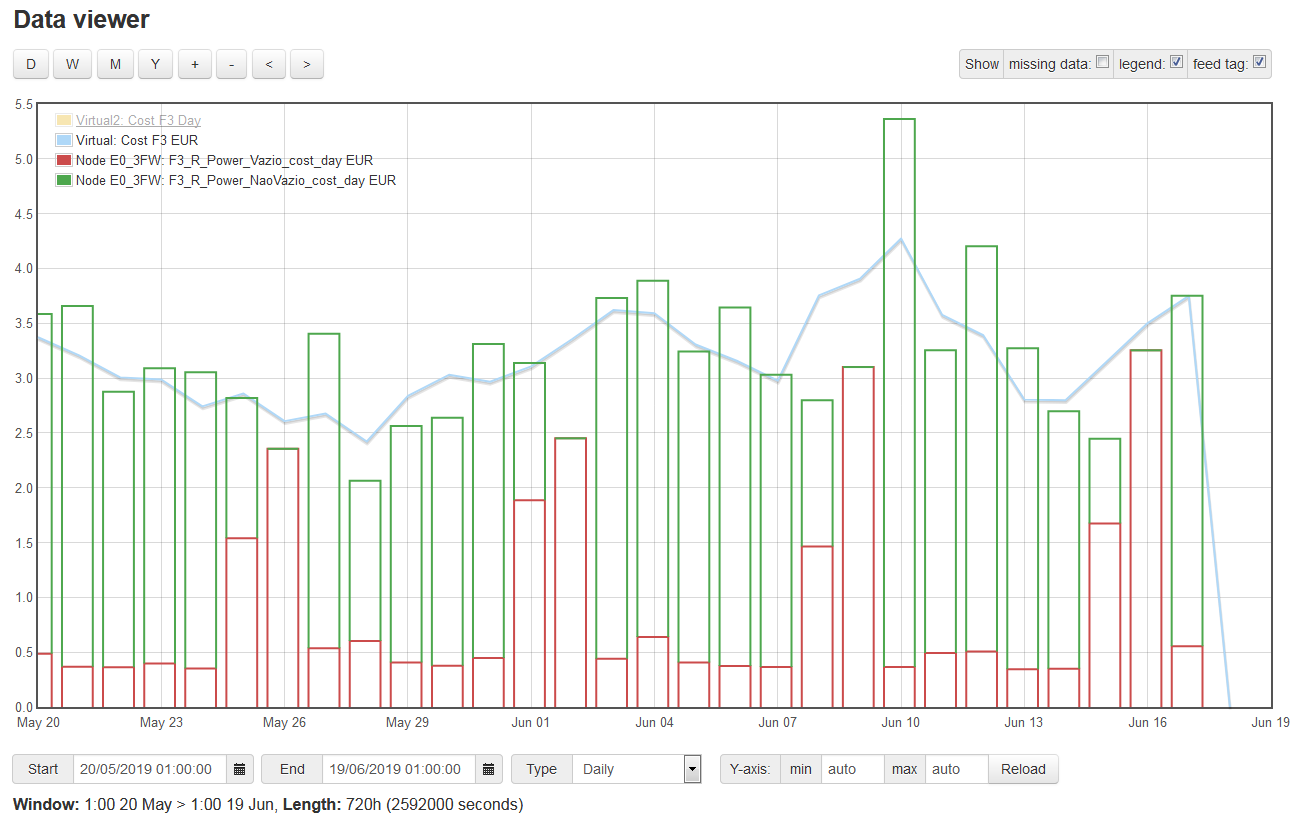
Nevertheless, when change the time period of the graph to daily scale our 84600 sec, the calculation of V1 change completed and don’t project the correct value.
Another strange situation is the inicial and end graph date. I try to locate the time at 00:00:00 hours but the software puts always in 01:00:00 hour. Maybe this strange efect can change the calculation of the V1.
I have an old emonPI instalation and don’t have this efect of the scale. When put 00:00:00 the system assumes the forced date.
Lets wait for some expert to evaluate the situation.