Hi Guys. My first post here. I thought I would join in with my observations. I have installed over 40 Vaillant units so far and have around 10 of them on OEM. All my OEM units give around 20%-40% lower outputs than Vaillant sizing guidelines and Vaillant sizing tools suggest.
I think Vaillant quoted peak output, and no one ever noticed. It is not a problem for most, as most installers don’t do the heat loss right, so even when sized according to the guidelines, units are usually fine. However, when you do get your heat loss spot on and size to Vaillant guidelines, then well, you are in trouble.
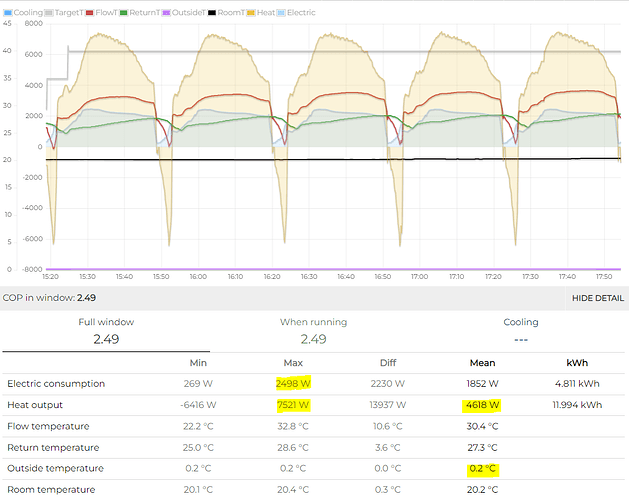
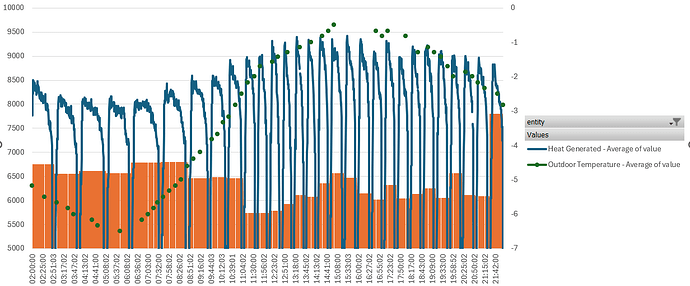
I have noticed the biggest problems with 7kW units. I have around 15 of those installed and 5 of them are now undersized. The gap between Vaillant’s quoted ‘peak’ outputs and actual mean outputs is dramatic with 7kW units. Designed to 35c they should give 9kW output, and some of them struggle to give more than 5kW. The average I see is around 5.5kW.
The variable that changes the output, in my view, is the ratio of actual heat demand vs heat pump output. The higher the heat loss, the more time the compressor spends in full output, and the more defrosts happen because of that. In short - the bigger your heat loss the less output you get from the units at the design conditions - so opposite of what we would want to happen.
So far, we have had to install no.2 backup heaters on our 7kW units, which are also OEM. This resolved undersizing at the cost of slightly lower system efficiency. However, this is not all the issues we are seeing with 7kW units. They also become very noisy—noisy to a level that is definitely unacceptable.
In short, all Vaillant figures seem to be peak and not mean, and Vaillant still publishes data that will make your unit undersized, with the 7kW being the most underpowered. Hopefully, they will publish a correction soon and replace underpowered and noisy units.
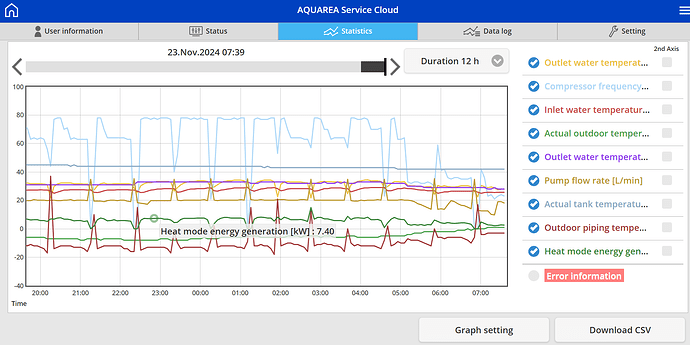
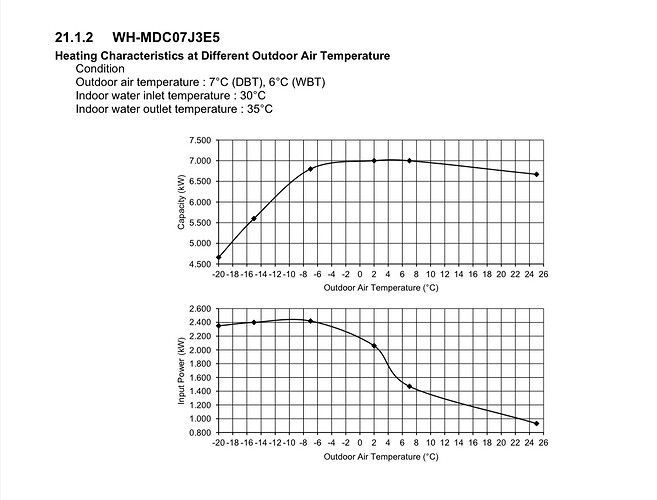
![]() ) - unfortunately Panasonic only indicate compressor Hz in their controls and provide no cross reference to actual compressor duty % and max Hz varies with model depending on compressor mapping etc, so in this case (~77Hz) it’s an educated guess it’s maxed out, but there may be a little left in the tank? But its peak output is actually higher than their data sheet at around 7.4kW
) - unfortunately Panasonic only indicate compressor Hz in their controls and provide no cross reference to actual compressor duty % and max Hz varies with model depending on compressor mapping etc, so in this case (~77Hz) it’s an educated guess it’s maxed out, but there may be a little left in the tank? But its peak output is actually higher than their data sheet at around 7.4kW


