My wired temp sensor is not accurate, over-reads below ~10C, as per this thread:
Thank you - that’s good to know. I need to be patient and wait for winter to actually arrive before doing some proper tinkering
What has your installer said at that stage?
Thankfully I’m not thinking mines out by that magnitude. I was trying to compare to the forecasted value, and just need to be more patient in my analysis
Sorry for the confusion; I meant to say that my temp sensor begins to slightly over-read when the actual OAT drops below ~10C.
A few days ago when OAT dropped to ~3C, overnight, the temp sensor didn’t read below 8.
Still a sizable error that I imagine you’d notice the impact of if set on pure weather compensation (which is surely what it is meant to be capable of)
Latest myVaillant app update now includes the ability to visualise and edit the heat curve, as well as set the minimum flow temperature and OAT switch-off threshold.
Playing around with the settings, it seems to confirm that the psimonkey heat curve tool is based on the correct heat curve equation.
Which version is that and where do you find the setting? Ate you on Android?
Just updated the app on iOS and found it. It’s in settings\control.
Got it now too. ![]()
Finally, the MyVaillant app is closing in on the other brands ASHP data/apps. There is still catching up to be done, but they are on the right track.
in expended mode, the heating is shut down when Temp is 3/16K (0.1875°) abobe the target T and reactivated when T is 2/16K ( 0.125°) under the target T + it include the active mode
I’m in Active mode, The system control calculates a new target room temperature that is used to adjust the flow temperature.
– Difference = Set target room temperature - current room temperature
– New target room temperature = Set target room temperature + difference

About your hypothetical example, it cycles following the result of the energy integral.
Each °/min above the desired Flow T is added to the -60° ( adjustable) , when at 0, it stops. Then it go down but I don’t know which DT it take into account (EDIT : it’s the same DT between flow and desired T and substract from 0°) , once at -60°, it kiks in again, etc , etc
well if in Active or Expanded mode
Hi,
Energy integral is set on -60° by default.
What are the impact on COP ? and on the heatpump itself ? when lowering this setting up to -120° to reduce the cycles ? in other word, why is it -60° by default ![]()
If you decrease this to -100 (minimum), you get less cycles, at -30 (maximum) you get more cycles. With less cycles at -100, you have a larger under/overshoot of the target flow temperature. With the -30 setting your flow temperature has smaller over/undershoots. This impacts COP as well. At -100, at the end of the cycle you will have a higher flow temperature than at -30, potentially leading to a reduced COP. At -30, the cycles are so short that the heatpump spends a relatively large percentage of the cycle in the early ramp-up phase which also has a reduced COP due to higher compressor utilization. -60 appears to balance these two factors. Depending on how much thermal inertia your house has (and whether it’s UFH or radiators), -30 will more closely adhere to the desired room temperature as it has the lowest deviations from target. Conversely, -100 has the strongest room temperature oscillations around the target.
I tested some more with -100°min. I am getting a marginally better COP over the cycle - maybe around a 2-3% difference compared to -60°min. That’s probably the initial transient of having the pump running and not much heat going in which contributes relatively less space in a longer cycle. I think overall the difference in efficiency is more or less negligible.
Hi, as I mentioned in other Thread I’m new here and have a Question about the Energy Integral. I thought that it is always a curve (like a Sinus Curve) but when I look at Grafana I see that it has those I will call it " Half Curve" between the Cycles.
Can somebody explain why the Curve form the Energy Integral looks like that?
Red Arrow = Hot Water
Attached Picture:
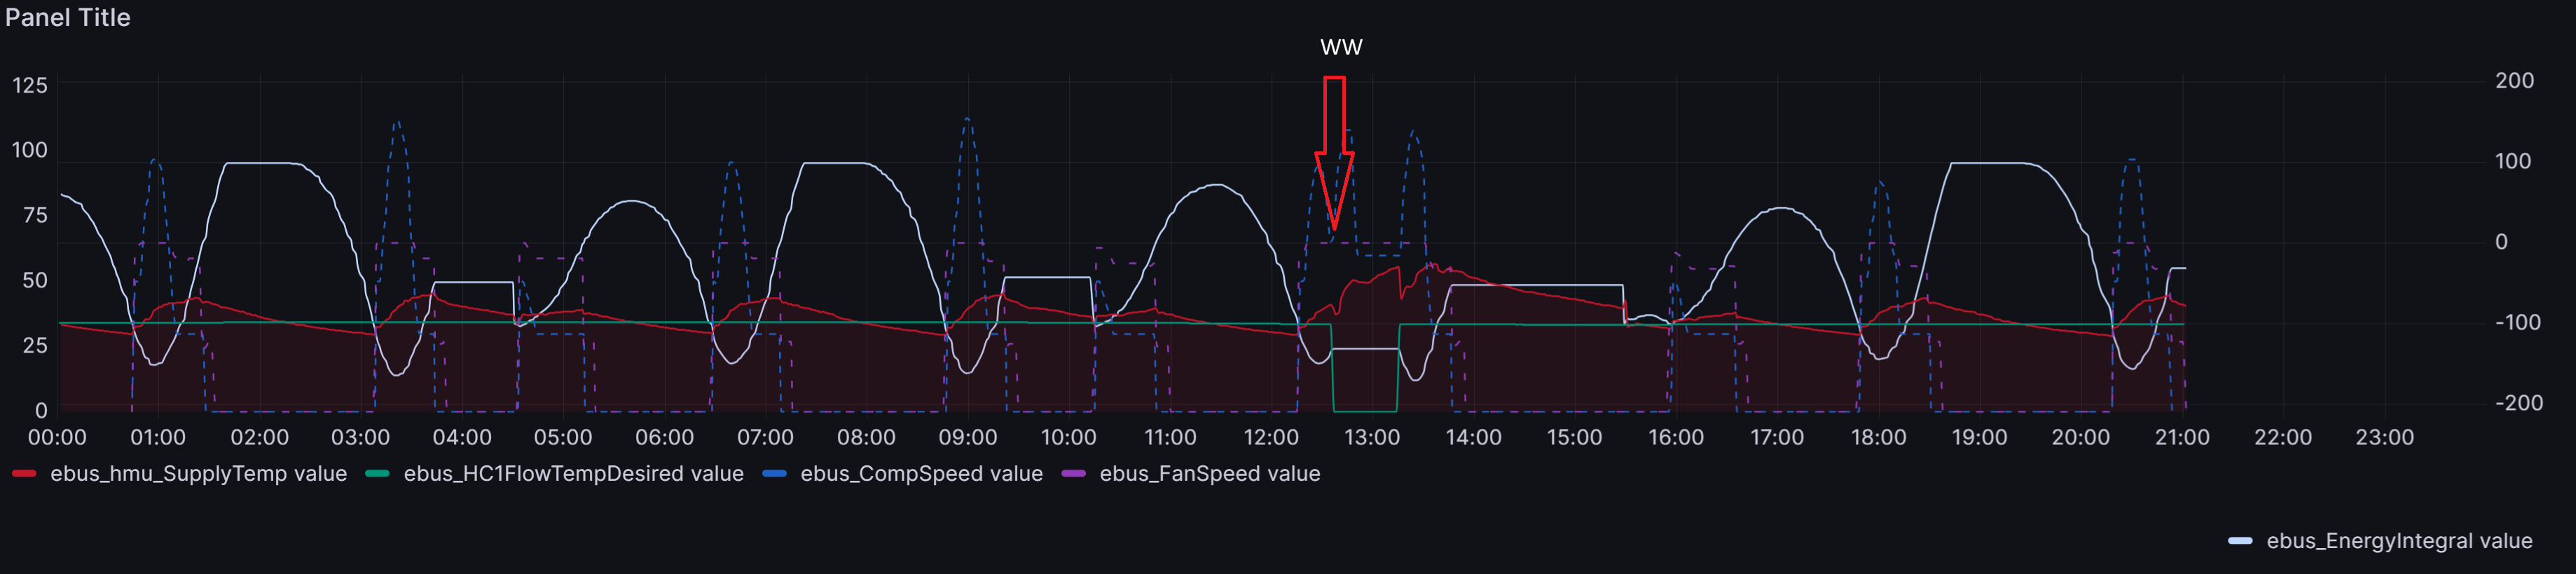
Integral is set to -100
Red= Supply Temp
Green= FlowTemp Desired
Blue= CompSpeed
Violet= FanSpeed
White= Energy Integral
aroTHERM VWL 75/6
uniTOWER VIH QW 190/6 E
Buffer Storage VPS R 100/1 M
The EnergyIntegral is clipped once it reaches +100°min - it cannot go any higher. This is why you see the flat region at 100 that only starts to drop once flow temperature drops below the target.
OK. Thats clear, but what is with this flat regions where the Integral only reaches about -19°min at e.g. 4:00 or 10:00?
Why doesn’t it climb highter to +100°min? This what I expected.
Was the heating off during that time for any reason? Maybe you’re not using pure weather compensation but your Vaillant controller is in a mode (active or expanded, forgot which does this) that can turn the heating off when target is reached? Plot your flow rate as well and see whether it drops to zero in those times.