Hi all,
I’ve just set up emoncms with a emontx but I’m getting some strange graphs being generated.
Quick run down of the hardware I have:
- emontx3.4
- UK 9v AC-AC adaptor (DB-06-09)
- 3x CT sensors (SCT-013-000)
- RFM69Pi
- Raspberry Pi 3b
- emonSD-30Oct18
Everything apart from the Raspberry Pi and SD card came from the openenergymonitor shop. The SD image came from emonSD pre built SD card Download & Change Log · openenergymonitor/emonpi Wiki · GitHub and I’ve updated the Raspberry Pi via apt-get and the emon* using the button in the webUI.
Quick paint diagram to show how things are connected up, the CT sensors are all inside the CU but I thought this would be clearer:
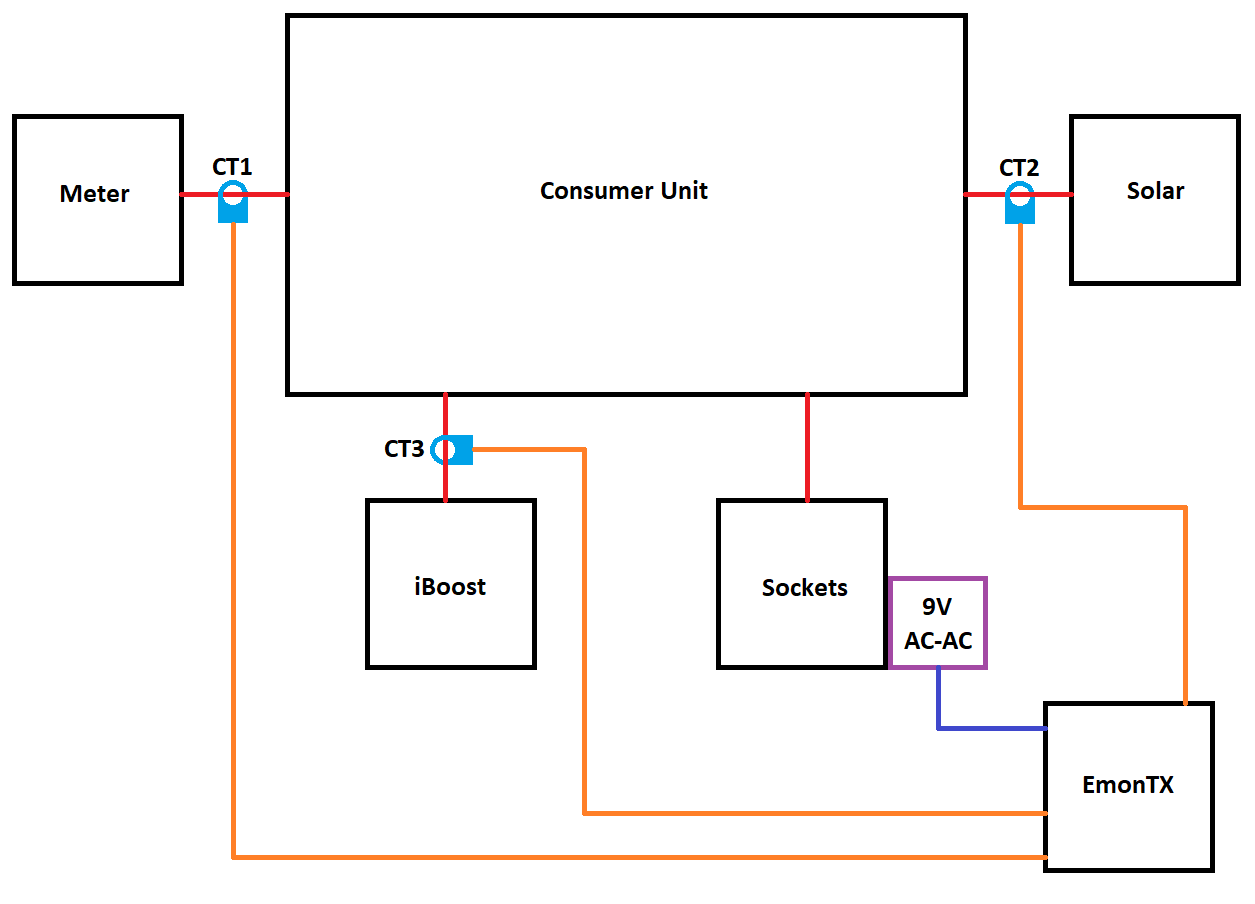
As for the input section in emoncms:
- power1 is connected to CT1
- Log to feed (Import)
- Power to kWh (Import kWh)
- power2 is connected to CT2
- Log to feed (Solar)
- Power to kWh (Solar kWh)
- Add to power1 (Import)
- Log to feed (Usage)
- Power to kWh (Usage kWh)
- power3 is connect to CT3
- Log to feed (iBoost)
- Power to kWh (iBoost kWh)
I set up the ‘My Solar Divert’ app which happily generated the following graph:
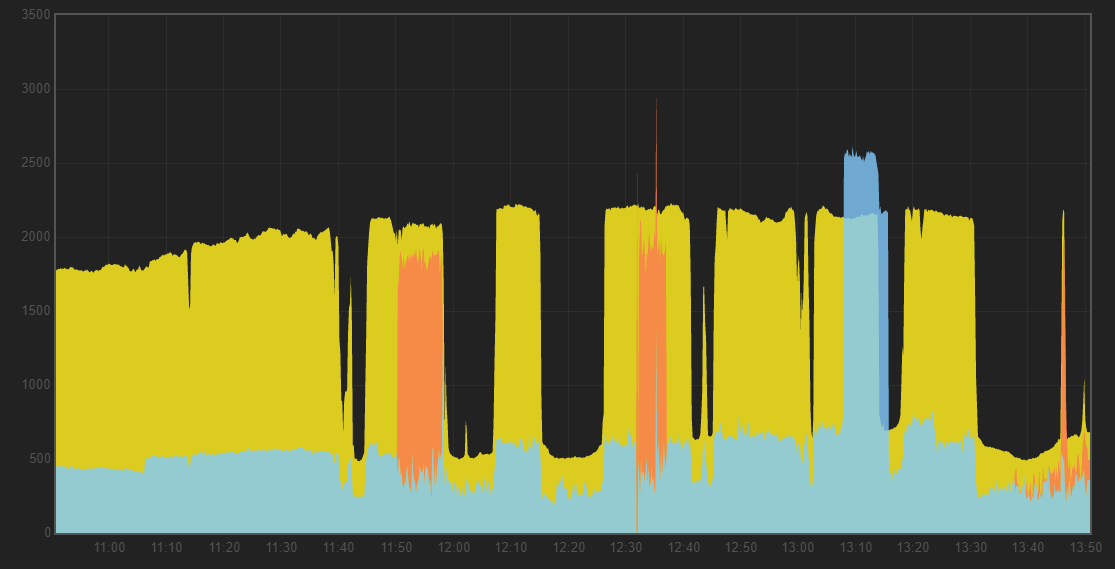
It mostly looks good but I’m confused why the Usage (blue) is jumping up/down by 300W as the Solar (yellow) comes on/off. The only obvious device that should start using electricity based on import/export is the iBoost (orange) and it isn’t. To confirm this theory, I flipped the iBoost MCB and there was no change.
Using the Data Viewer shows the same thing:
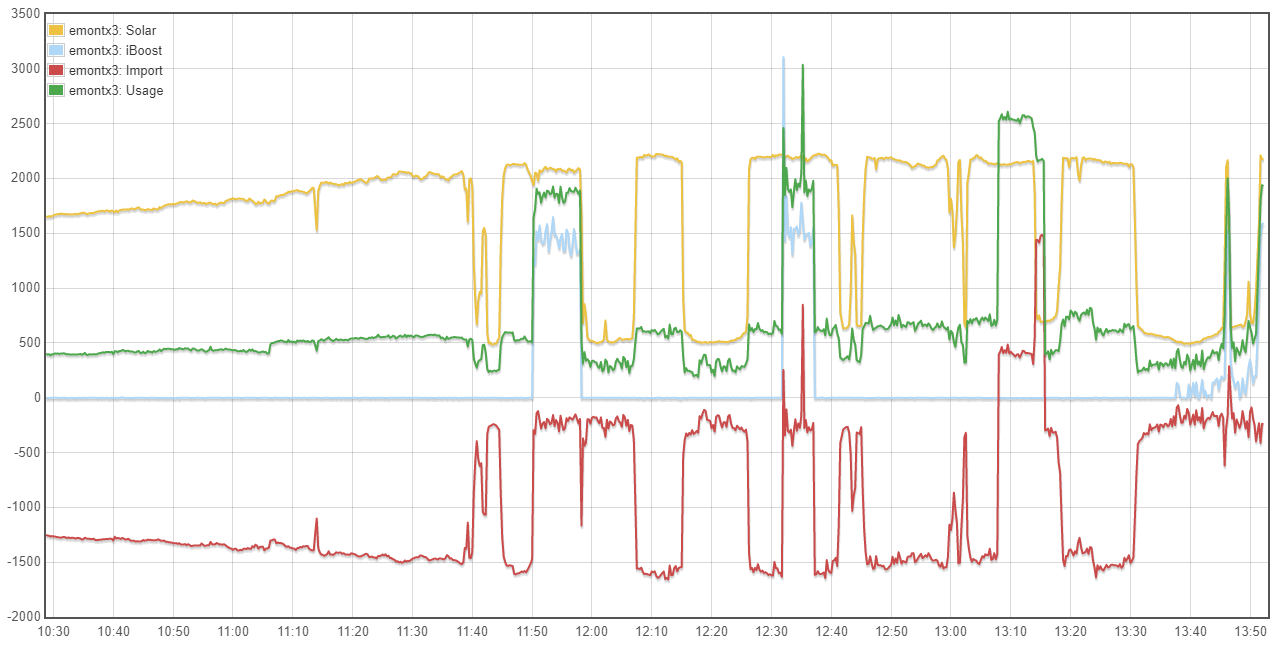
At the moment, I have two ideas that could be causing this:
- Calibration - not attempted, I was hoping it wouldn’t be needed
- Interference - CT1 and CT2 are physically close in the CU
Any suggestions?
Thanks in advance,
Rob
