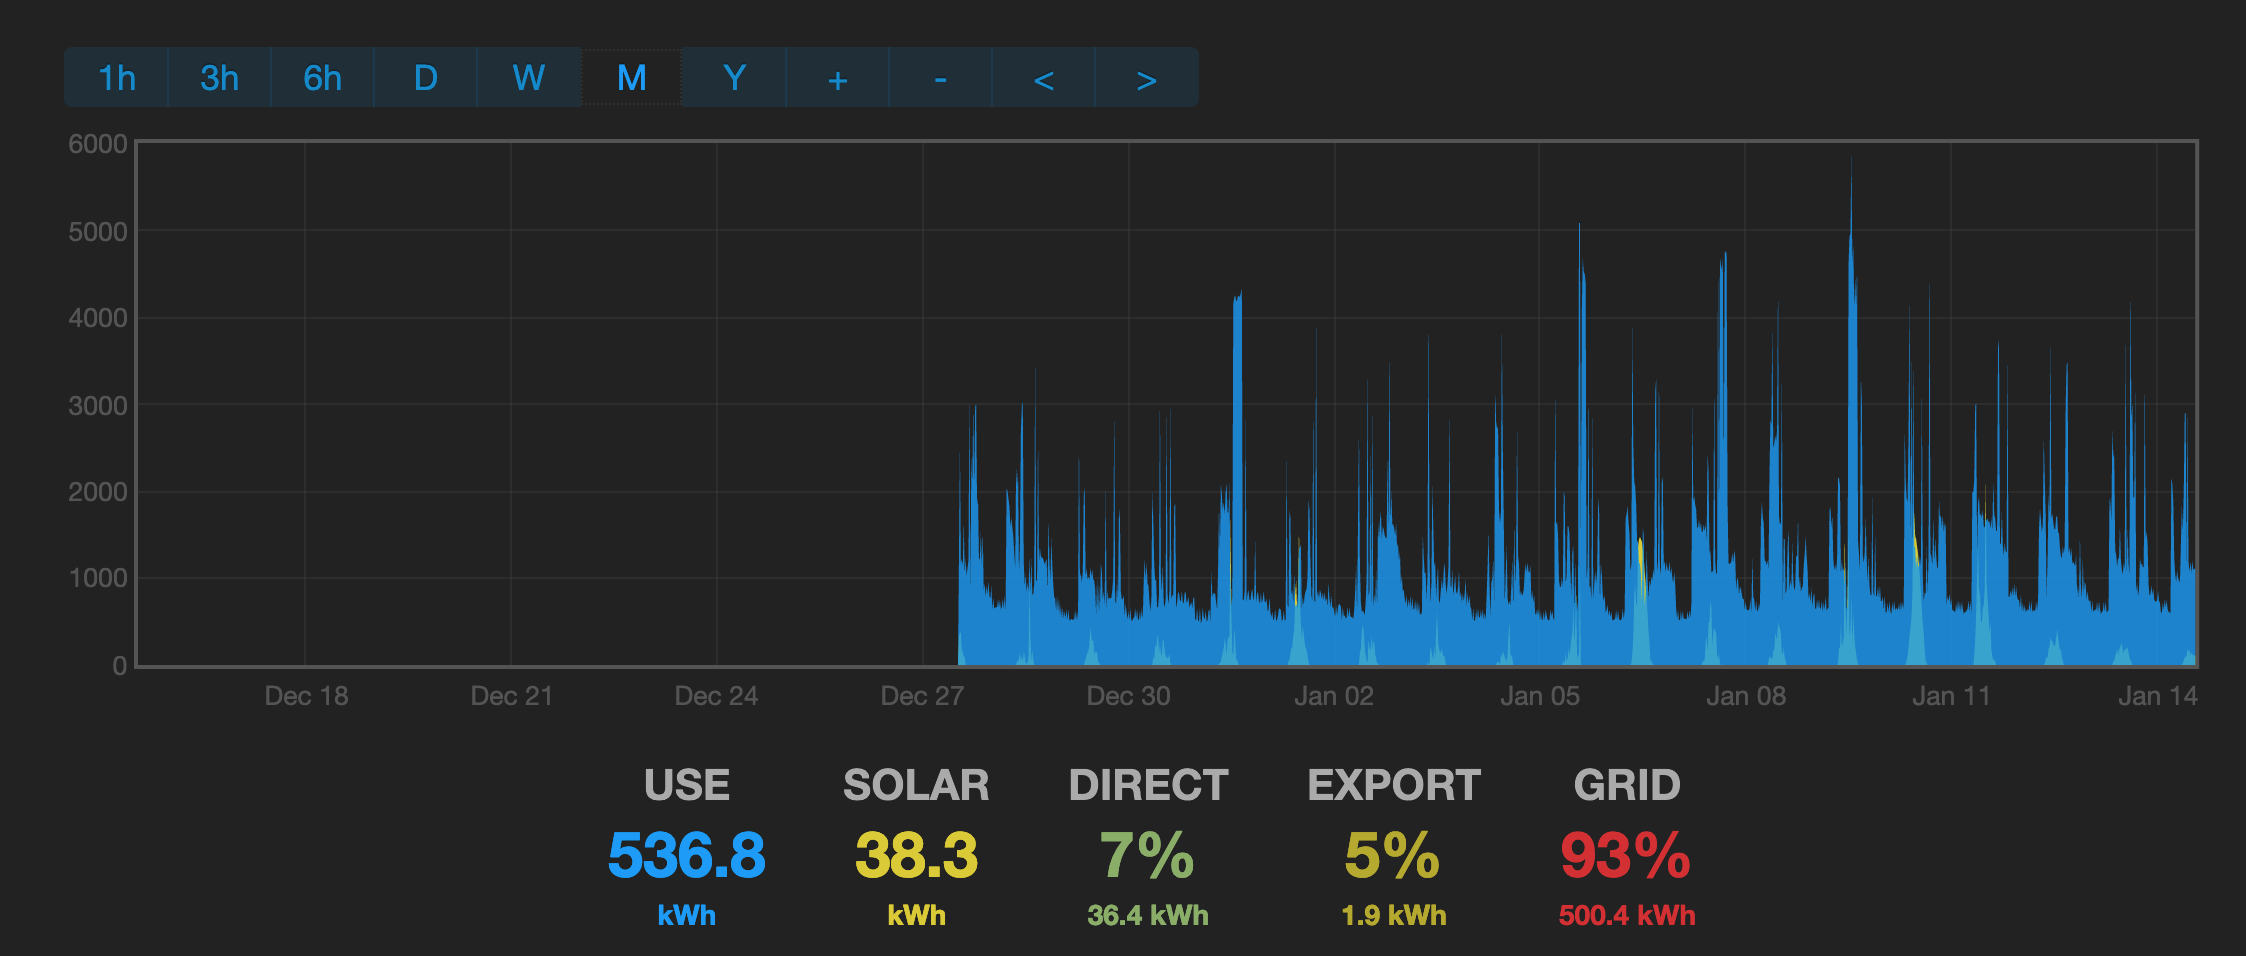
I started to use my Emonpi on the 27th of Dec. when I view the graph set to “M”, I have an x amount of use and a y amount of solar. Now, when I change the graph to “Y”, the use and solar amount change significantly, although there is no data before the 27th. Any idea how this is possible ? Thanks, and not to forget…All the best for 2022.
Thanks @MarcvE ah yes, the totals based on the power view that you are looking at there are calculated based on the data points in the window, so it is less accurate as you zoom out (each data point covers a greater amount of time)
That is exactly why I made two screenshots where all data so far is in the main window, and not just a part of the total. The resolution of the viewed data should not have any affect on the totals as I see it, as long as all data in the database is in the window.
Every individual reading has a time stamp, and if I view all the data in the window, it should add-up all data in the field. Two weeks data until “now” in a “month” window, or the same data in a “year” window.
Nevertheless, I like what you guys build, but this looks like a “glitch” in the software.
I am dealing with validations of monitoring systems that monitor 100’s of sensors 24/7, and this would be a big no no.
Yes Im afraid that’s not the case, that particular view is just pulling out ~800-1200 datapoints out of what could be >3 million if you are looking at a year. The app would be very sluggish if it did calculate on 3M datapoints on the fly so it’s a bit of a tradeoff with priority currently given to speed.
It should actually be able to calculate those overall stats from the cumulative kWh data feeds (rather than the power feeds) but it’s not currently doing that. You can do that analysis manually if you have a solar_kwh, use_kwh and import_kwh feed however using the graph module.
Don’t get me wrong. I like what you guys build. It just baffled me when I noticed the deviation.
And pulling a 2 year graph for a single sensor with a logging rate of 10 seconds on a quad core is not that fast either. I can see the rpi sweating.
Maybe it is a good idea to “lock” the history in days and weeks for the total numbers. Just leave the live graph you have in the UI, because you want to see the trends, but for the history numbers underneath.
Make a day start from 00.00 to end at 24.00. Calculate total for that day and write that total to sd at 24.00.
This way, the display for a day also shows the graph for that particular day, and not half the night from the day before.
To display the total for a month, you only have to add up the 28 to 31 totals from the days to get the correct month value. If you save a single number for the month, you only have to add up the 12 months to show the exact value for that particular year.
To save space on the SD card, you could also add a button to only save totals for previous years starting from year “x” backwards and delete the individual loggings.