Hi,
I’ve managed to get (all) the data from my smart meter-board in the house by building a data interface (dutch P1 DSMR protocol) and feeding this to MQTT and with node-red to emoncms.
So that’s working nicely.
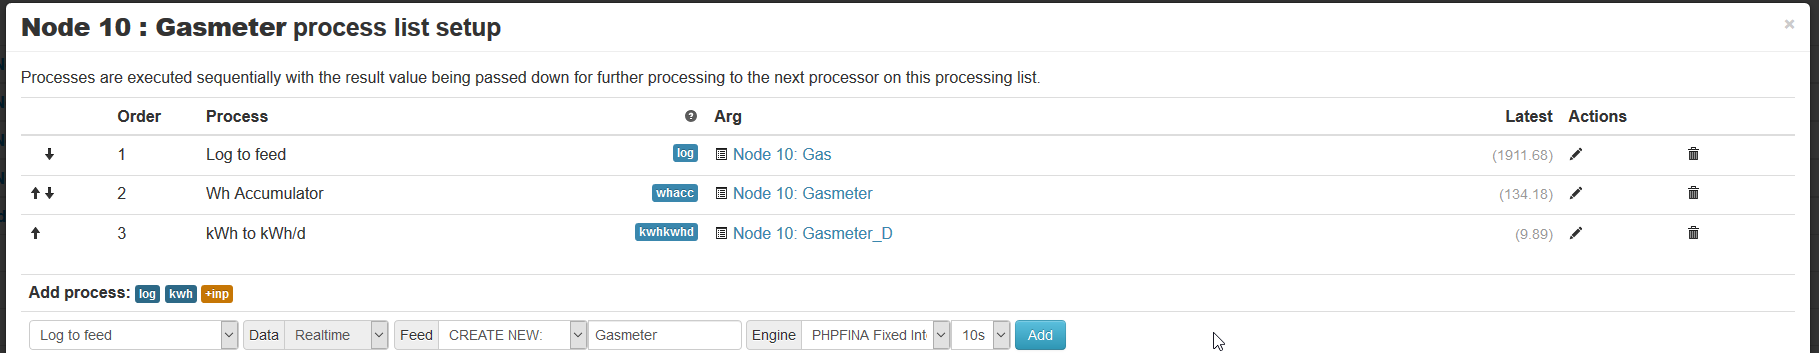
Now I managed to get the data from my natural gas consumption. it’s a total use m3; value that I pass every 20 seconds to emoncms. I did some searching on the forum and found a way to display the data on raw and daily consumption with this feeds:
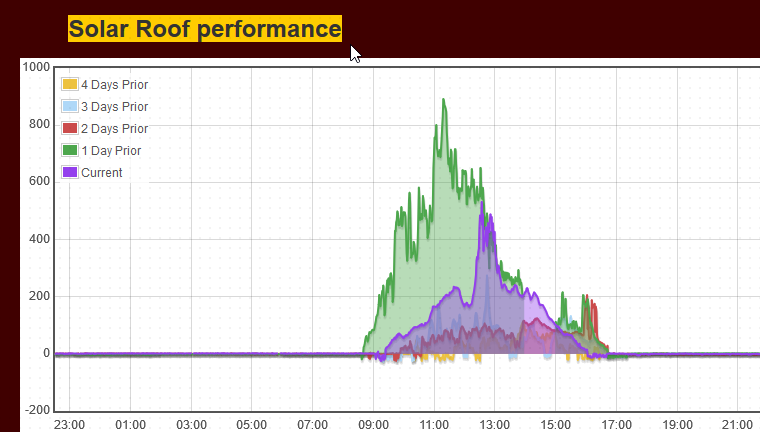
But now I want to build a time-compaire graphic. something I already have from a normal power feed at my solarsystem:
So how can I create a feed out of my cumulative m3 input from this sensor? I can’t find any examples… and the guide is only telling something for pulse sensors… but I got a total usage data input…