The importance of continuous sampling

It’s been recognised for at least as long as I’ve been associated with OEM that the “discrete sample” method is adequate when conditions are changing relatively slowly, but there are serious limitations with loads that vary rapidly. And it is with the sort of load that you mention (and I include in that the halogen type of hob), that was foremost in my mind when advocating the concept of continuous monitoring.

Clearly one sample every half-second is a significant ( ×2 ) advance over 200 ms every 10 s taken over a long period, but even so, it’s a lottery as to whether the correct value is recorded during any half-second interval, or how much is under or over-recorded, especially when the switching rate converges towards the sample rate.

Yes, I’d often heard it quoted in here, but never quite knew the reason why. Nothing like a few scope pics to hammer the message home. It also revealed the cycle-by-cycle changes this particular one makes as it’s ramping.

These 4-burner hobs are getting pretty popular in these parts. I’m told that once you get one, your old electric kettle goes in the bin so these things get powered up every time you make a cuppa’, and end up a fairly significant contributor to your total energy bill.

That came as a bit of a surprise to me. I guess the reason that’s done - and it must be deliberate - would be to minimise the perceived effect of any flicker that it induces on a weak supply.

I wonder if it might be doing some sort of pot-detection? There’s heaps of info in AN2383 if anyone wants to build their own. I’ve only scanned it briefly, but I did notice stuff like:

This causes the system to have an oscillating resonant frequency strongly dependent on the type of pot placed on the plate at different times.

Therefore the 9 working levels cannot be based on constant frequency levels. The PWM
frequency must be adjusted to the selected level in order to work with the pot placed on the
plate at that moment.

So each working level does not work on a constant PWM frequency, but a constant current.
By reading the I-CTRL feedback signal, the MCU smoothly adjusts the PWM frequency in
order to keep the current constant for the selected working level.

Thinking about it, that’s probably wrong, because it would also need to ramp down to hide the effect of flicker.

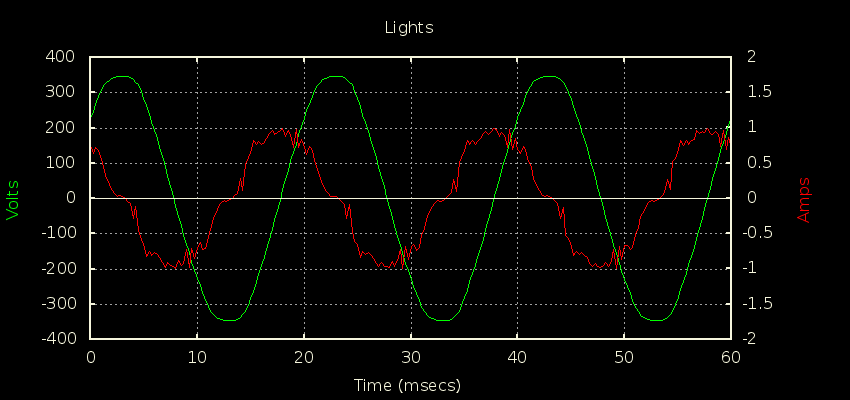
The standby current on this thing is a shocker: 0.66A just sitting there waiting for someone to press a button. 3W Real and -165 VAR Reactive, PF of 0.018.

No prizes then for guessing how they’re deriving the low voltage to run the bit that detects the button being pressed. I presume the h.f. mush on the current wave is what’s getting through what is effectively a high pass filter. It would be interesting to see how the Fourier analysis of that will look compared to the one in post no.5., and how far up the frequency spectrum it stretches.

But in fairness to the title of this thread, continuous or discrete sampling would make little difference in this case.

Well spotted, it does indeed go all the way out to 2kHz and potentially beyond. I vaguely recall that really low power devices (< 5W maybe?) are exempt from the harmonic rules.

Yes, you’re right. Both here and in the USA, and I presume that’s common elsewhere.
Here, lighting equipment with power not greater than 25W is exempt. Otherwise, for the 3rd harmonic, its 3.45 A for portable tools, and 30 × power factor for lighting, and 2.3 A for almost everything else, but the limits fall with the harmonic order and are specified up to the 39th - near enough 2kHz.

I’d be surprised though if that (microwave?) device is actually generating those harmonics - I’d suspect that they’re on the supply and the capacitor dropper is acting as a low pass filter and allowing you to see them being conducted to neutral as a current wave. If you have a suitably rated capacitor and resistor, which could not possibly generate harmonics, to hang across the supply, that would be a revealing test.

This is still the same induction hob, which now well and truly replaces the microwave as my most current-hungry appliance in standby. Unfortunately I don’t have the bits required for your suggested experiment, but will try to remember to pick them up next time I’m ordering something.

I got to wondering how to go about quantifying that in some way. I think everyone agrees that it’s really only relevant when the load is changing rapidly, but when the load is changing rapidly the 5-second interval average power is changing wildly from reading to reading as well. Comparing to a reference meter isn’t a lot of help because you’ve no way of knowing if the reference meter and the meter under test are sync’d to the same 5 second interval. You really need the two meters looking at the exact same 250 linecycles and then compare their results.

There’s no way I can tell my energy IC based monitor to only look at every 25th cycle, it’s just not in its DNA, but the emontxshield+stm32 demo code offered some possibilities. I modified the f/w slightly to base everything on ZX detected half-cycles and configured it for 500 half-cycle (5 second) integration. Then I pointed two channels at the induction hob to see how they clocked it:

Ch1 W     Ch2 W      Diff
566.81,  567.46,    0.11%
550.16,  551.06,    0.16%
192.38,  192.96,    0.30%
388.26,  388.87,    0.16%
561.32,  562.03,    0.13%
378.93,  379.65,    0.19%

All pretty good so far and you can see the wild variations from one 5-second interval to the next as the hob does its thing. 0.3% was the biggest discrepancy I saw.

Next, I knobbled Ch2 to only look at every 25th cycle - so just 10 cycles over the 5 second integration integral. That gave:

Ch1 W     Ch2 W      Diff
190.64,  195.24,    2.41%,
416.40,  473.19,   13.64%,
552.16,  568.24,    2.91%,
347.01,  288.47,  -16.87%,
217.29,  287.87,   32.48%,
553.96,  565.81,    2.14%,

So in one 5 second interval the reported average power was out by 32% (I actually saw 40% at one stage, but didn’t have the scope configured to capture it, so went with this run). Next I toggled a spare IO pin whenever the error exceeded 30% and used that to trigger the scope, which was configured to capture 5 seconds of current prior to the trigger (trigger is just off the right edge). That produced this:


In broad-brush terms it’s 1.1 secs of high power, followed by 3.9 secs of low power.

The final step was to extract that data from the scope and highlight every 25th cycle:


Even broad-brush you can see what’s happened. Ch2 saw a 3/10 ratio of high:low while Ch1 saw the correct ratio of 1.1/5 and those ratios come out pretty close to the 32% error reported above.

Now if you let it run long enough even that under-sampling eventually converges on the correct result but it takes a while. Even over the 30 seconds of those 6 consecutive 5-sec reports above, Ch2 was over reading by 4.45%. At those timescales there’s a real risk that chef will have bumped the hob up or down a notch and then you’ll be busy chasing a new target without ever converging on the old.

This also demonstrates why metrics like “long-term agreement with the revenue meter to within 1%” shouldn’t give you much confidence about the accuracy of individual power readings. In this case my Ch2 was out by much as 32% (actually 40%) and yet I could still meet the long-term 1% agreement with the revenue meter, provided chef was agreeable.

3 Likes

So this thread starts off trying to make a point using a fairly steady state plot of an induction cooker that has a stated 7% or so variation cycle to cycle. By observation, it’s not at all random, but rather is a sawtooth pattern as evidenced if you look at the bottom of the traces.

image

The period is around 7 cycles. My assertion was that random sampling of those variations at about two per second would flesh out the average to less than 1% over a reasonably short time frame. That argument was deemed offensive and removed, but apparently the point was taken because the follow on argument uses a new set of samples where the appliance now “thermostats?” from second to second.

The new argument is that this will not stand up to statistical scrutimy of random sampling. Lets take a look at that argument.

First, the analysis is based on the premise that the sampling is strictly periodic - one every 25 cycles. That is incorrect. The sampling is for intents and purposes random. There are 100 opportunities (zero crossings) per second to start a cycle sample and there are many asynchronous events in the subject device that can cause it to skip a half cycle. Moreover, that is only in a fully loaded device. The sample rate can be as high one in three cycles.

Now looking at the trace from above:

image

How convenient. The trace covers 5 seconds. That’s 250 cycles. The non-random samples have a period of 25 cycles. 250/25 = 10.000000. So this is not even close to a representation of a random event. Sure, there are three “samples” in the high power zone, and 7 in the low power zone. Take a close look. How hard is it to do that?. How many even modestly random samples do you think would ordinarily occur during that 1.1 seconds? Let’s see:

The 1.1 second trace represents 55 cycles. In order to get three samples into that block at 1/25 the first one would need to be in the first 5 cycles, so in a random world, probability says that would happen 20% of the time.

So 20% of the time 30% (3 of 10) would be high, and 80% of the time 20% (2 in 10) would be high. When you blend that you get 22% of the samples will be high, which is the exactly what the scope trace shows - 1.1/5.

That’s why even with a relatively short time interval, the above experiment started to converge. But it was skewed in that it used a rigid fixed interval rather than a somewhat random interval. And I’m not really buying the argument that the chef will change the game every 30 seconds as a “real risk”. That’s may be a little hyperbolic.

As these arguments go, there will no doubt be another run at it with a more obscure fringe case and again, cherry picked data. When my original post was censored, it was probably because I pointed out that these guys make a lot of arguments with oscilloscope traces and convoluted analysis. I’m just saying be wary of false assumptions and cherry picked data. When I talk about a “practical example” of a problem, I mean compare the actual results from the device in question with a reliable standard, using a reasonable common load. I don’t buy the argument that folks are getting bad numbers, they just don’t know it. Is it just me or is that king naked?

Or, you have to go back to basics and think what the root mean square average (when considering voltage or current) or the average (when considering power) really means. It’s the value that gives the same heating effect that a steady quantity of the same numerical value gives. And to make the average meaningful, the averaging period must either be “long” compared to any cyclic event, or perfectly synchonised to it - which is what your “two meters” implies.

Hello @overeasy, Id like to clarify that the reason your original post was removed was that it contained unhelpful ad hominem attacks, a constructive discussion on here about the relative merits of different approaches to measurement is fine, but making comments such “these guys make a lot of arguments with oscilloscope traces and convoluted analysis” are unhelpful.

Thanks Trystan. I guess it would only be helpful if it caused
them to stop doing it. Which doesn’t seem to be the case.

Thanks @overeasy. I think your misunderstanding @dBC and @Robert.Wall’s intention. The discussion, from my understanding is intended to be a technical discussion on sampling techniques not an attempt to pick holes in specific hardware. I really hope we can all do our best to de-escale any argument here, keep things to the technical discussion.

Well Trystan, you see what you want to see. Where else have I seen that 25 samples per sample number…

I am almost sorry that I restarted this discussion with comments I made on another thread. I vaguely remember it when it first started, but I can that there are still some very heated feelings on this an both/all sides of the argument.

My take is that @overeasy believes and has generally documented that his approach is generally within 1% of a revenue grade meter for normal household loads over some period of time. I generally believe this to be true.

The other side I have heard is that for some loads there can be an error that is greater than 1% possibly as high as 17% for some very small period of time. I also believe this to be true for certain specific cases.

So, could it be possible that both of these are true? Absolutely.

As others have said, engineering is always about making tradeoffs. Over a year ago, I looked at the options. I chose the IoTaWatt and few months ago I bought a second one. I did this because it provides a good easy to use solution to my problem at a reasonable price. Would I have preferred a solution that used dedicated energy measurement ICs that continuously sample every channel all the time? Yes, but such a system does not exist off-the shelf.

Perfect (in the future) is the enemy of good enough.

Plus, the sampling method is just one (important, yes) part of a product. I believe @overeasy chose this method to allow easily compensating for differences in the phase response of different CTs and VTs. This choice leads to much easier usage with different CTs on different channels, which is a huge win in usability.

I am not sure how much value this “technical” discussion has. Most people have already made up their minds and are unlikely to change them based on anything that is said here. Increasing the accuracy of the ADC measurements isn’t going to improve the overall accuracy unless you also have excellent accuracy and calibration of all the sensors.

But, it all comes down to what decisions are you going to make with the data you get and how does ANY inaccuracy in the data impact those decisions?

Many people say they want perfectly accurate, but few are willing to pay for what it takes to even come close to that.

This forum is as at least as much for designers as it is for buyers, and this topic is certainly aimed at the designers not the buyers. I wouldn’t expect your average buyer to have any idea what this thread is about.

I know almost nothing about IotaWatt and its accuracy, others are way more qualified to speak on that topic than I am.

Now, back to my Ch1 / Ch2 experiment above, and your comments about accuracy claims. I agree, accuracy specs should and often do come with footnotes, a very common one you’ll find on meters is something like “1% accuracy at PF > 0.5”. That’s something a user can work with.

Now, if I were tasked with putting an accuracy spec on my two channels above…

Ch1 - I’d probably be comfortable claiming 1%, subject to a lot more testing first
Ch2 - where to begin?

I know I’d have to say at least +/- 32% because I’ve seen it spit out 287.9W when the correct answer was 217.29W. It’s entirely irrelevant how often it’s wrong by 32%. Error specs are all about worst case unless as you say, the worst cases are exempted by footnote. All the end user gets to see is 287.9W and they want to know how close to reality that is. They’re not going to be considering whether or not it’s their lucky day.

Now I could say something like +/- 5% provided the load is constant for > 30 seconds. Personally, I’ve never seen a footnote like that on a meter. If I need to average 6 consecutive readings to get to my 5% I’d be better off doing that averaging internally and just spitting out the result every 30 seconds. What’s the point of me spitting out 287.87W? What use is it to anyone if they need to wait for surrounding readings and do their own averaging before they can use it with confidence?

Even then, I’m basing all my worst case estimates on one particular load I managed to get my hands on. Who knows what other loads out there interact with my 1-in-25 cycle choice even worse. The easiest way to have confidence in my accuracy specs is to determine the accuracy for a single cycle, and then measure every cycle. Ch1 is measuring the signal, Ch2 is estimating it.

That was by design (of the experiment). I wanted to see the data that caused Ch2 to get the answer so wrong.

I’m not sure what you’re referring to there. The period of the full thermostat cycle is 7 seconds (you can see it in a pic much earlier in this thread).