If there is already a way to simplify my goal, apologies if I have missed it in the docs. If not, may I request an ‘email report’ that includes the MyHeatpump app data, please? Emoncms - emailreport
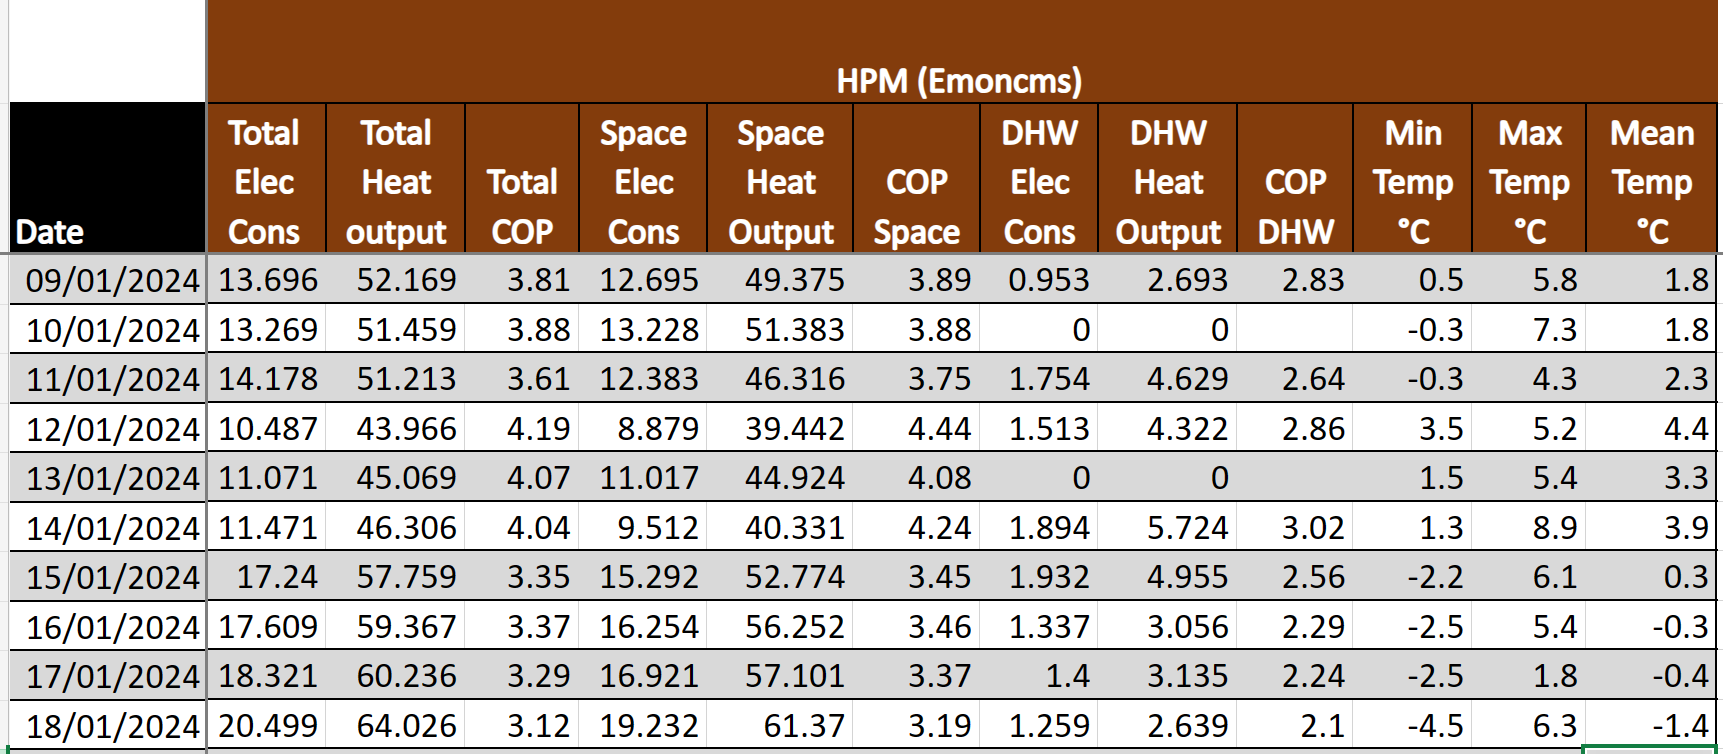
It’s possible to get daily totals using the CSV export feature on the emoncms/graph interface, works fine for total kWh and average values but not min/max or separating out DHW and Space heating.
I am planning to work on a feature that will make this easier. The idea is to do the same processing of results that happens on the detailed page but on the server side, recording this to a table. HeatpumpMonitor.org would then load these daily summaries rather than the current approach of loading last 30 days, last 365 days and monthly figures, the daily summaries would then get aggregated again as required. This would make it possible to see stats for all systems for say last 7 days or whatever range is of interest… It will also improve the reporting of data quality.
It would then be a matter of making it easy to export the data from this table as csv data in your case…
I will hopefully get to work on this soon, once I’ve finished this updated WiFi setup tool Im working on.
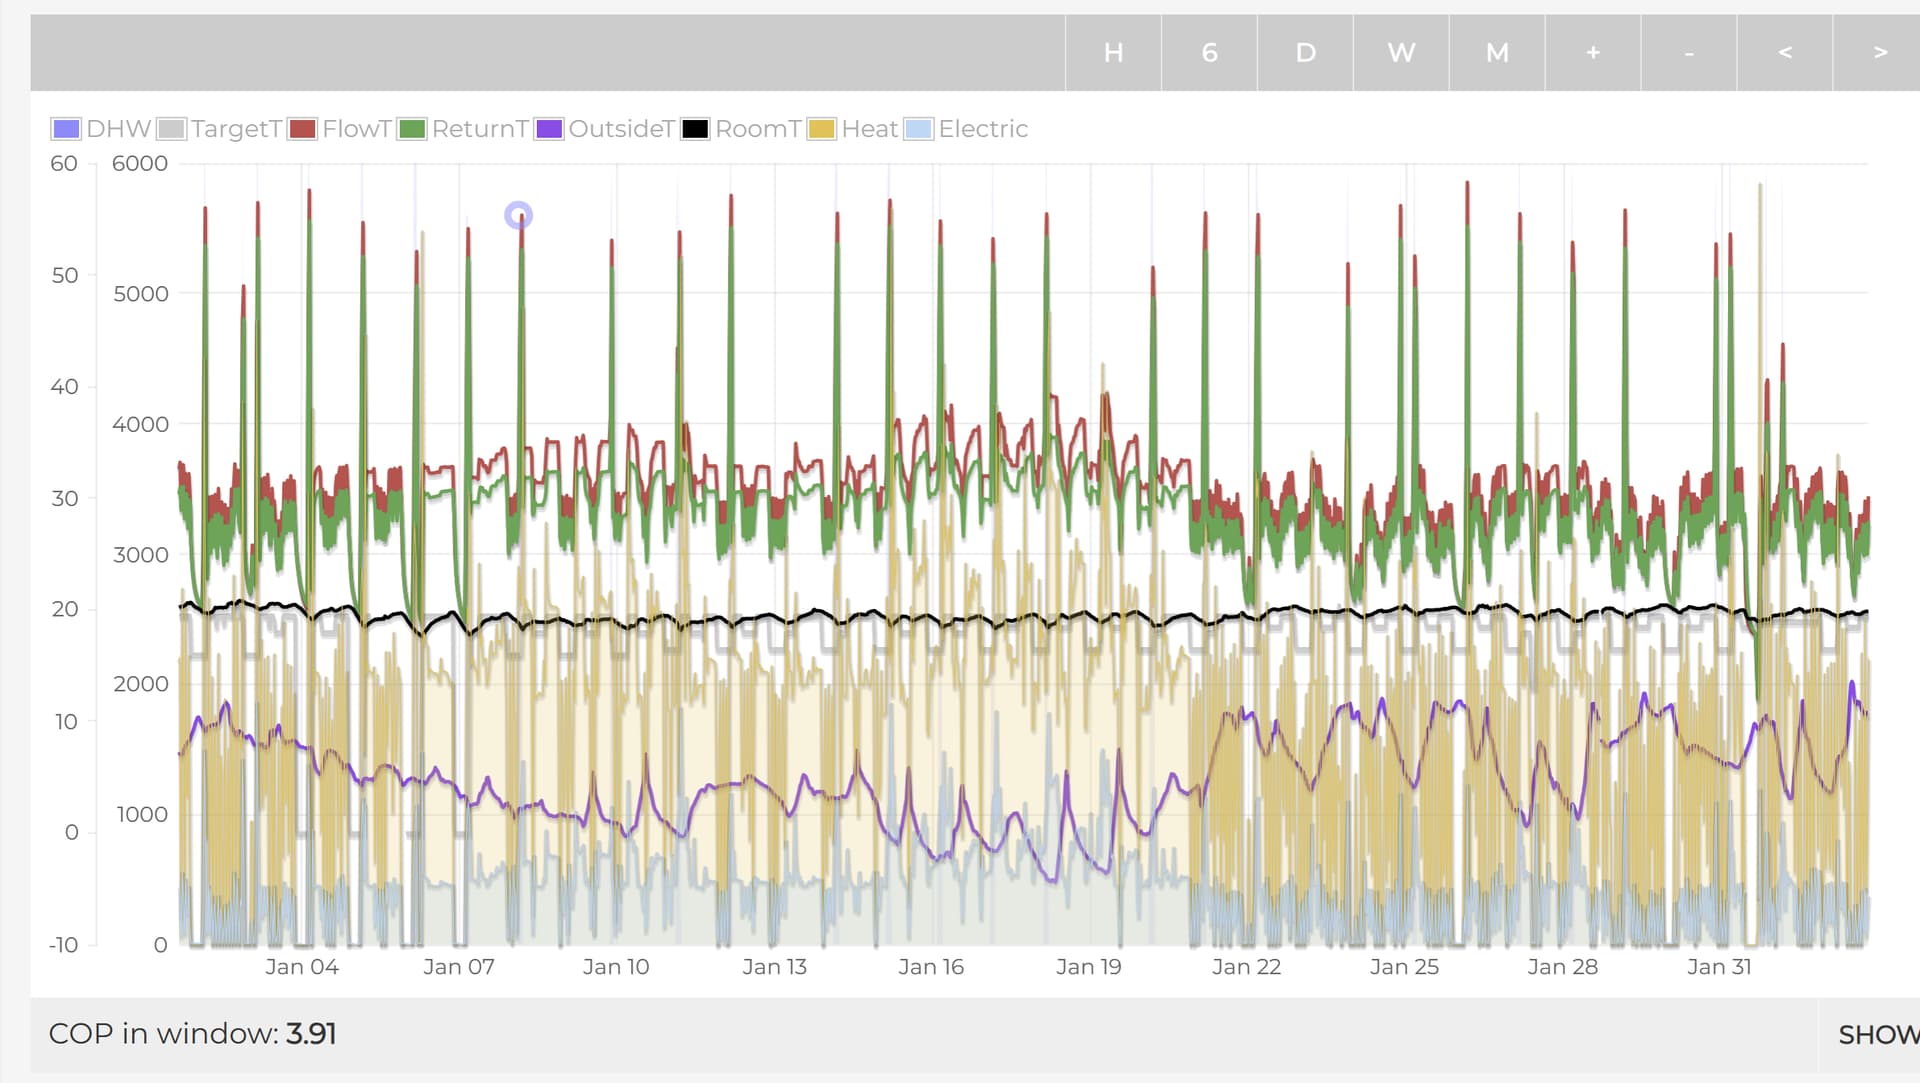
In the short term, for monthly figures, is there any way I could trick the graph into showing a calendar month? I can get reasonably close with the zoom feature. (screenshot below is from 01/01 16:30 to 02/02 18:30)