This morning I noticed that the main graph I use to monitor my system was looking odd, the times were wrong and it did not seem to be updating. I rebooted the system but that did not resolve the isse so I shut it down and then restarted it then it looked OK.
A little while ago I noticed the same thing has happened again but the shutdown did not resolve the issue.
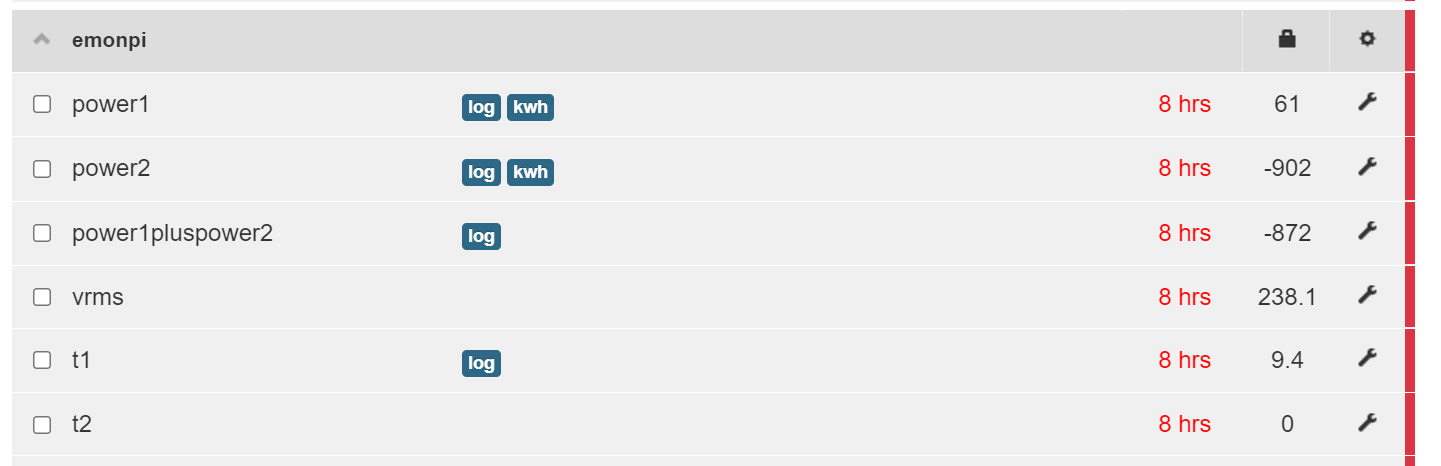
All Inputs for my emonpi are showing with 8Hr in Red in the column next to the values ( I think they are normally Green) but if I watch the inputs I can see the values are changing. See attached Screenprint.
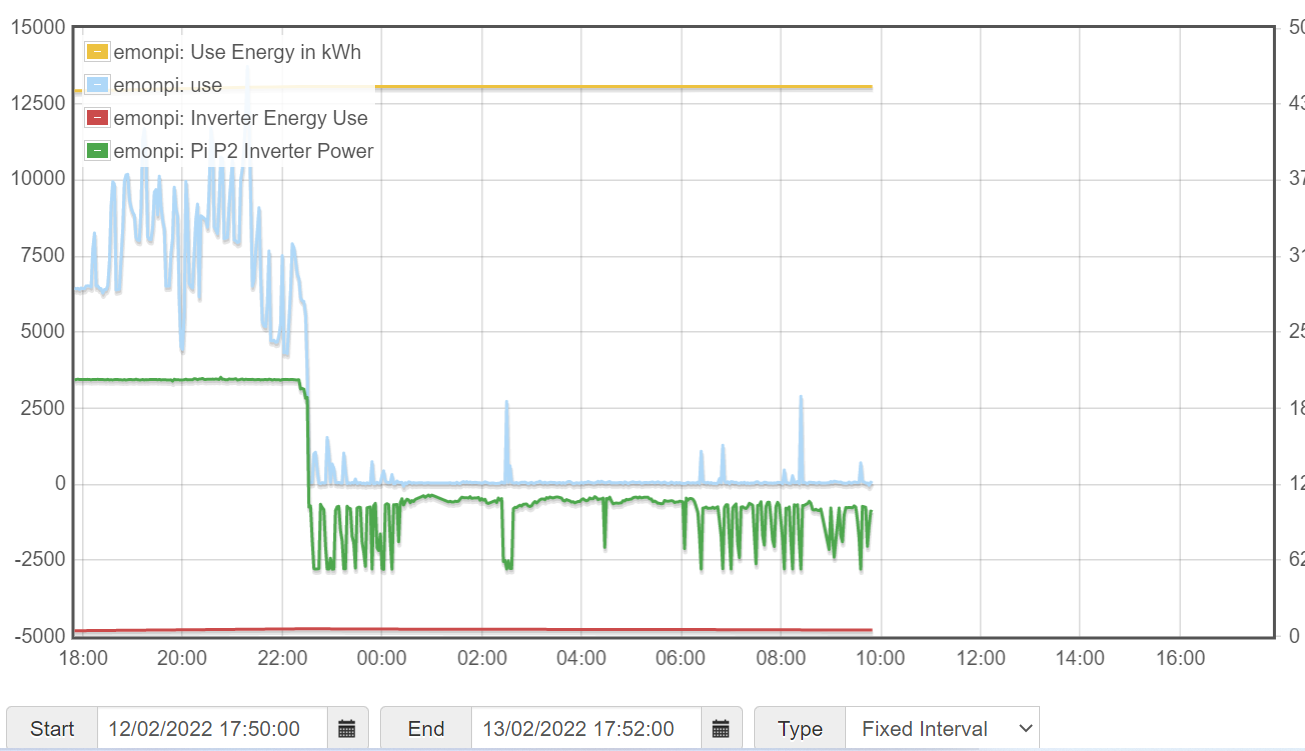
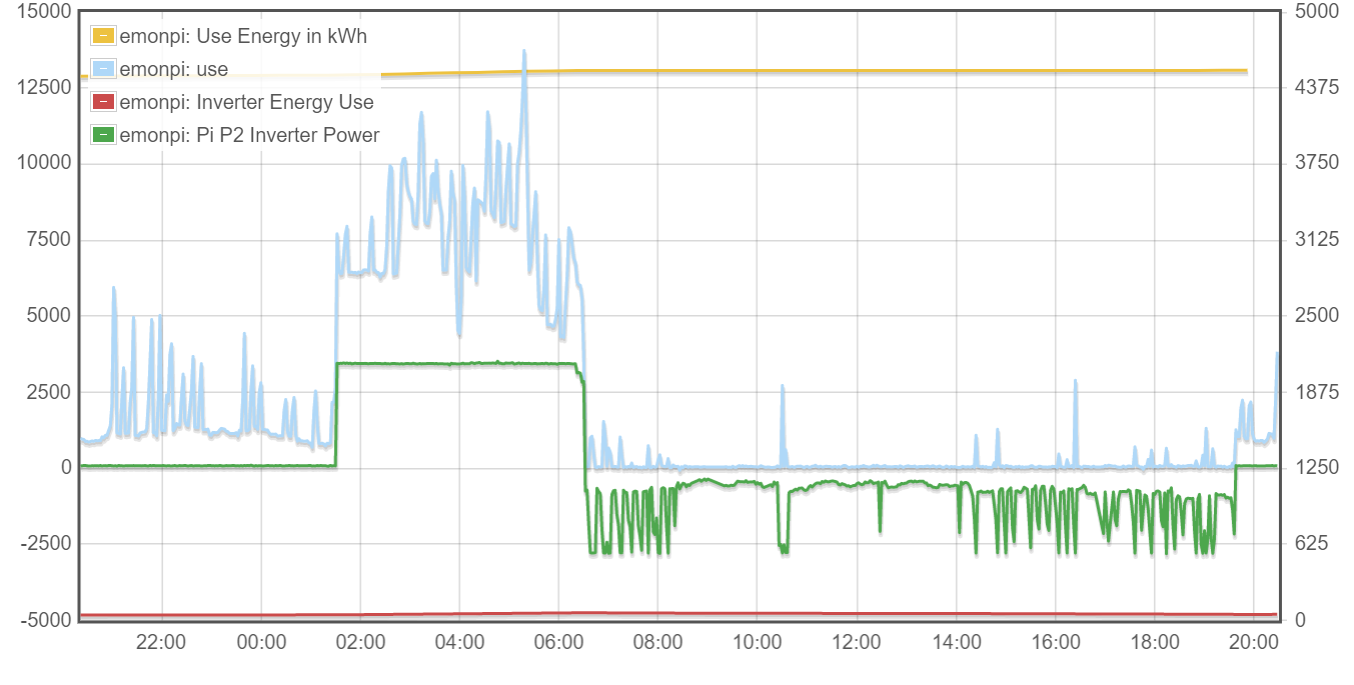
Also attached is a screenshot showing the graph, this profile of use is OK but the times are wrong, the Green line for my Inverter shows a drop from about 3000w to -2500 w as happening at about 2300 when this actually happened at 0630 which I can confirm from looking at the inverter.
The problem is that I don’t know where to start to look for the cause of this issue and I have not been able to find anything similar in the forum.
Also, I have now noticed that my graphs are updating but showing the wrong times. I wondered if the time zone or similar was set wrongly but I can’t find anything that looks wrong and I don’t know why that would have changed as I have not changed anything?
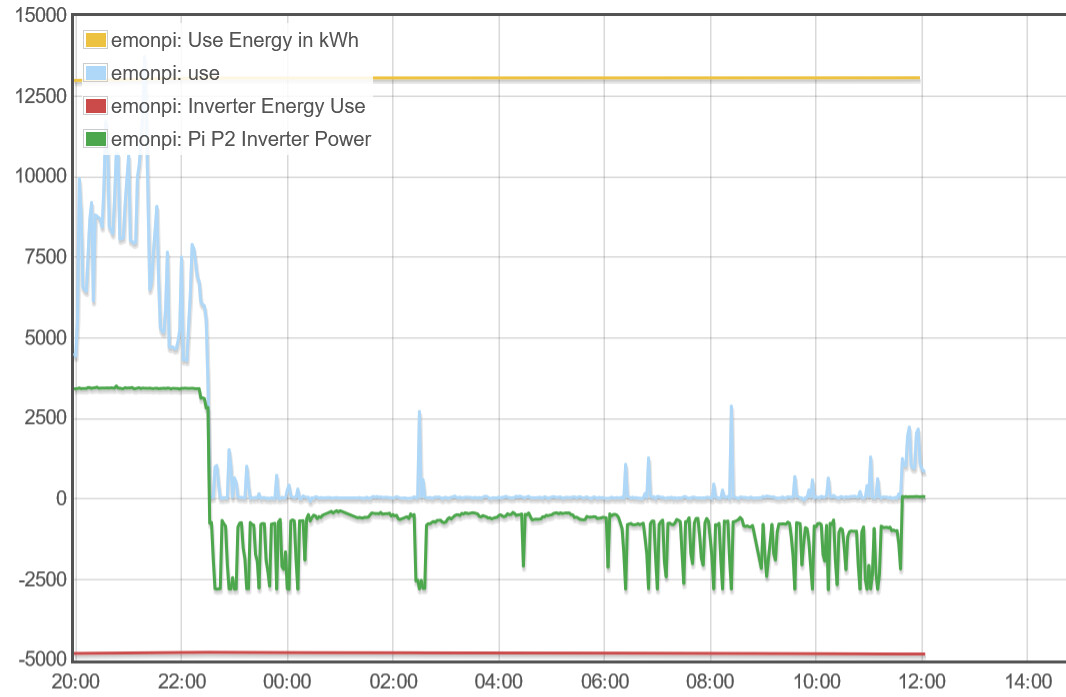
Updated graph showing that it is updating but the times are completely wrong, they are 8 hrs wrong which ties in with the 8hr showing in the feed list but I don’t know why or even if that is the problem
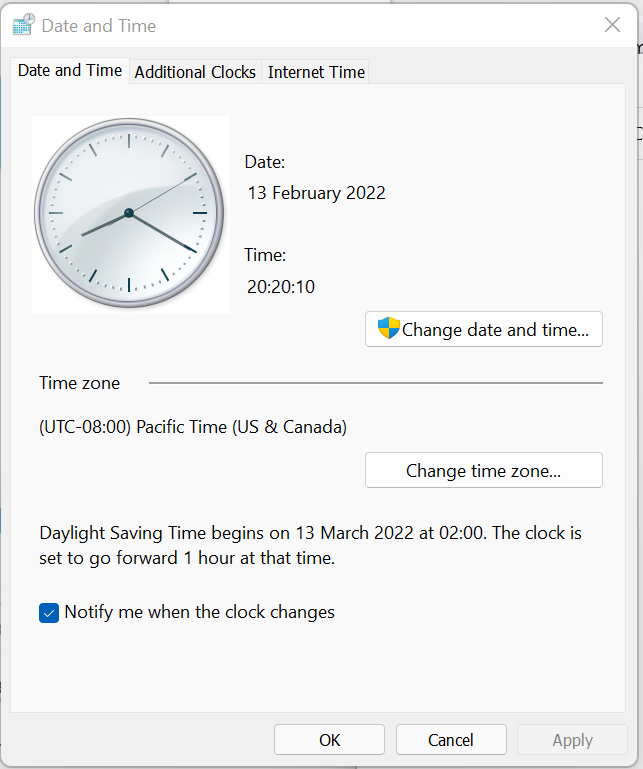
Timezone is part of it. How about the time itself? Is the machine’s clock set to the correct time?
(referring to the computer you’re viewing the graph on)
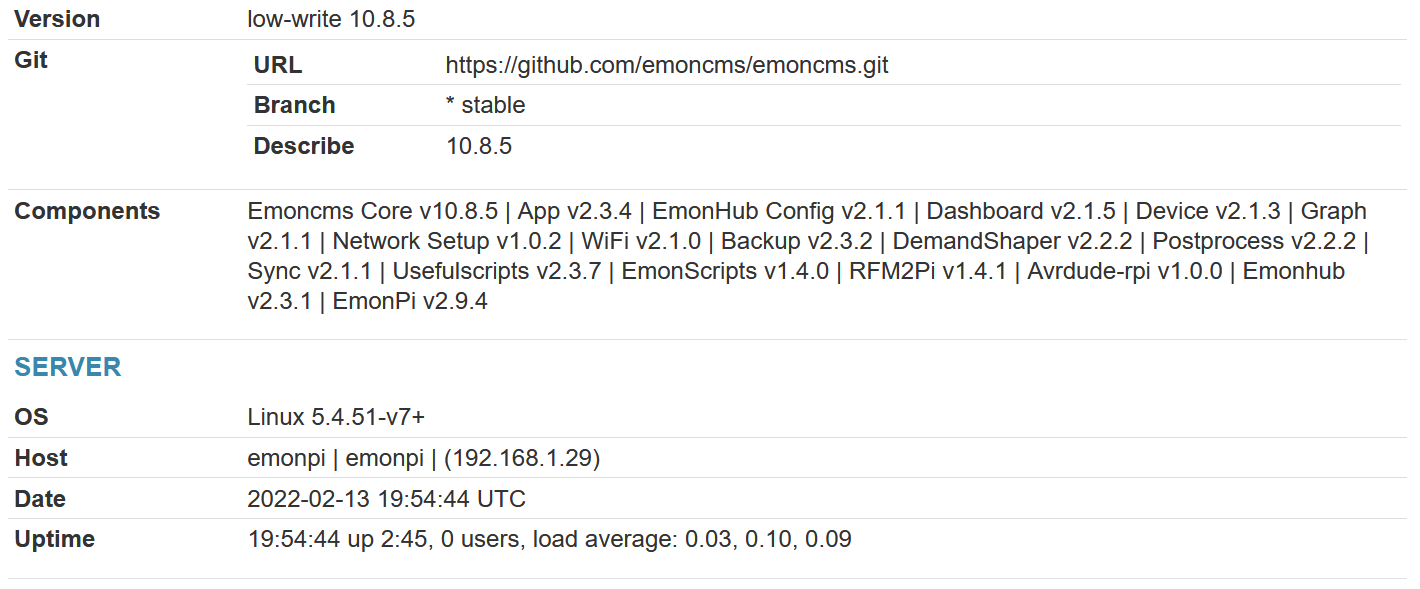
Something’s not right. Current time is 20 past the hour. Your post was made ~8 mins ago.
That would put the time at ~12 past the hour. But you say the time of 1954 was correct.
Seems as if something is set to the wrong time.
Well, that is interesting, I am using Windows 11 and I had to reimage the machine yesterday but the time is showing correctly however I have just checked and the time zone is not! guess what the time zone is showing…
So I think the problem is resolved although I don’t understand why the emonpi is choosing to show the graphs and feeds based on the time zone on my PC.
It’s not the emonPi, but as you’ve discovered, your Windows box.
When you reimaged it, Windows detected a new installation, and set the timezone accordingly.
(New Windows installations default to US/Pacific timezone)
If I understand it correctly, (I haven’t run emonCMS for quite some time) that screenshot is showing
the Raspberry Pi’s clock vice the clock on your local machine.
And just to add why I thought it was OK this morning I rebooted my emonpi and shut it down from my Windows PC than when I restarted it I logged in on my Apple iMac desktop !!
IIRC it’s because emoncms can and does run as a shared system with users all around the world. So the system stores its data with UTC timestamps (I think, or maybe the time on the host that runs it? @TrystanLea would know for sure …) whilst most of the users want to see the data expressed in their local timezone (i.e. the timezone of the browser) so the sun goes up in the morning and sets in the evening.
Timestamps should always be stored as UTC as that is immutable. If you send the data as a local time, emoncms converts that to the equivalent UTC time. When you then call for that data, you need to tell the system what any offset might be for your position.
There has been talk about setting what the TZ is for a specific sensor/measurement but it never went anywhere. Currently Emoncms assumes the sensor readings are made in the same TZ of the user.