Hi all:
I’m at my wit’s end. I’ve been trying for days to use an sct013-030 current transform to measure voltage, using an ADC pin on a esp32 development board - details in footer
I’m using the circuit described on openenergymonitor “interface with an arduino”. Others have used the same circuit with an esp32 with no problems.
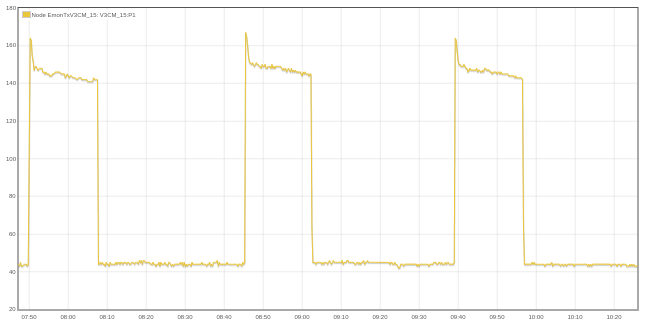
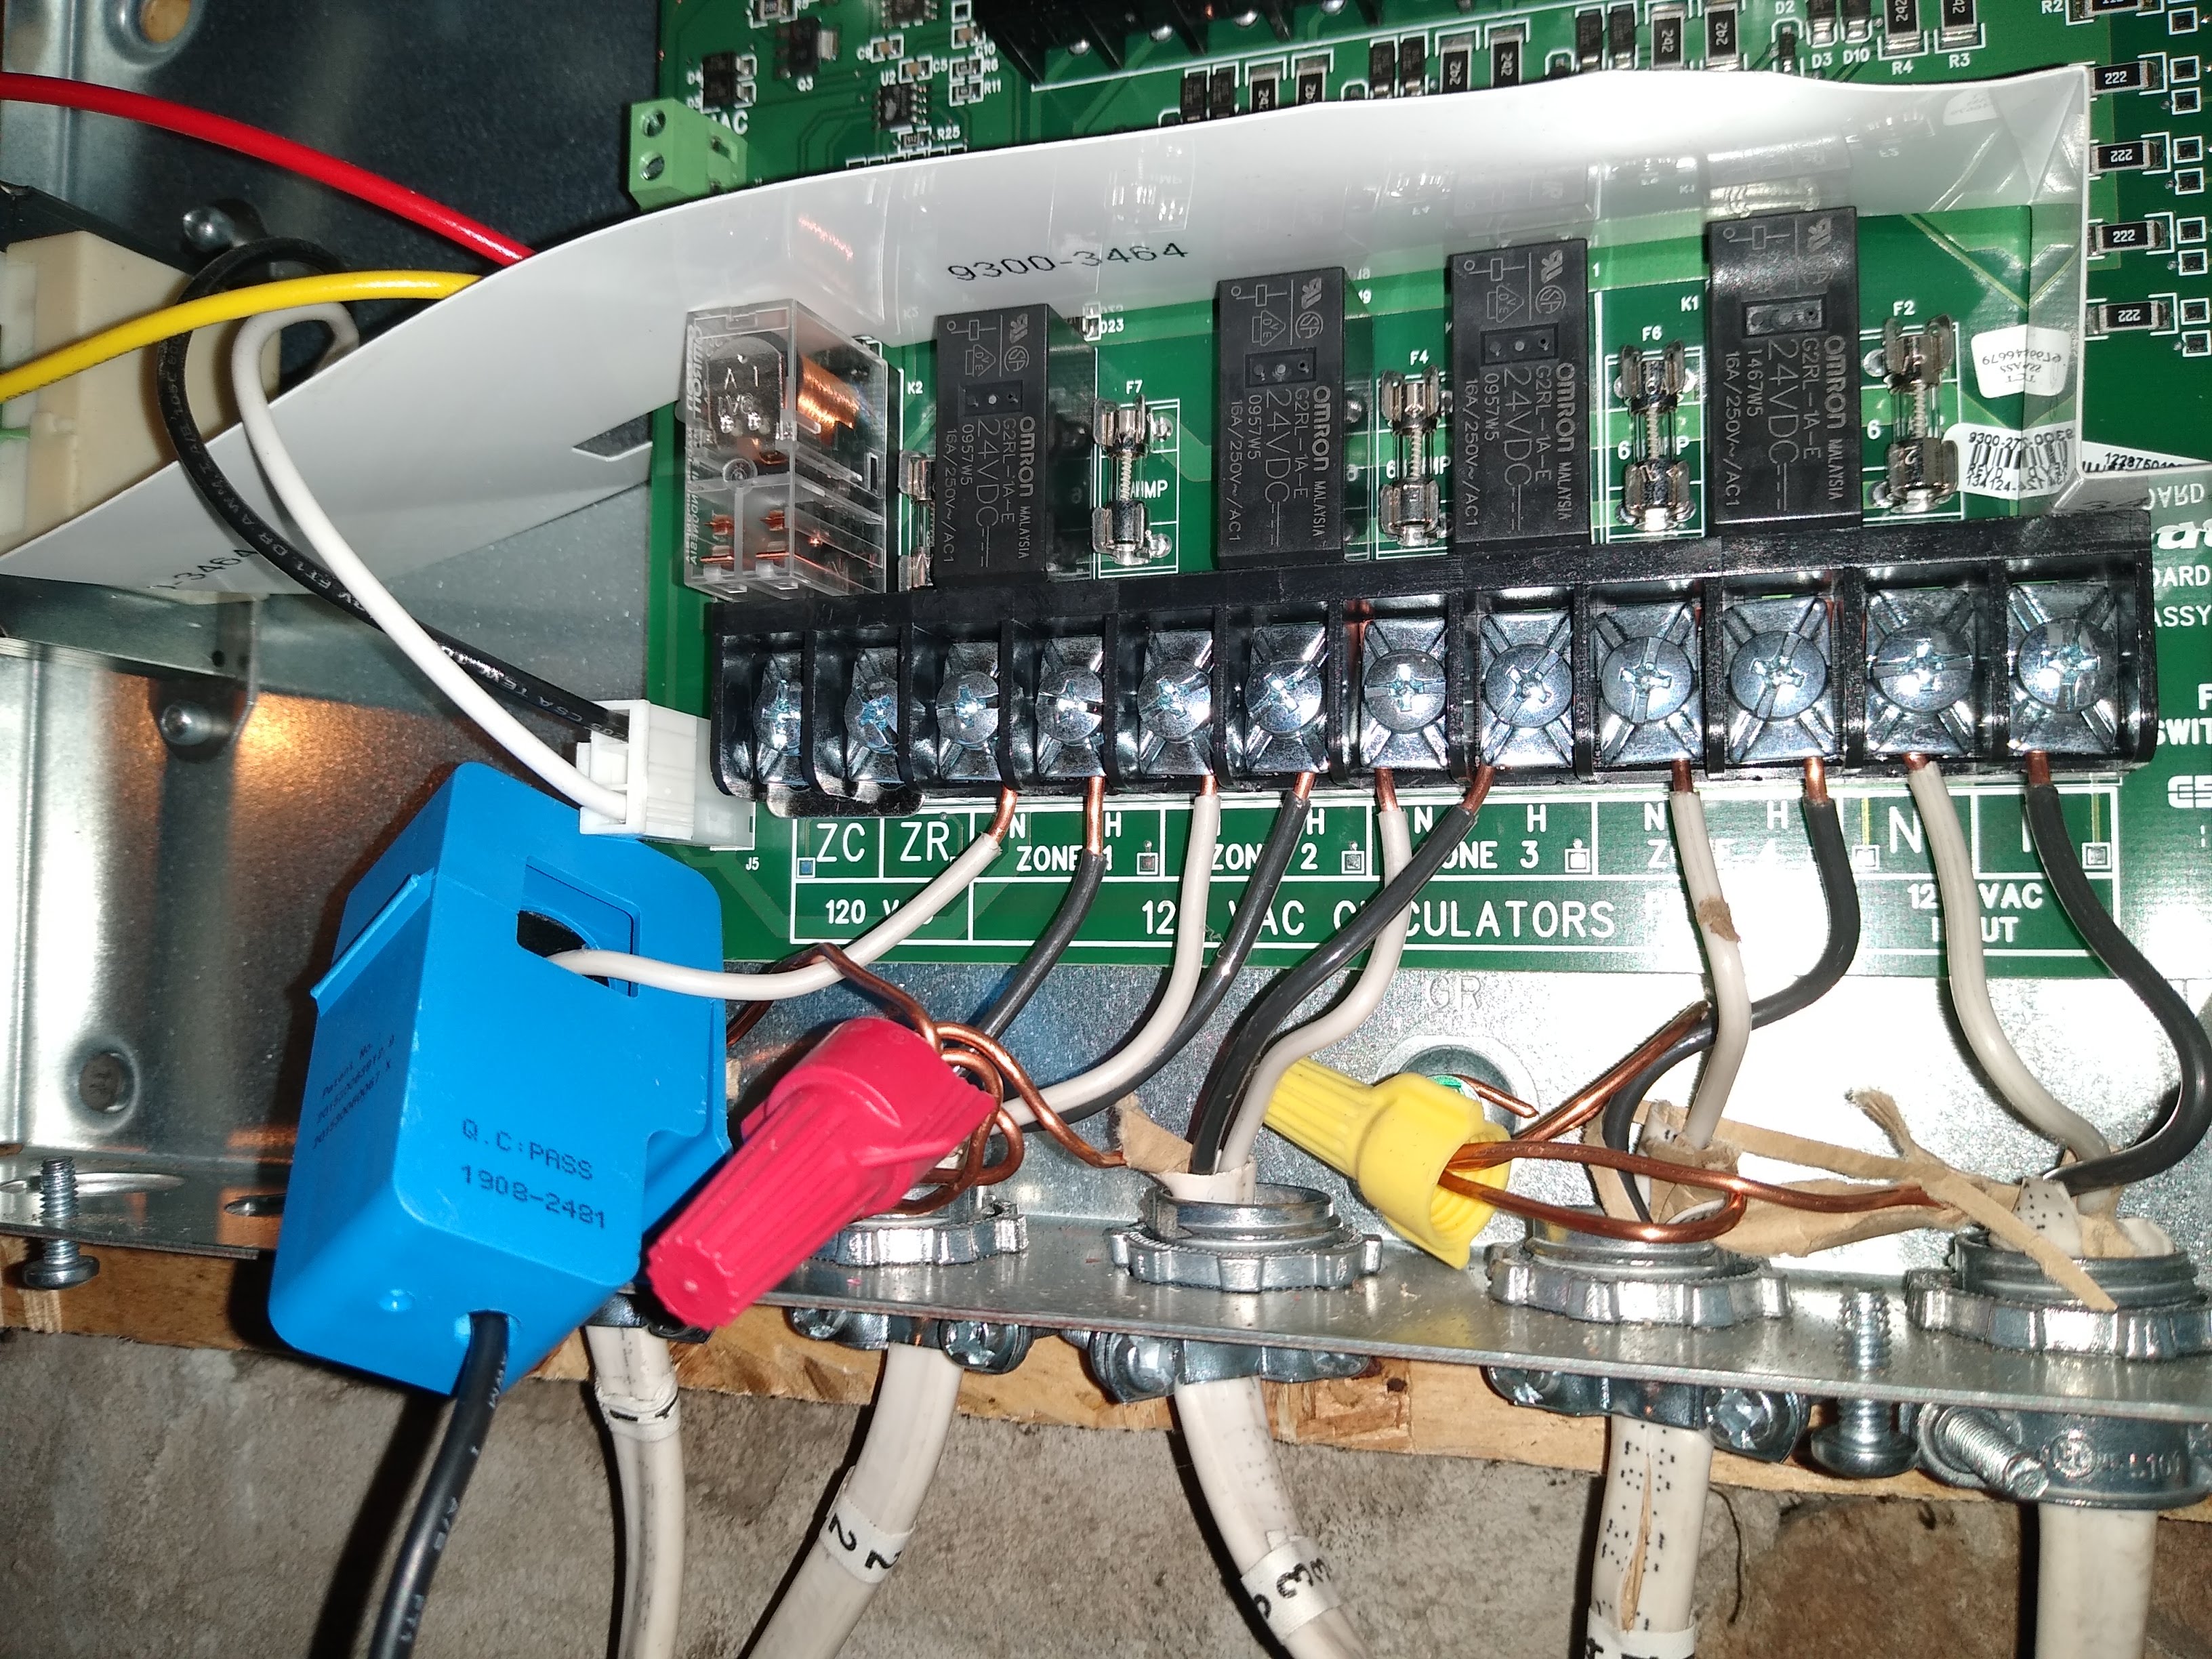
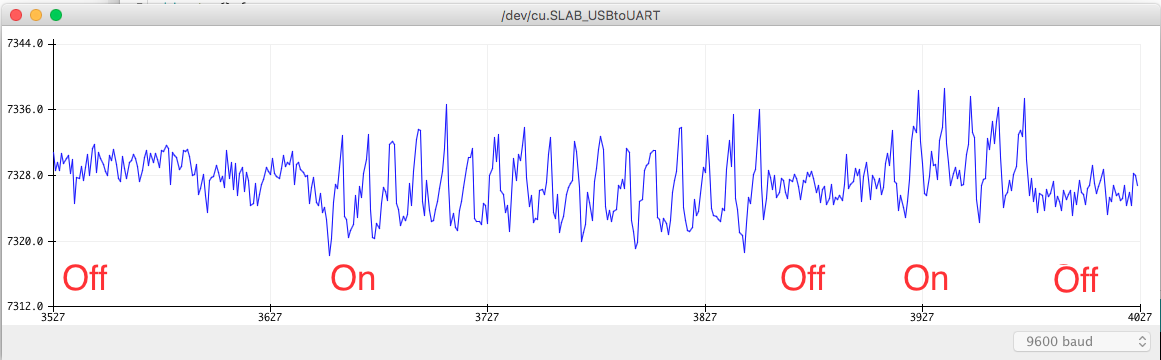
All I’m really trying to do is detect the on/off status of a thermostat. Accuracy in current/voltage detection is only needed to the extent that I can determine on/off status.
Would appreciate any help you can give. I don’t quite know the best place to ask, so if you’re not able to help, but can point me in the right direction, that would also be a huge help. See my issue below:
Expected Result:
- I should get a value in amps when calling emon.current(34, 30)
- The value should be 0, or very close, when no current is flowing
- Some small fluctuations in the result due to noise are expected.
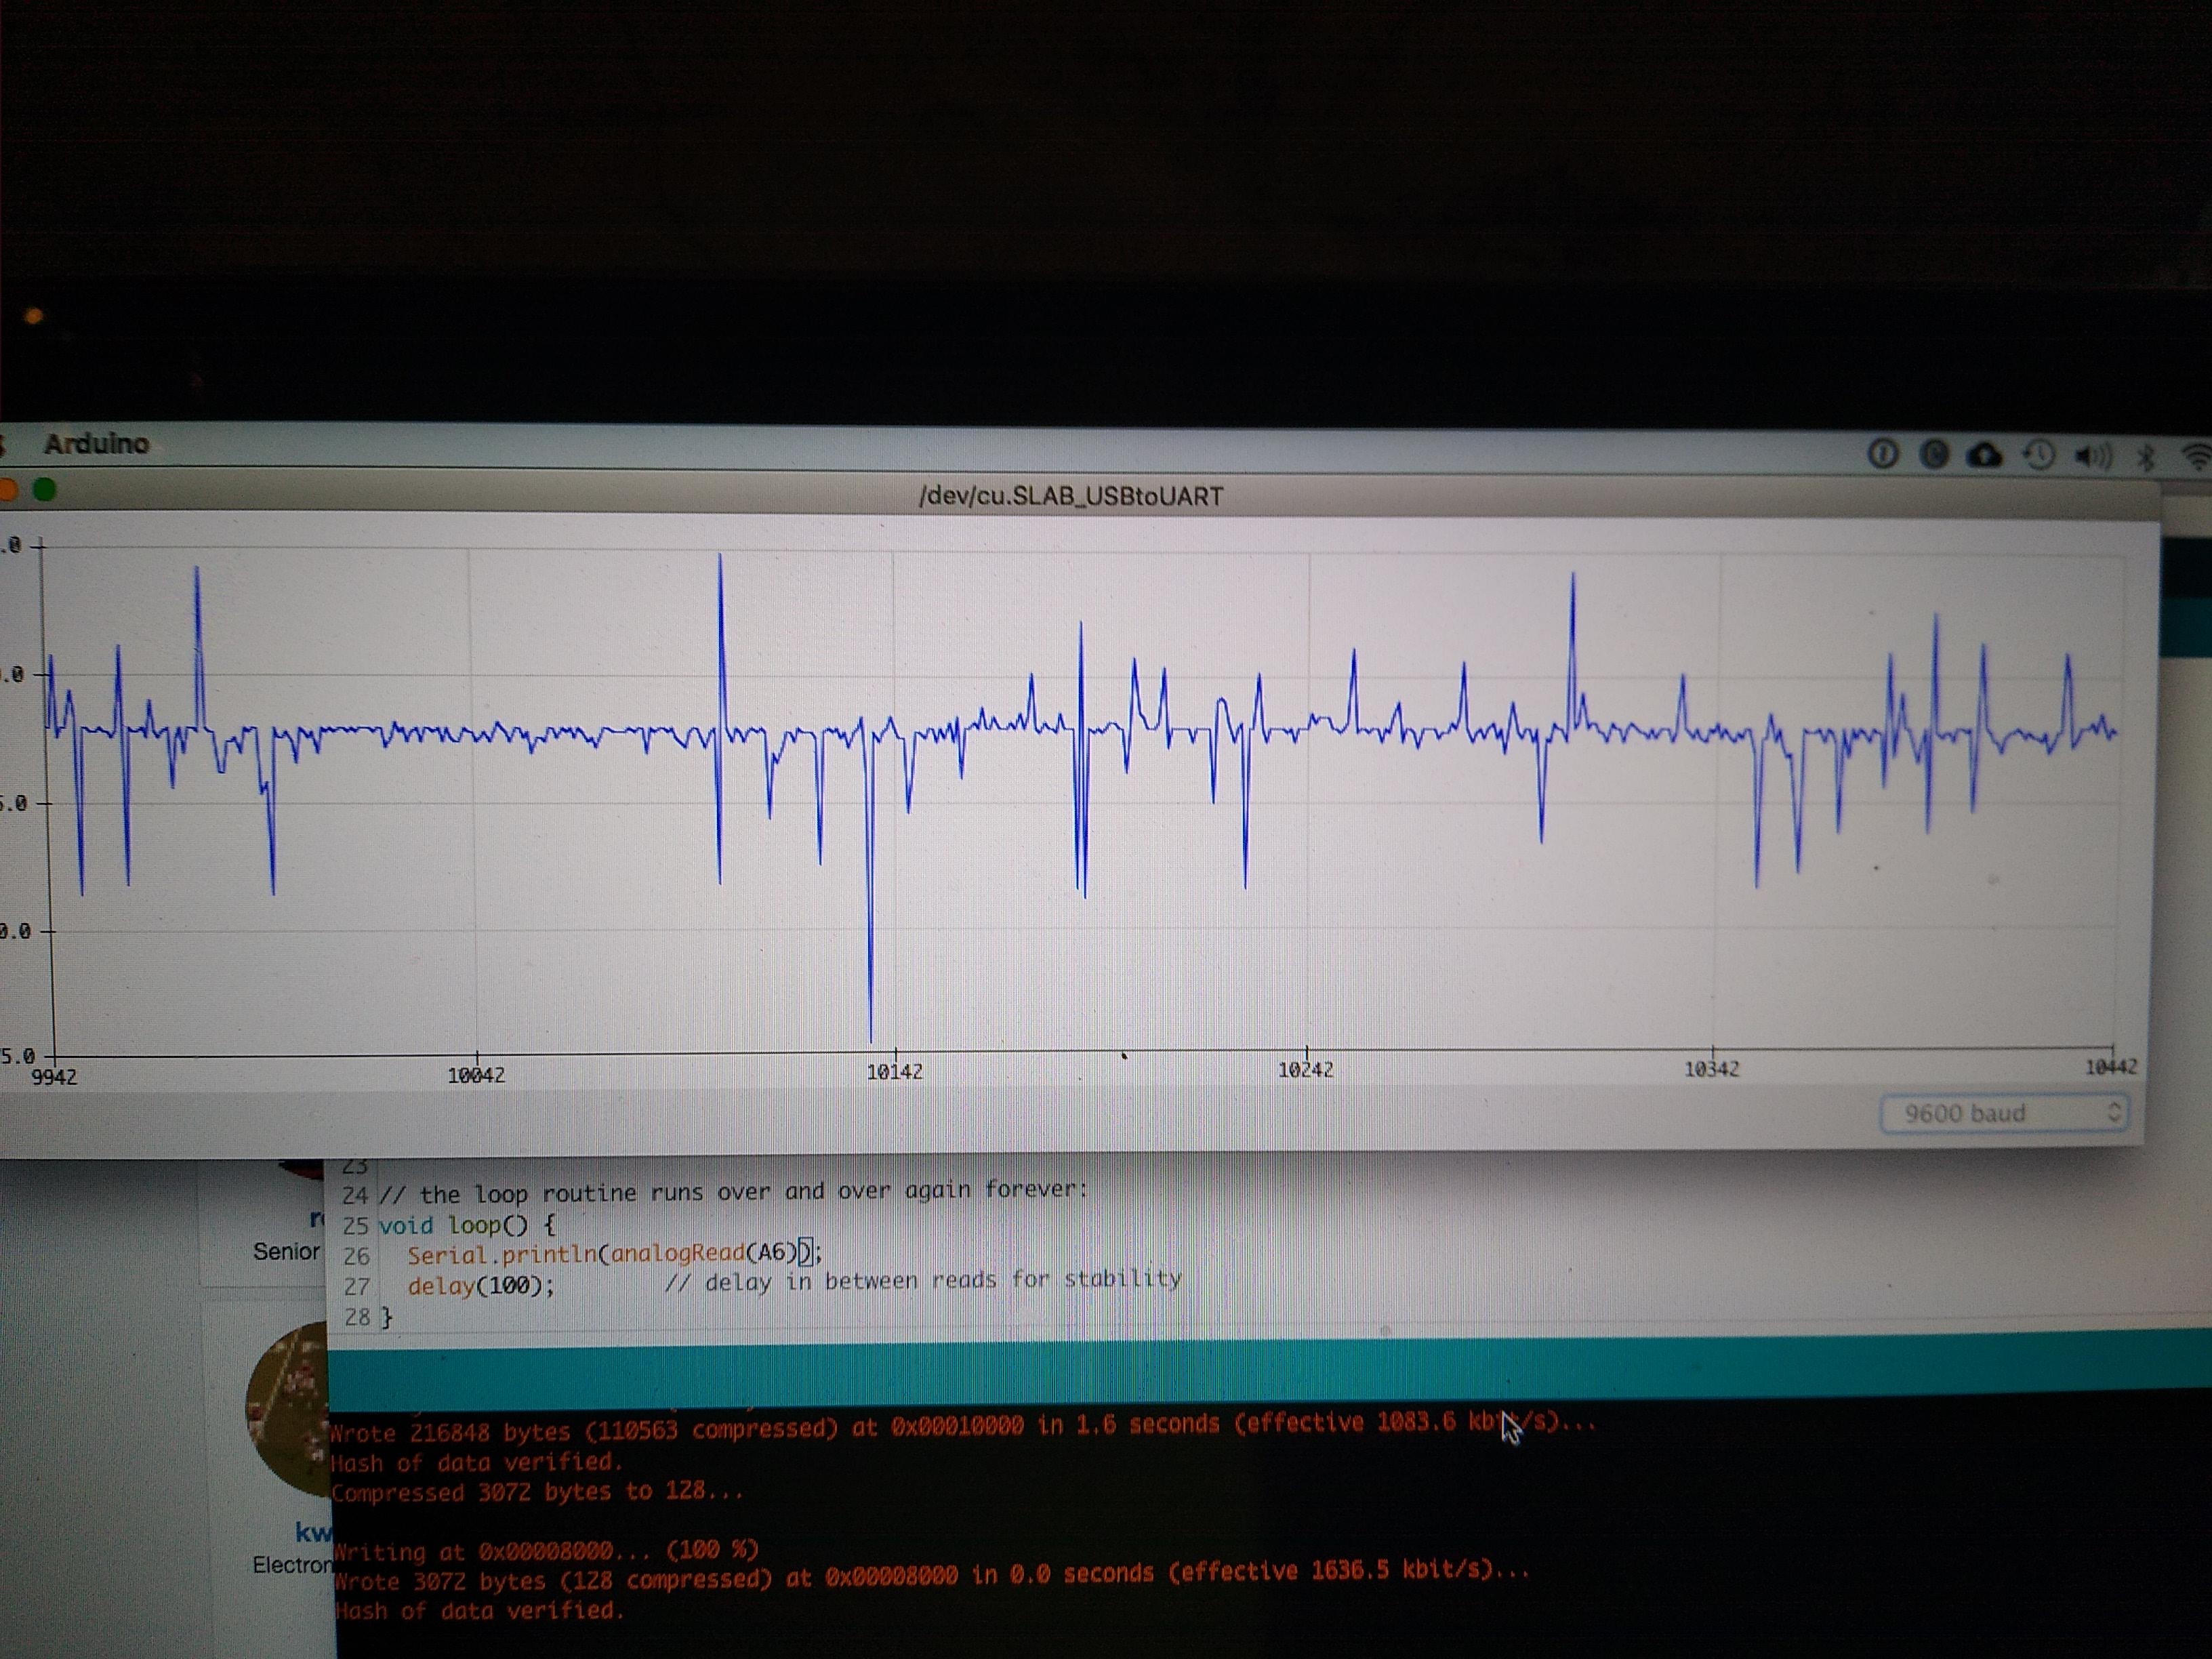
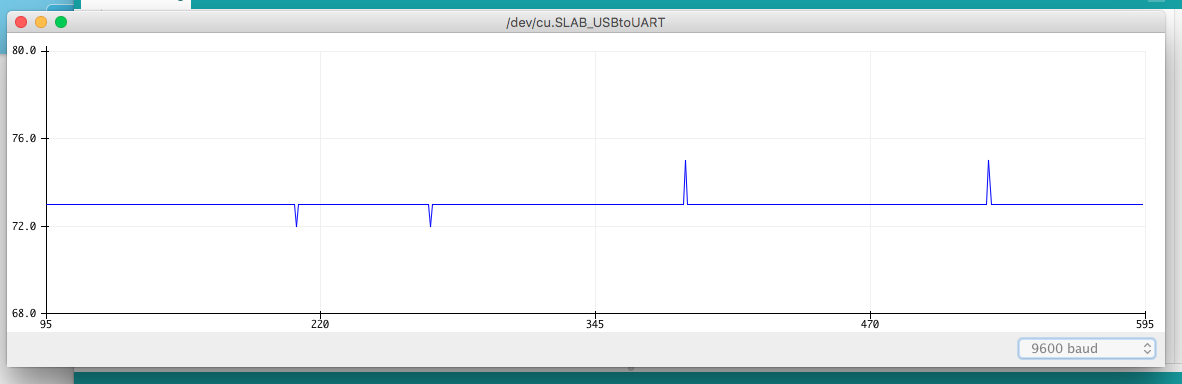
Actual Result:
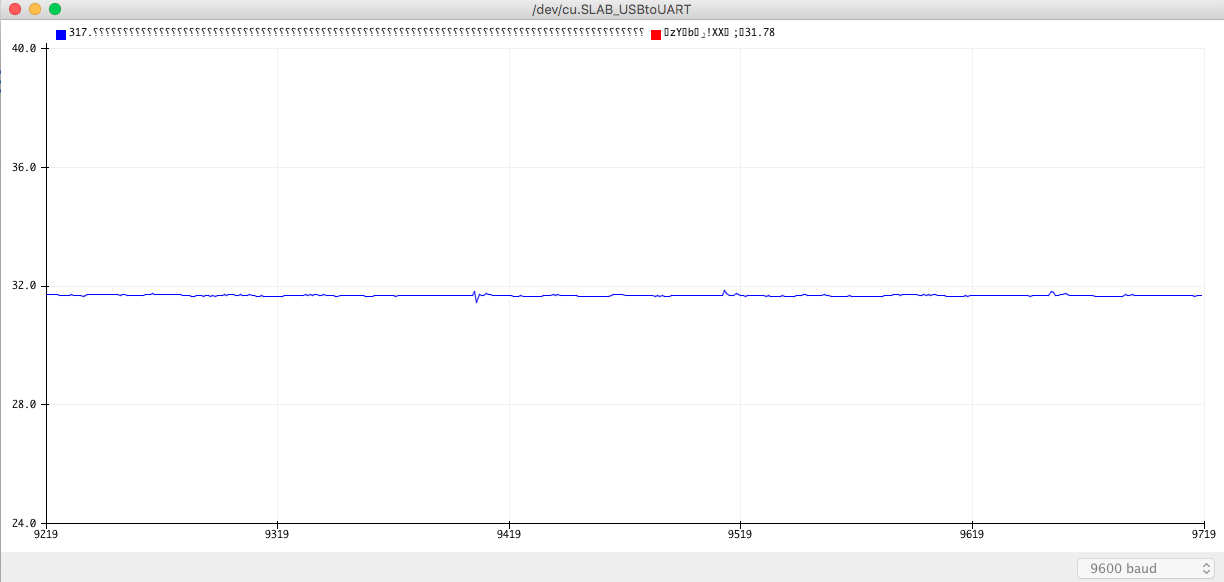
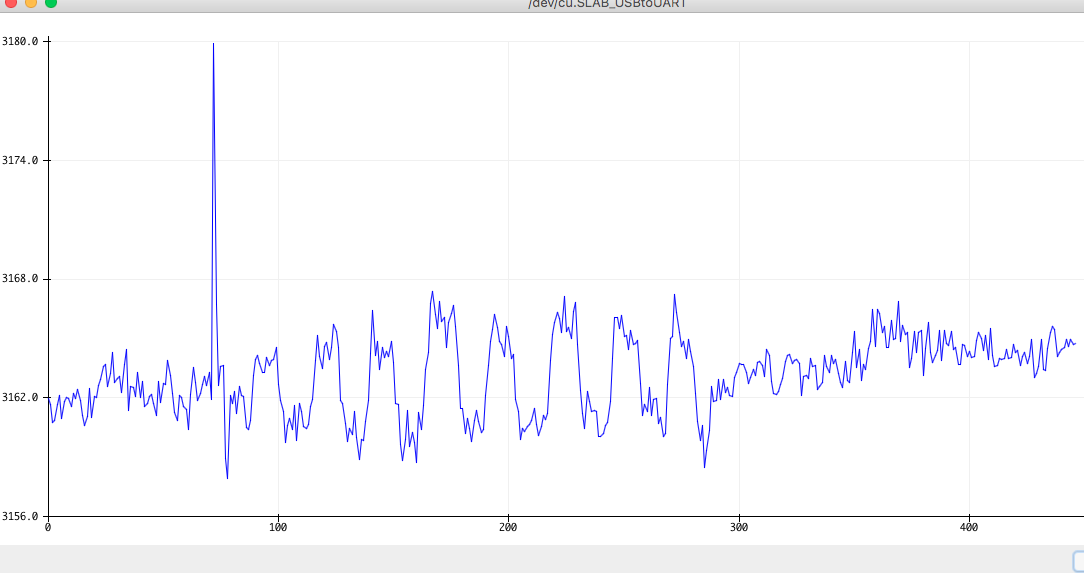
- When current isn’t flowing, I get a value around 73 when calling emon.current(34, 30)
- When current is flowing, I get the same result.
- The value is constant around that number, with some minor fluctuations
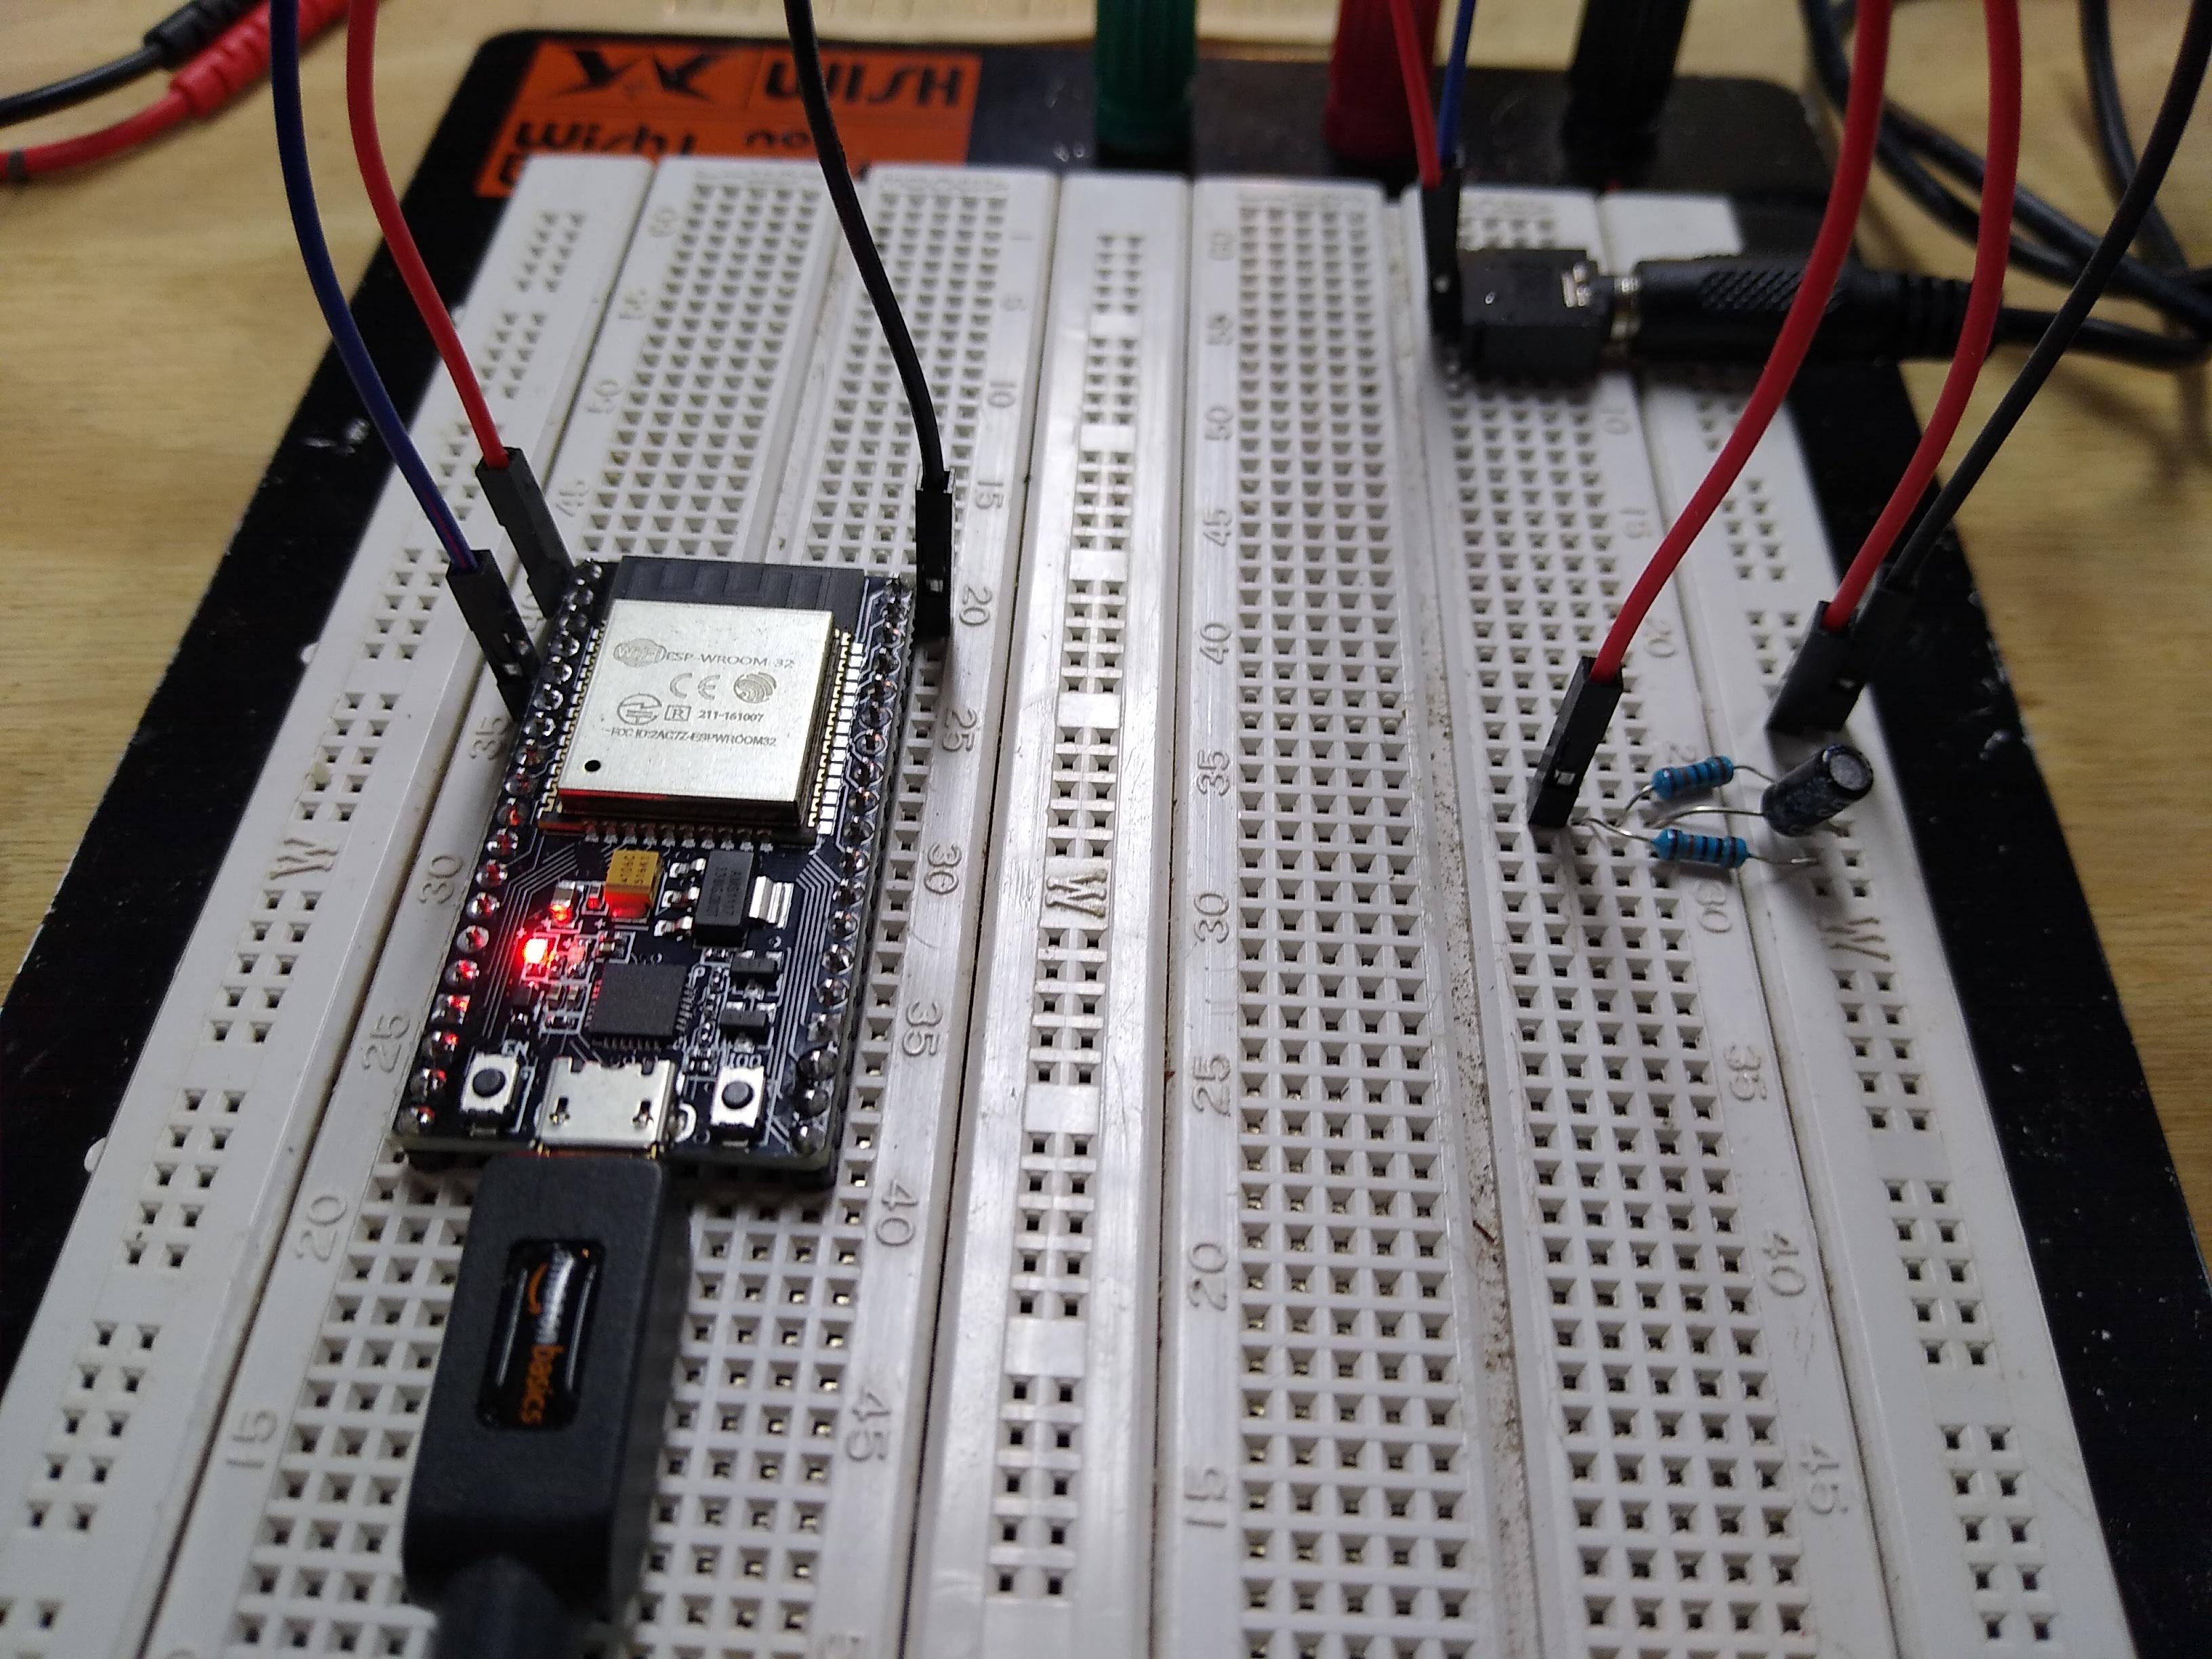
Circuit Details:
- The SCT013-030 is a voltage type and has a built-in burden resistor. Its output is between 0-1V.
- I’m using 100k divider resistors
- I’m using a 10uF cap
Code:
#include "EmonLib.h"
EnergyMonitor emon1;
void setup() {
Serial.begin(9600);
}
void loop() {
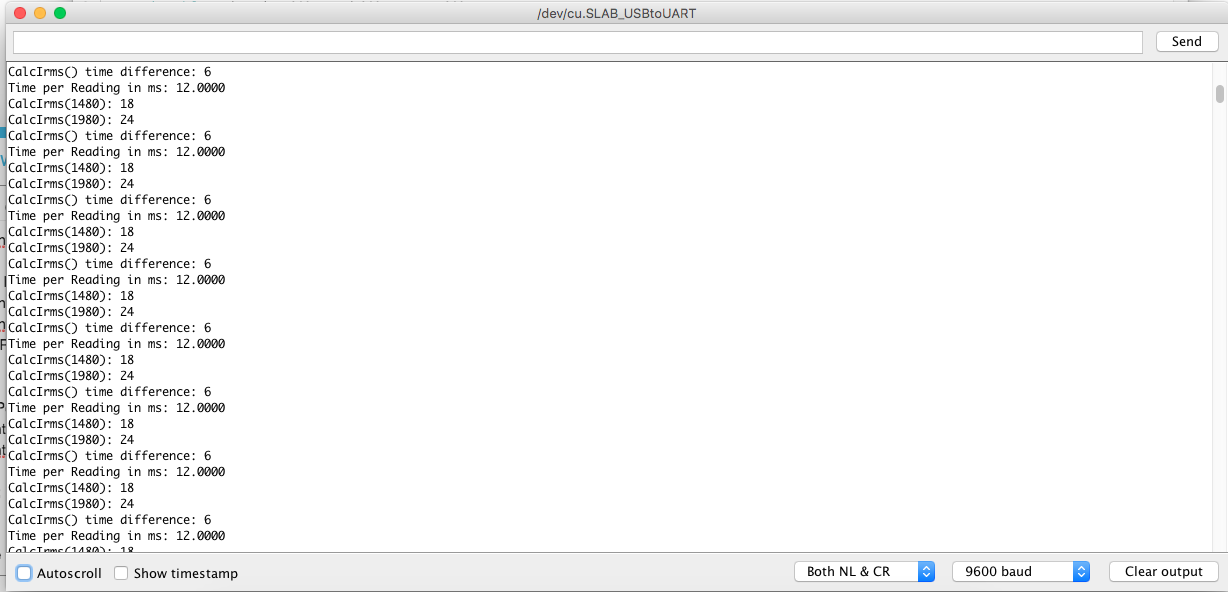
emon1.current(34, 30);
int amps = emon1.calcIrms(1480);
Serial.println(amps);
delay(100); // delay in between reads for stability
}
What I’ve tried:
- Replaced all passives
- Replaced SCT013
- Replaced esp32 development board
- Checked, double checked, triple checked wiring
- Tried sct013 on bench, around multiple cables
All leading to the same result.
esp32 development board: www.amazon.com/gp/product/B07QCP2451/ref=ppx_yo_dt_b_asin_title_o06_s00?ie=UTF8&th=1
sct013-030:
Sorry about the notes above - I can’t add enough links, since I’m a new user
Thanks for your time.

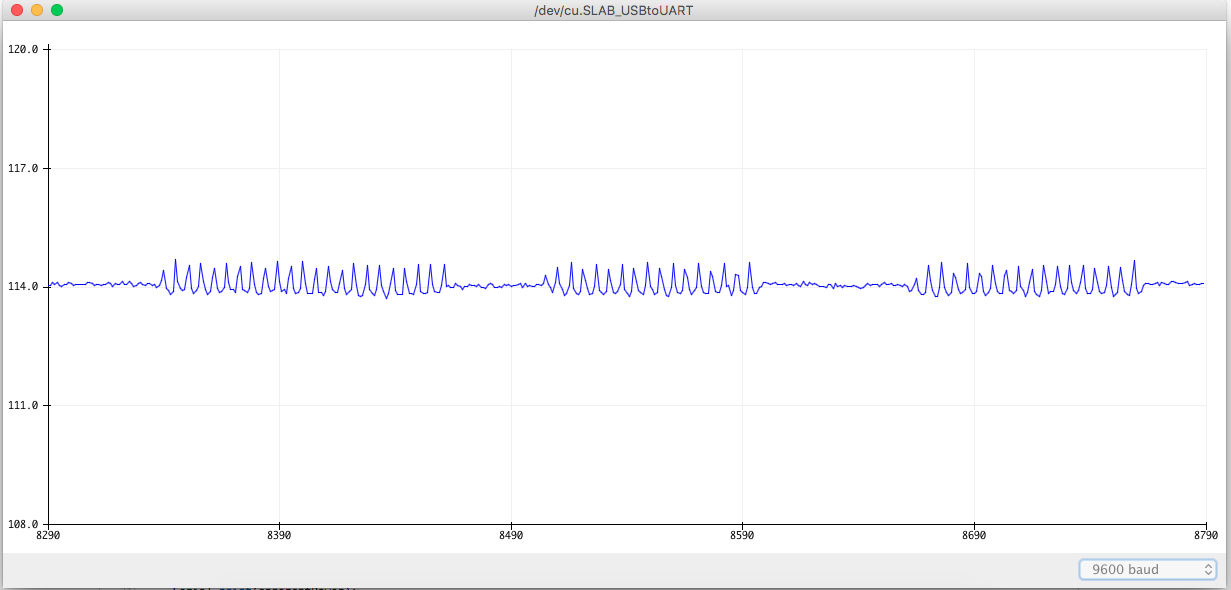
 And, there’s now no issue with noise when multiple heating zones are active.