Thanx, I’m not sure if I did it right, or if it just doesn’t work as expected.
I have two feeds: “Outside” and “Garage”.
My feeds are setup as follows:
For Garage: “Log to feed Node:1:Outside VS Garage”
For Outside: “Log to feed Node:1:Outside VS Garage”
and “- input Node:1:Garage”
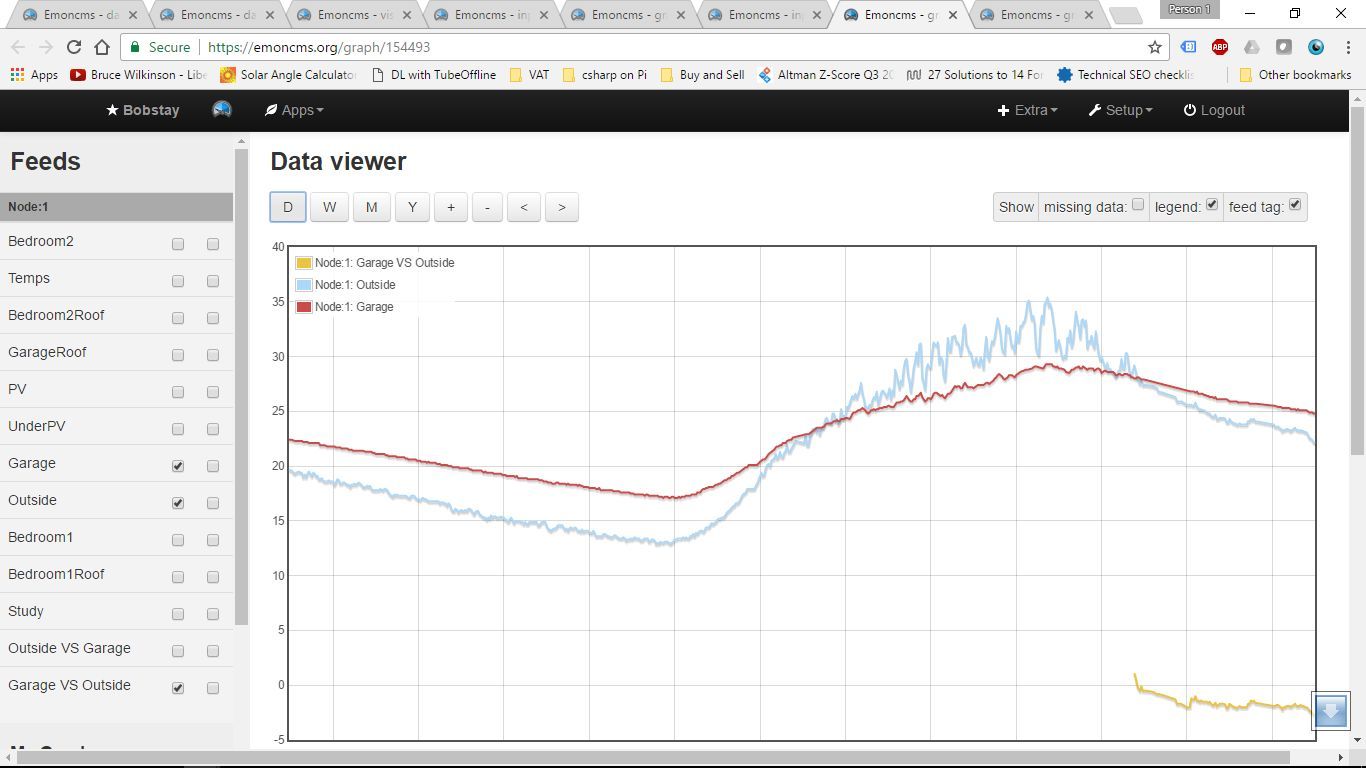
Then when I view the graph in “Data viewer”, I select “Garage”, “Outside” and “Garage VS Outside”. The results are quite strange, to say least. Please see the attached screenshots.
I was expecting a line running in the middle of the other two lines, but it shows sporadic information.
Both the “Garage” and “Output” temp sensor readings are read with the same pythons script, run from crontab every minute.
Thanx pb66. I changed the channels and will see what it does. For some odd reason, I can’t upload the screenshots now. The “Uploading 0%” status on the bottom just runs infinitely.
Only problem now, is that the values goes below 0 degrees Celsius, which is probably kinda expected since the hot and cold values “change places” when it cools down at night. That’s fine for now, cause then I can see in winter if my new thermal insulation makes the place warmer