Recently changed my feeds according to learn section about solar pv. Added “Allow positive” and so on after having trouble with “onsite use” and other parameters. It seems to add up right now since my changes were made but then I’m experiencing this issue. See attached image. The “use” graph is static as you can see. This happens more or less only when using the “D” button for last 24 hour. Though if refresh the page it looks ok. This has been going on fore a couple of days now so it is not just the first day. I have the same issue on multiple browsers, units (iPads, phones) even after clearing cache.
Anyone experienced the same ?
Using 9.8.0 on a RPi 3. Use feed from CT’s. Solar feed from SBFspot software via Node-RED into emoncms.
So, answering my own question. This seemed to be because I had selected PHPFINA 10 sec interval on a feed that had an input interval of 60 sec. This was probably messing things up in calculations done on this particular input. I thought it just saved the actual value every 10 second without being dependent on having the same interval of “input”.
I changed my feed interval (PHPFINA) to 60 sec. and now I do not see this problem anymore. Maybe someone with more understanding of the PHPFINA engine can explain this behaviour.
The 10sec PHPfina feed will save the current value every 10s if it is called every 10s (or less). Because you are updating the input every 60s, a call to update the 10s PHPfina feed is called every 60s when the input is updated, at that time it will record the current value to the correct time slot and “fill in the gap” with null datapoints (empty datapoints) as it has no idea of what has happened since the last time it was called 60s ago.
When drawing a graph from that feed there is then only a 1 in 6 chance of pulling out valid datapoints rather a “null” data point as the good 60s datapoints will all be separated out with 5 null datapoints between each occurrence.
See, like I said “someone with more understanding of the PHPFINA engine can explain this behaviour”.
Thanks pb66!
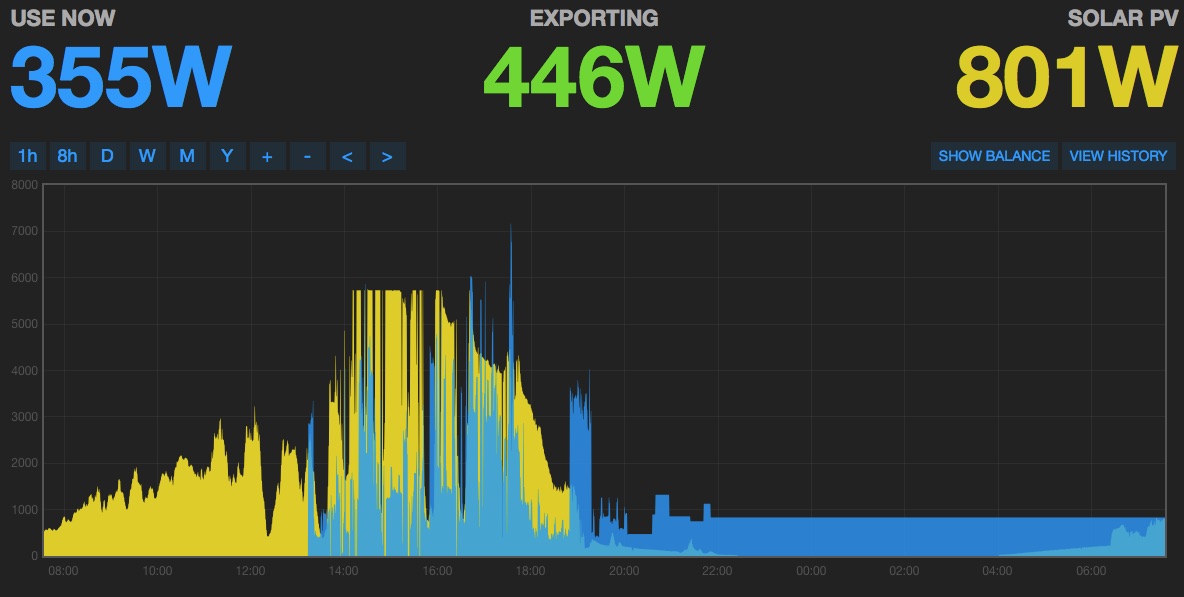
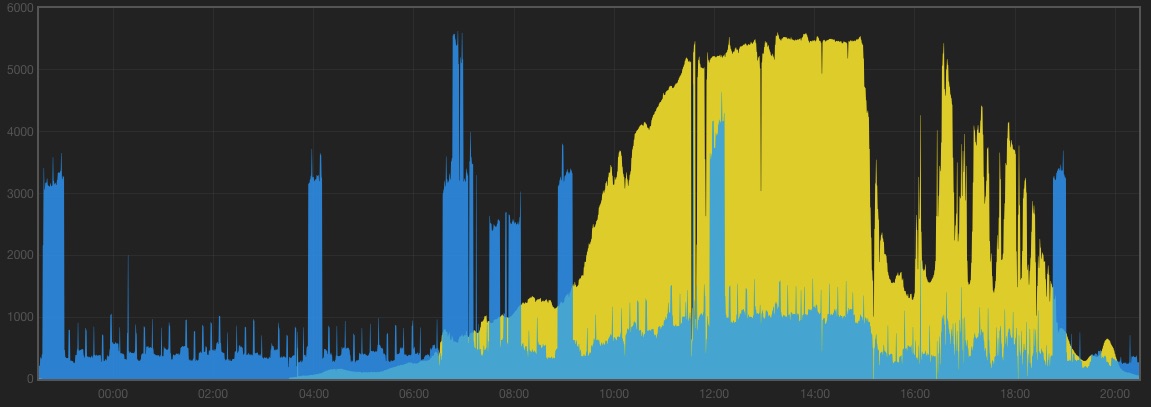
While at it. Could you explain this behavior ? While having a great sunny day as seen in this graph. The “use” tends to follow the curve of solar power. How can I adress this issue ?
I’m using 3-phase sketch. CT’s on three phases. Solar watt power is collected from my SMA inverter via ethernet and pushed to emonCMS via Node-RED MQTT.
The CT’s are connected at the last point before the grid (looking from inside my house). So they are registering negative power when exporting, positive when importing.
Are the Blue and Yellow graphs to the same vertical scale? If yes, the question then is, why does the “Use” not go negative (exporting) when the PV input exceeds the background use of around 300 - 400 W?
They should be the same scale I believe. The reason for “Use” not going negative is that I have made that calculation as you can see in my attached image of the “PacTot” process. “Power 1-3” is added to “Solar” which then always give me the actual “Use” in house. I think this is mandatory for making the app “mysolar” work as planned.
I think I see what is happening. Your c.t’s are measuring Nett grid power = Use - Solar(current).
Your Use feed is recording Solar(SMA) + Nett Grid = Solar(SMA) + Use - Solar(current).
Therefore, if your SMA inverter and the three c.t’s × voltage disagree on the power from your PV, you will get a contribution proportional to the error - adding or subtracting depending on which way the error is.
Did you calibrate the emonTx accurately? I think that might be where the error lies.
Ok. I just recently sorted out all my inputs and feeds and got the emonCMS and mysolar working as it should. Therefore I have just started comparing my electricity companys numbers (they are behind 4-5 days) with my “mysolar” history which gives me, import/export for every day.
They seem to be almost the same, I have seen some differences like 0.5-0.9 kwh or so in 24 hours on import or export. This feels ok for me. Therefore I have not yet managed to get my friend over with the amp meter to calibrate my CT’s.
EDIT: Aha, are you saying that the voltage might be changing when producing this amount of solar power and thus giving this error ?
[Edit]
If your SMA inverter can display the three currents and voltage, and if it’s possible to put your c.t’s on the PV infeed temporarily, you could use the inverter display to perform the calibration.
I have started to see the same problem on my solar app although I haven’t changed anything. The house power and solar graphs flatline for about the last hour and a half but if I refresh the app some time later the point in time at which the flatlining starts moves on and anything previous to where the flatlining starts appears as normal.
I want to try Anders’ solution by changing my PHPfina feed to 60s but I can’t seem to be able to edit it. If I go to setup>inputs and click the spanner icon next to the input for my house power I get the process list setup. If I then try and edit the house power input I get ‘edit process’ but it doesn’t show any option for changing the feed interval. Do I need to add a new process for house power with a 60 second interval and delete theold one? (or am I being thick - it is a long time since I set everything up!)
@theoldschool its not possible to change the feed interval on an existing feed, what is the source of your solar data feed? is it at 60s interval or from an emontx or emonpi at 5-10s interval?
It’s from an emonpi & I assume it’s 10s interval - I didn’t change any of the defaults when I set it up. What I find strange is that for months there’s not been a problem but a week or two ago the problem started.
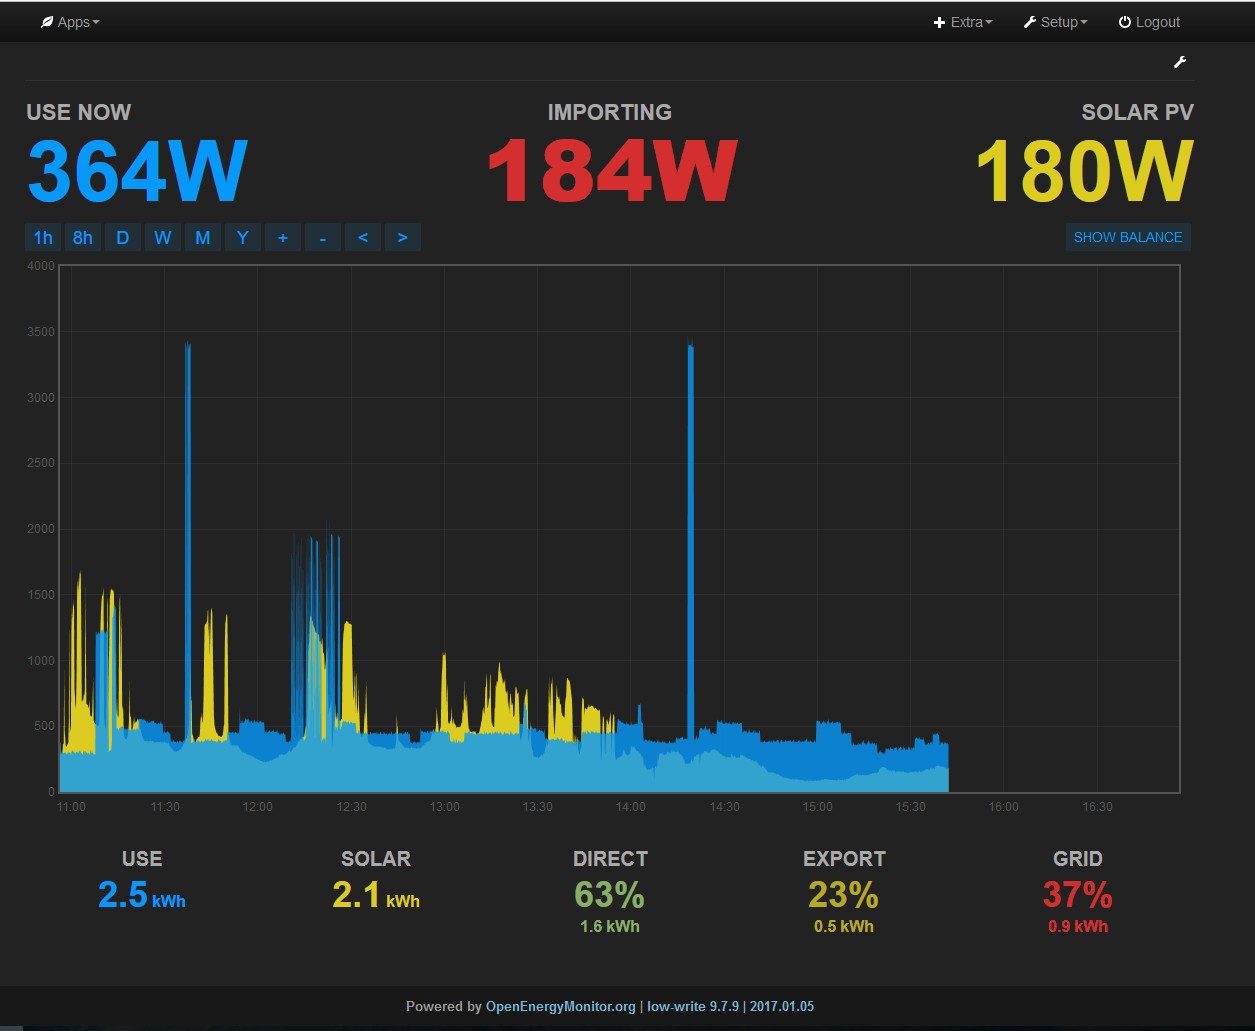
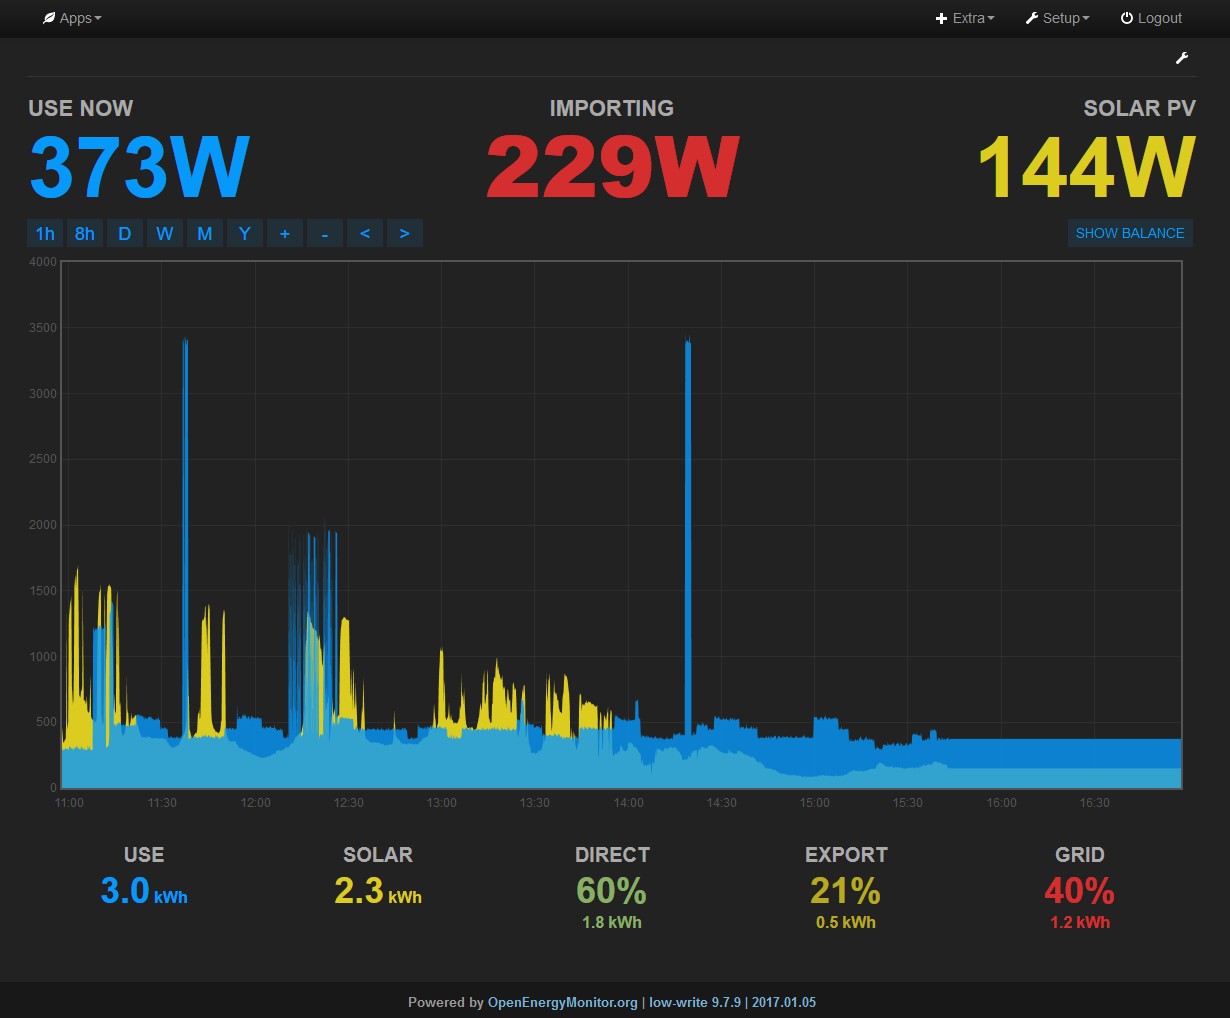
I leave my browser showing the app page and I took the screenshot below (‘unrefreshed’) of it at 5pm and as you can see there’s nothing after about 15:40 but when I refresh the page the blank area after 15:40 fills with a flatline graph (see second screenshot - ‘refreshed’)
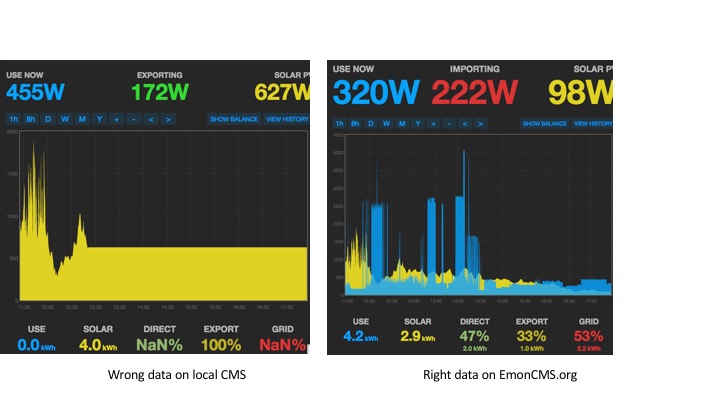
Hi to everybody. I had 180 days of perfect functioning, then are 6 days that the input are not working anymore, I guess after I did the weekly Jessie update (which involved apache2). Similarly to other members my local Solar app is currently showing flat values for solar and no consumption at all. All the other values are frozen as well. My EmonCMS on the web is instead reporting the correct values, as it gets them prom EmonPI in the right way and format. I tried to reboot the whole RPI2 and I chown pi:pi the whole folder under www as I saw that there were files which owner was root:root. I can live with this, but I would rather frefer to understand what went wrong after the update.
I also updated EmonPI and checked the db (no updates needed).
At the moment my feeds are in this situation:
my solar last update 4 hrs ago
solar_kwh 4hrs ago
import 31hrs
import_kwh, use, use_kwh was 6.9 days and now inactive.
I reply myself: I discovered that mosquitto service wasn’t up; I started it and it solved the issue, having the feed read again. Everything is currently as it should be.
Thanks for the great work! Keep going.