hi all
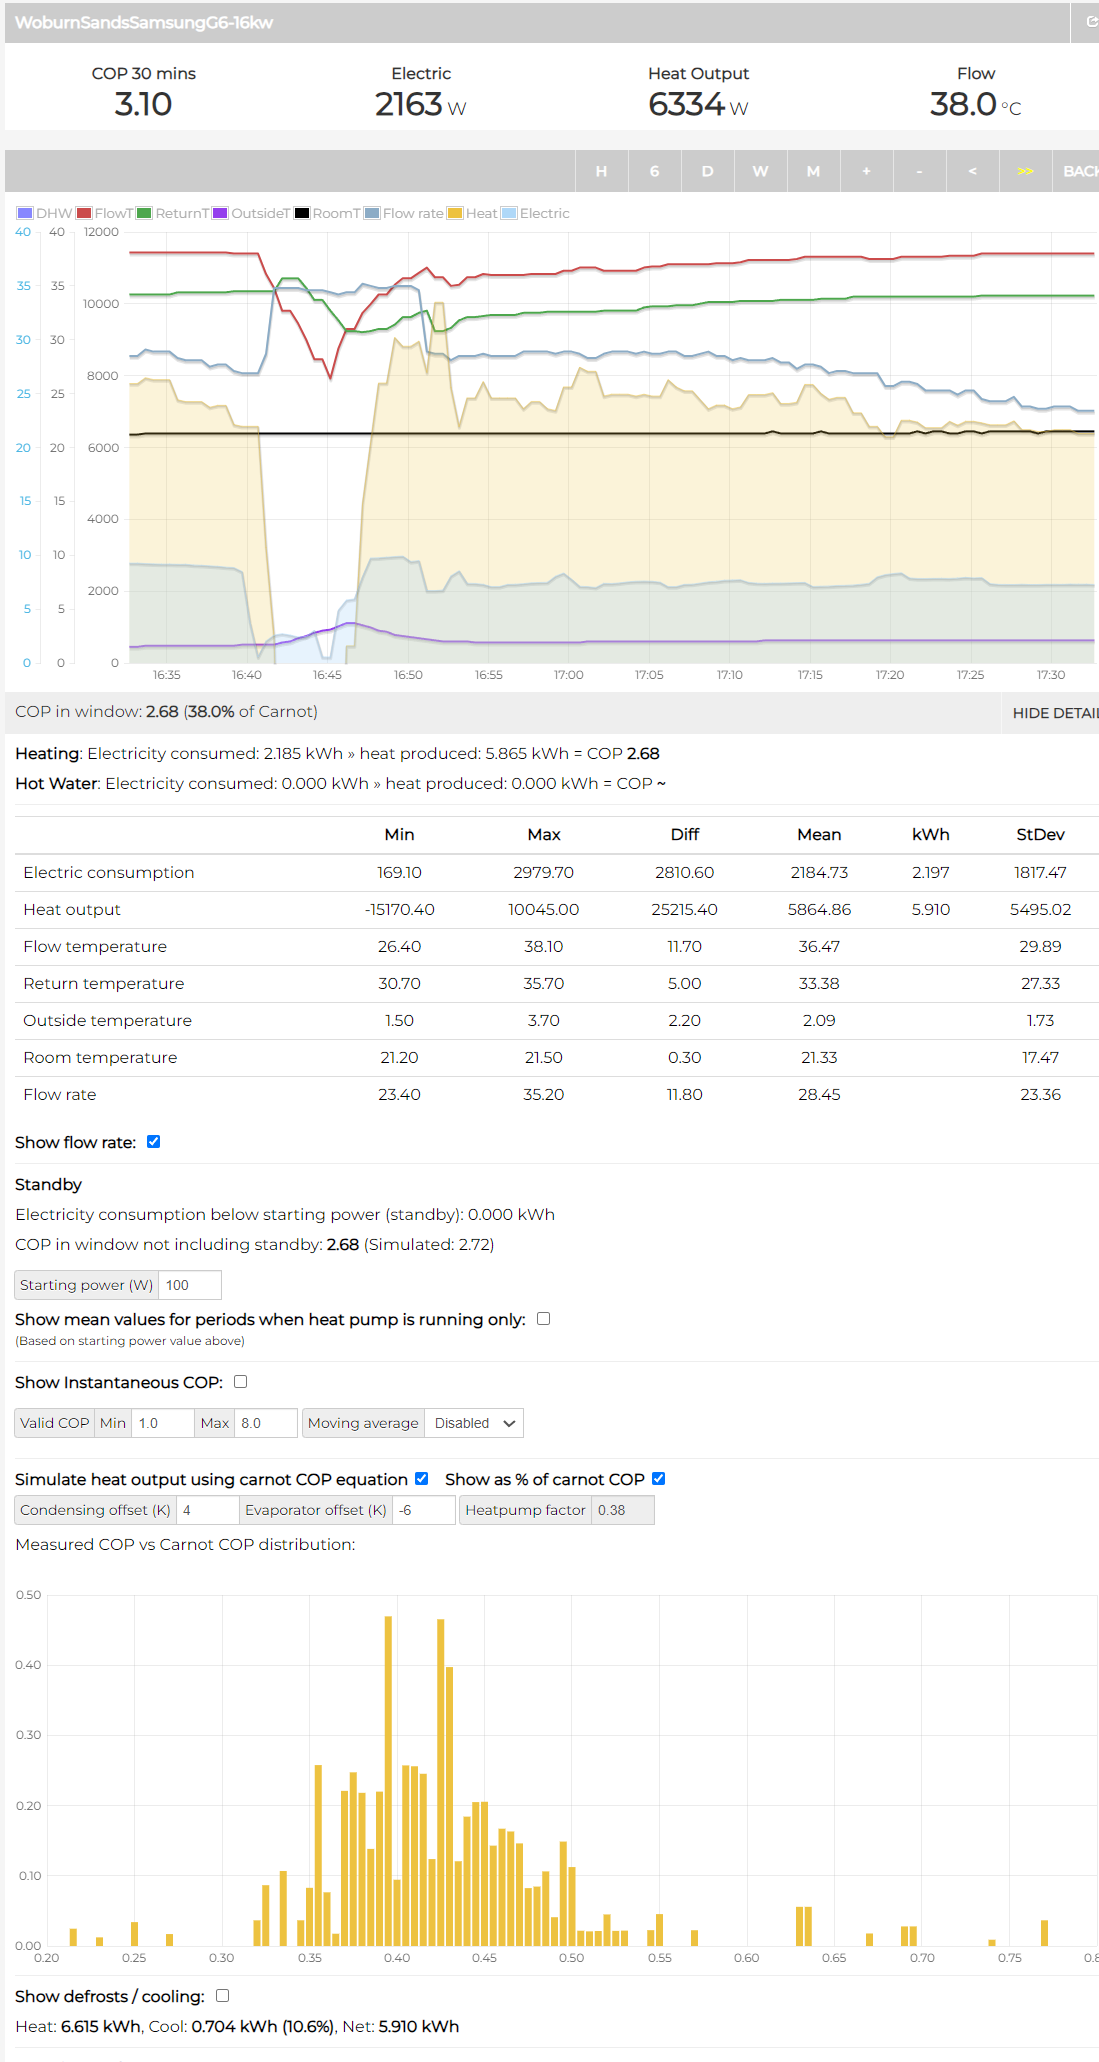
can someone possibly help me understand how to use the Carnot settings on the myheatpump app to analyse cold weather performance? I’ve read the previous threads that I can find on this subject but can’t quite figure it out which button does what. The “simulate heat output using Carnot equation” and “show as % of carnot COP” seem to be mutually exclusive, showing me different things - the former shows me (usually) that simulated = actual, but the % is usually around 40 and I’ve gleaned that 50 is what we’re aiming for (?)
Also the heatpump factor seems to change when I select different windows with different performance. Basically I can’t quite figure out why / what all this is telling me??
obviously performance is getting whacked by defrosts but I’m trying to understand if its doing “reasonably ok” when running. intuitively it feels like it could be better (Based place in on league table vs others  ) but on the other hand house is warm, system is stable (except defrosts of course) COP is tracking OAT quite linearly rather than going off a cliff, its about 3 when running at +2C, about 2.7 when running at -2C.
a snapshot of the last hour including a defrost
my system Emoncms - app view
ta in advance for any help
Ian
I can tell you how I use the feature, which may or may not be the correct way:
Zoom in on a period that looks to be stable and running well, and click the “Show as % of carnot COP” button. This automatically works out the “heatpump factor” that will make the formula match the heat output. Typically around 0.4 or 0.5.
Then untick that box to see the Carnot heat on the chart, and zoom out to see how well the other periods match to that value. Ideally, you’ll see it fit well all the time, but it’s quite common to see that the heatpump underperforms at the start of a cycle, during DHW cycles, and just before a defrost.
For instance, this stable period fits a heatpump factor of 0.5 quite nicely:
Whereas a few hours later, there are frequent defrosts, and performance is not as good as the Carnot formula simulates:
The Carnot formula is explained in Basics — OpenEnergyMonitor 0.0.1 documentation
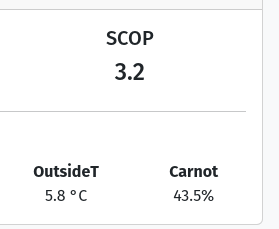
Also, the system summary on heatpumpmonitor.org shows the Carnot Cop for the last 30 days.
…and you can see how it’s changed over the year:
Also, using the Graph page on hpmorg you can see how Carnot varies across systems.
First, select “Last 30 days”, and then “Carnot Efficiency (%)”:

I’m not entirely sure what this means, if anything, but it might be of interest.