As we enter warmer months and have many more systems on the site, should we extend the default HeatpumpMonitor.org stats period to 90 days? Perhaps this could be extended gradually over the coming year so that in 6-9 months time it only shows systems with a full year of data on the default view? Giving a more accurate idea of what real world performance is over a full year for those accessing the site at a glance?
Yes this sounds sensible.
There are now over 84 heat pumps with sufficient data to be representative of the last 90days, I am taking the cut-off for that to be 86days (out of the last 90, ie 95% data availability).
Yes, a longer period would give a more representative view of performance.
It might also be useful to have shortcut for the “winter heating season”, i.e. fixed 120 days from November through to February.
We should look carefully at which numbers are marked as “SCOP” - this term should only be used for exactly 365 days of data. For instance, the number shown at the bottom of My Heatpump app next to Total Electricity input and Total Heat output shouldn’t be labeled as SCOP. Better to call this “Overall COP”.
I thought the S in SCOP stood for Seasonal, although I have never found a definition for this. I wouldn’t have thought that reserving this for a 365 day period makes sense. This should be referred to as ACOP.
As I don’t use the heat pump between late April and early October, what happens when I stop uploading data? Do I need to notify anyone?
Most monitoring systems are 365 24x7 which would imply you actively stop uploading? Why?
COP varies throughout the year, depending on the outdoor temperature and humidity. So, in order to compare heatpumps, SCOP or SPF (Seasonal Performance Factor) is quoted using the total heat production ÷ electrical consumption over the entire heating season, i.e. one year.
(Particularly if the heatpump is used through the summer to heat water; one could get away with shorter periods if the heat pump is off for part of the year, but it’s simpler to use the same 1 year for everyone)
If SCOP is calculated over a period that includes 2 winters and 1 summer, the result will be skewed. Same for a period covering 1 winter and 2 summers. So, for an accurate measure of performance, this should be done over a whole number of years.
Thanks all
Having switched this to 90 days for a couple of days without a proper announcement and in view of the flurry of messages to the effect of ‘why has my system disappeared?’ I wonder if we need to find a better way of indicating the stats period and switching between them.
One option would be to change the stats time period selector from a dropdown to a group of buttons at the top of the table which might be a clearer way of indicating that a different stats period has been selected?
It’s hard to balance here that on the one hand we should be highlighting the full year stats period as the most accurate reflection of real world SCOP performance and on the other that half the fun for a lot of people contributing systems is to see their system listed without having to wait too long a period…
how to get the right balance?
He he, yes whatever is selected as default is a little arbitrary, but being able to change parameters and graph/compare is fantastic, thanks.
I guess a value/protocol that matches as close as possible the way installations are evaluated elsewhere would be useful to third parties looking for easy to access performance data. Maybe a separate COP entry under ‘Top of the SCOPs’ where ‘Top of the SCOPs’ uses the industry agreed periods & parameters and the ‘COP’ allows the same/similar parameter selection as current?
I think the Heatpump + Fabric display is a useful way to look at over-all building efficiency all be it not all buildings are heated to the same temperature. I guess it depends where people want to set/define system boundaries.
Whatever is defaulted, there will be opportunities to play - as long as pumps have non-linear output/efficiency curves, SCOP can be boosted by running hotter than needed in the shoulder months. It puts the pump in an efficient state, avoiding too much cycling, but is certainly not the most efficiency over-all way to heat the building.
I lost my feed in early July and resolved it with your help. However i don’t seem to be able to find my system on the top of the Scops list on any of the drop downs. From the feed i am currently running at a scop of 3.94, registered under Potters Bar and fitted by Alex from Libtek. May i ask if it is a question of time before it will appear or can you point me in the right direction to resolve ? Apologies.
Hello @Gary1 yes it should appear again in a weeks time (minimum 72 days for 90 day window), I can see it if I set min days to e.g 0, it has 64 days in the last 90. So just needs another 8 days
Very grateful, I am still getting my head around the data and the potential for additional tech from Home Assistant, steep learning curve for a non tech enthusiast !
Hi, apologies for the follow up, we had a connection issue in July where the data fell to 17% which was all resolved with a new lead.
I note the data quality for September is 63%.
I noticed the flashing LED was operating at a pulse every 10 seconds but has another pulse after 3 seconds? Does this indicate to an issue?
I’m starting to think that it would be better if the default view on HeatpumpMonitor.org was now 365 days, we have a sufficient number of systems now to make that view interesting and the annual figure is the one that matters most at the end of the day.
I think at some point we should look at a different landing page. We could open on one of the cost pages perhaps? Agile or price cap?
My gut feeling is that COP/SCOP is still the best way to compare heat pumps.
Have you ever thought about relating COP/SCOP to outside temperature?
Maybe that is more of a leveller and could give a good comparison of performance? I haven’t really thought how that could be done though.
Cost doesn’t mean so much. I pay nothing on an annual basis, actually an income on my electricity account.
Thanks Matt, agreed cost gets complicated. What do you think of setting the default view to last 365 days?
I think 365 days is a good idea, it’s want you want to know really.
When you look at various heat pumps you can see that some are better than others at differing outdoor temperatures.
I haven’t really analysed the data but just as an example, I feel that Vaillants do really well compared to my Daikin when it is warmer but my Daikin seems better when it is cold, I could be wrong of course!
I think 365 days gives a good overall picture now you have lots of data.
It would be interesting to find some way to take account of outdoor temperatures.
Heat pumps are really complicated and interesting. I just find the whole concept of differing amounts of heat from the same amount of energy really fascinating.
I often wonder what is best, a heat pump that is good in the cold when you use more electricity or one that is good when it is milder.
I guess it depends where you live and what outdoor temperatures you experience most.
It could be an interesting study.
those with cooling will go down :
please push Cooling flag support · Issue #54 · openenergymonitor/heatpumpmonitor.org · GitHub
Agreed this is important to fix, will take a look at this next.
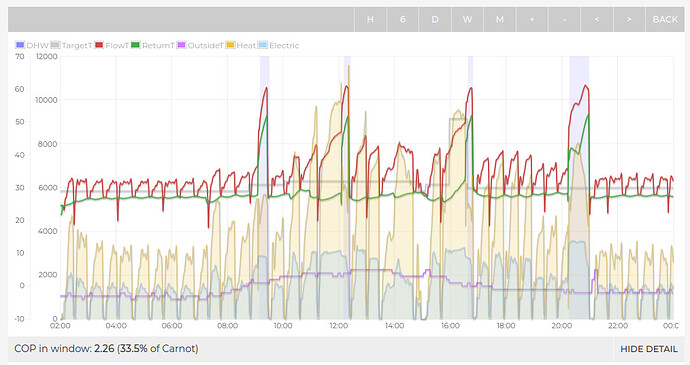
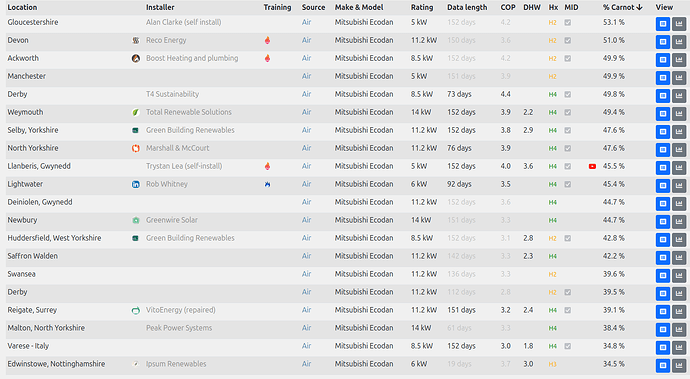
On a slightly different topic, I noticed that you get a low % carnot on your system e.g: usually mid 30s%
Can you think why this might be? It’s at the bottom of the range we are seeing from Ecodan’s, i.e you should be getting much better results based on the flow and outside temperatures that you are seeing…?
Hi, thanks
It’s not my system, it was to illustrate at that time.
Mine is Emoncms - app view
and my SCOP is lost after this summer in cooling mode ![]()
@TrystanLea I’ve noticed that even though my system only has metering errors for a handful of days at the start of my metering using OEM, now that I have over 90 days of metering, my system is still filtered out as a system with metering errors when filtering for 90 days. I’d expect the flag for errors to appear for the 365 day view, as there are errors within that time period… or do I need to wait til a whole year + 1 day?


